UNITED STATES
SECURITIES AND EXCHANGE COMMISSION
Washington, D.C. 20549
FORM 10-K
(Mark One)
ANNUAL REPORT PURSUANT TO SECTION 13 OR 15(d) OF THE SECURITIES EXCHANGE ACT OF 1934 | |||||
For the fiscal year ended December 31 , 2020
OR
| TRANSITION REPORT PURSUANT TO SECTION 13 OR 15(d) OF THE SECURITIES EXCHANGE ACT OF 1934 | |||||
For the transition period from to
.
Commission File Number 001-07845
(Exact name of registrant as specified in its charter)
| (State or other jurisdiction of incorporation or organization) | (I.R.S. Employer Identification No.) | ||||||||||
| (Address of principal executive offices) | (Zip code) | ||||||||||
Registrant’s telephone number, including area code: (417 ) 358-8131
SECURITIES REGISTERED PURSUANT TO SECTION 12(b) OF THE ACT:
| Title of Each Class | Trading Symbol | Name of each exchange on which registered | ||||||
Indicate by check mark if the registrant is a well-known seasoned issuer, as defined in Rule 405 of the Securities Act. Yes ☒ No ☐
Indicate by check mark if the registrant is not required to file reports pursuant to Section 13 or Section 15(d) of the Act. Yes ☐ No ☒
Indicate by check mark whether the registrant (1) has filed all reports required to be filed by Section 13 or 15(d) of the Securities Exchange Act of 1934 during the preceding 12 months (or for such shorter period that the registrant was required to file such reports), and (2) has been subject to such filing requirements for the past 90 days. Yes ☒ No ☐
Indicate by check mark whether the registrant has submitted electronically every Interactive Data File required to be submitted pursuant to Rule 405 of Regulation S-T (§232.405 of this chapter) during the preceding 12 months (or for such shorter period that the registrant was required to submit such files). Yes ☒ No ☐
Indicate by check mark whether the registrant is a large accelerated filer, an accelerated filer, a non-accelerated filer, a smaller reporting company, or an emerging growth company. See the definitions of “large accelerated filer,” “accelerated filer,” “smaller reporting company,” and “emerging growth company” in Rule 12b-2 of the Exchange Act.
| ☒ | Accelerated filer | ☐ | ||||||||||||
| Non-accelerated filer | ☐ | Smaller reporting company | ||||||||||||
| Emerging growth company | ||||||||||||||
If an emerging growth company, indicate by check mark if the registrant has elected not to use the extended transition period for complying with any new or revised financial accounting standards provided pursuant to Section 13(a) of the Exchange Act. ☐
Indicate by check mark whether the registrant has filed a report on and attestation to its management's assessment of the effectiveness of its internal control over financial reporting under Section 404(b) of the Sarbanes-Oxley Act (15 U.S.C. 7262(b)) by the registered public accounting firm that prepared or issued its audit report. ☒
Indicate by check mark whether the registrant is a shell company (as defined in Rule 12b-2 of the Act). Yes ☐ No ☒
The aggregate market value of the voting stock held by non-affiliates of the registrant (based on the closing price of our common stock on the New York Stock Exchange) on June 30, 2020 was $4,552,973,000 .
There were 132,987,415 shares of the registrant’s common stock outstanding as of February 16, 2021.
DOCUMENTS INCORPORATED BY REFERENCE
Part of Item 10, and all of Items 11, 12, 13, and 14 of Part III, are incorporated by reference from the Company’s definitive Proxy Statement for the Annual Meeting of Shareholders to be held on May 25, 2021.
TABLE OF CONTENTS
LEGGETT & PLATT, INCORPORATED—FORM 10-K
FOR THE YEAR ENDED December 31, 2020
Page Number | ||||||||
| PART I | ||||||||
| Item 1. | ||||||||
| Item 1A. | ||||||||
| Item 1B. | ||||||||
| Item 2. | ||||||||
| Item 3. | ||||||||
| Item 4. | ||||||||
| Supp. Item. | ||||||||
| PART II | ||||||||
| Item 5. | ||||||||
| Item 6. | ||||||||
| Item 7. | ||||||||
| Item 7A. | ||||||||
| Item 8. | ||||||||
| Item 9. | ||||||||
| Item 9A. | ||||||||
| Item 9B. | ||||||||
| PART III | ||||||||
| Item 10. | ||||||||
| Item 11. | ||||||||
| Item 12. | ||||||||
| Item 13. | ||||||||
| Item 14. | ||||||||
| PART IV | ||||||||
| Item 15. | ||||||||
| Item 16. | ||||||||
Forward-Looking Statements
This Annual Report on Form 10-K and our other public disclosures, whether written or oral, may contain “forward-looking” statements including, but not limited to: the profitable growth and operating performance of the Company; projections of Company revenue, income, earnings, capital expenditures, dividends, capital structure, cash from operations, cash repatriation, restructuring-related costs, tax impacts or other financial items, effective tax rate; maintenance of indebtedness under the commercial paper program; litigation exposure; LIFO reserve; our ability to deleverage; possible plans, goals, objectives, prospects, strategies, or trends concerning future operations; statements concerning future economic performance, possible goodwill or other asset impairment; access to liquidity; compliance with the debt covenant requirements; amount of fixed cost savings; raw material availability and pricing; supply chain disruptions; labor; nonwoven fabric, microchips, and chemical shortages; employee termination costs; and the underlying assumptions relating to the forward-looking statements. These statements are identified either by the context in which they appear or by use of words such as “anticipate,” “believe,” “estimate,” “expect,” “guidance,” “intend,” “may,” “plan,” “project,” “should,” or the like. All such forward-looking statements, whether written or oral, and whether made by us or on our behalf, are expressly qualified by the cautionary statements described in this provision.
Any forward-looking statement reflects only the beliefs of the Company or its management at the time the statement is made. Because all forward-looking statements deal with the future, they are subject to risks, uncertainties, and developments which might cause actual events or results to differ materially from those envisioned or reflected in any forward-looking statement. Moreover, we do not have, and do not undertake, any duty to update or revise any forward-looking statement to reflect events or circumstances after the date on which the statement was made. For all of these reasons, forward-looking statements should not be relied upon as a prediction of actual future events, objectives, strategies, trends, or results.
Readers should review Item 1A Risk Factors in this Form 10-K for a description of important factors that could cause actual events or results to differ materially from forward-looking statements. It is not possible to anticipate and list all risks, uncertainties, and developments which may affect our future operations or our performance, or which otherwise may cause actual events or results to differ materially from forward-looking statements. However, the known material risks and uncertainties include the following:
•the ongoing adverse impact on our trade sales, earnings, liquidity, cash flow, and financial condition caused by the COVID-19 pandemic which has had and, depending on the length and severity of the pandemic and the timing and effectiveness of any vaccines, could continue, in varying degrees, to materially negatively impact, among other things (i) the demand for our products and our customers’ products, growth rates in the industries in which we participate, and opportunities in those industries; (ii) our manufacturing facilities’ ability to remain open, or fully operational, obtain necessary raw materials and parts, maintain appropriate labor levels, and ship finished products to customers; (iii) operating costs related to pay and benefits for our terminated employees; (iv) our ability to collect trade and other notes receivables in accordance with their terms due to customer bankruptcy, financial difficulties or insolvency; (v) impairment of goodwill and long-lived assets; (vi) restructuring and related costs; and (vii) our ability to borrow under our revolving credit facility, including our ability to comply with the restrictive covenants in our credit facility that may limit our operational flexibility and our ability to pay our debt when it comes due;
•inability to “deleverage” after the ECS acquisition in the expected timeframe, due to increases or decreases in our capital needs, which may vary depending on a variety of factors, including, without limitation, demand for our products, cash flow, any acquisition or divestiture activity, our working capital needs, and capital expenditures;
•our ability to manage working capital;
•adverse changes in consumer confidence, housing turnover, employment levels, interest rates, trends in capital spending, and the like;
•factors that could impact raw materials and other costs, including the availability and pricing of steel scrap and rod, chemicals, nonwoven fabrics, microchips, the availability of labor, wage rates, and energy costs;
•our ability to pass along raw material cost increases through increased selling prices;
•price and product competition from foreign (particularly Asian and European) and domestic competitors;
•our ability to maintain profit margins if our customers change the quantity and mix of our components in their finished goods;
•our ability to access the commercial paper market;
•the speed at which vaccines for the COVID-19 virus are administered, the percentage of the population vaccinated, and the effectiveness of those vaccines;
1
•our ability to maintain and grow the profitability of acquired companies;
•adverse changes in political risk, and U.S. or foreign laws, regulations, or legal systems (including tax law changes);
•cash generation sufficient to pay the dividend;
•our ability to realize deferred tax assets on our balance sheet;
•cash repatriation from offshore accounts;
•tariffs imposed by the U.S. government that result in increased costs of imported raw materials and products that we purchase;
•our ability to maintain the proper functioning of our internal business processes and information systems through technology failures or otherwise;
•our ability to avoid modification or interruption of our information systems through cybersecurity breaches;
•the loss of business with one or more of our significant customers;
•our ability to comply with environmental, social, and governance responsibilities;
•litigation risks related to various contingencies including antitrust, intellectual property, contract disputes, product liability and warranty, taxation, environmental, and workers’ compensation expense;
•our borrowing costs and access to liquidity resulting from credit rating changes;
•business disruptions to our steel rod mill;
•risks related to operating in foreign countries, including, without limitation, credit risks, ability to enforce intellectual property rights, currency exchange rate fluctuations, industry labor strikes, increased customs and shipping rates, inconsistent interpretation, and enforcement of foreign laws;
•risks relating to the United Kingdom’s exit from the European Union (commonly known as “Brexit”);
•the continued effectiveness and enforcement of anti-dumping and countervailing duties on the import of innersprings and finished mattresses;
•our ability to realize gain from the sale of real estate;
•our ability to comply with privacy and data protection regulations; and
•our ability to comply with climate change laws and regulations.
2
PART I
PART I
Item 1. Business.
Summary
Leggett & Platt, Incorporated ("Leggett & Platt," "Company," "we," "us", or "our"), a pioneer of the steel coil bedspring, has become an international diversified manufacturer that conceives, designs, and produces a wide range of engineered components and products found in many homes and automobiles. As discussed below, our operations are organized into 15 business units, which are divided into seven groups under our three segments: Bedding Products; Specialized Products; and Furniture, Flooring & Textile Products.
Overview of Our Segments
Bedding Products Segment
| BEDDING GROUP | ||
| Steel Rod | ||
| Drawn Wire | ||
| U.S. Spring | ||
| Specialty Foam | ||
| Adjustable Bed | ||
| International Spring | ||
| Machinery | ||
Our Bedding Products segment has its roots in the Company's founding in 1883 with the manufacture of steel coil bedsprings. Today, we support our customers' needs from raw materials to components to finished mattresses and foundations to distribution and fulfillment. Our innerspring, specialty foam, and finished product development and production capabilities allow us to create value at each point, from raw materials all the way to private label finished goods and delivery to the consumer.
We operate a steel rod mill in the U.S. with historical annual output of about 500,000 tons. A substantial majority of that output has been used by our two U.S. wire mills that have supplied virtually all of the wire consumed by our other domestic businesses. We also supply steel rod and wire to trade customers that operate in a broad range of markets.
We are a major supplier of adjustable beds, with domestic manufacturing, distribution, e-commerce fulfillment, and global sourcing capabilities. We also produce machinery used by bedding manufacturers in the production and assembly of their finished products. Our range of products offers our customers a single source for many of their component and finished product needs.
These innovative proprietary products and our efficient and low-cost vertical integration have made us the largest U.S. manufacturer in many of these businesses. We strive to understand what drives consumer purchases in our markets and focus our product development activities on meeting end-consumer needs. We believe we attain a cost advantage from efficient manufacturing methods, internal production of key raw materials, large-scale production, and purchasing leverage. Sourcing components and finished products from us allows our customers to focus on designing, merchandising, and marketing their products.
3
PART I
PRODUCTS
Bedding Group
| • | Steel rod | ||||||||||
| • | Drawn wire | ||||||||||
| • | Specialty foam chemicals and additives | ||||||||||
| • | Innersprings (sets of steel coils, bound together, that form the core of a mattress) | ||||||||||
| • | Proprietary specialty foam for use primarily in bedding and furniture | ||||||||||
| • | Private label finished mattresses, often sold compressed and boxed | ||||||||||
| • | Ready-to-assemble mattress foundations | ||||||||||
| • | Wire forms for mattress foundations | ||||||||||
| • | Adjustable beds | ||||||||||
| • | Machines that we use to shape wire into various types of innersprings | ||||||||||
| • | Industrial sewing and quilting machines | ||||||||||
| • | Mattress-packaging and glue-drying equipment | ||||||||||
CUSTOMERS
| • | We used about 70% of our wire output to manufacture our own products in 2020, with the majority going to our U.S. innerspring operations | ||||||||||
| • | Various industrial users of steel rod and wire | ||||||||||
| • | Manufacturers of finished bedding (mattresses and foundations) | ||||||||||
| • | Bedding brands and mattress retailers | ||||||||||
| • | E-commerce retailers | ||||||||||
| • | Big box retailers, department stores, and home improvement centers | ||||||||||
Specialized Products Segment
| AUTOMOTIVE GROUP | ||
| Automotive | ||
| AEROSPACE PRODUCTS GROUP | ||
| Aerospace Products | ||
| HYDRAULIC CYLINDERS GROUP | ||
| Hydraulic Cylinders | ||
Our Specialized Products segment designs, manufactures, and sells products including automotive comfort and convenience systems, tubing and fabricated assemblies for the aerospace industry, and hydraulic cylinders for the material handling, construction, and transportation industries. In our Automotive business, our technical capability and deep customer engagement allows us to compete on critical functionality, such as comfort, size, weight, and noise. We believe our reliable product development and launch capability, coupled with our global footprint, makes us a trusted partner for our Tier 1 and Original Equipment Manufacturer (OEM) customers.
4
PART I
PRODUCTS
Automotive Group
| • | Mechanical and pneumatic lumbar support and massage systems for automotive seating | ||||||||||
| • | Seat suspension systems | ||||||||||
| • | Motors and actuators, used in a wide variety of vehicle power features | ||||||||||
| • | Cables | ||||||||||
Aerospace Products Group
| • | Titanium, nickel and stainless-steel tubing, formed tube, tube assemblies, and flexible joint components, primarily used in fluid conveyance systems | ||||||||||
Hydraulic Cylinders Group
| • | Engineered hydraulic cylinders | ||||||||||
CUSTOMERS
| • | Automobile OEMs and Tier 1 suppliers | ||||||||||
| • | Aerospace OEMs and suppliers | ||||||||||
| • | Mobile equipment OEMs, primarily serving material handling and construction markets | ||||||||||
Furniture, Flooring & Textile Products Segment
| HOME FURNITURE GROUP | ||
| Home Furniture | ||
| WORK FURNITURE GROUP | ||
| Work Furniture | ||
| FLOORING & TEXTILE PRODUCTS GROUP | ||
| Flooring Products | ||
| Fabric Converting | ||
| Geo Components | ||
In our Furniture, Flooring & Textile Products segment, we design, manufacture, and distribute a wide range of components and finished products for residential and commercial markets, and select markets for structural fabrics and geo components. We supply components used by home and work furniture manufacturers to provide comfort, motion, and style in their finished products, as well as select lines of private label finished furniture. We also produce or distribute carpet cushion and hard surface flooring underlayment, as well as fabrics and geo components used in a variety of applications.
5
PART I
PRODUCTS
Home Furniture Group
| • | Steel mechanisms and motion hardware (enabling furniture to recline, tilt, swivel, rock, and elevate) for reclining chairs, sofas, sleeper sofas, and lift chairs | ||||||||||
| • | Springs and seat suspensions for chairs, sofas, and loveseats | ||||||||||
Work Furniture Group
| • | Components and private label finished goods for collaborative soft seating | ||||||||||
| • | Bases, columns, back rests, casters, and frames for office chairs, and control devices that allow chairs to tilt, swivel, and elevate | ||||||||||
Flooring & Textile Products Group
| • | Carpet cushion and hard surface flooring underlayment (made from bonded scrap foam, fiber, rubber, and prime foam) | ||||||||||
| • | Structural fabrics for mattresses, residential furniture, and industrial uses | ||||||||||
| • | Geo components (synthetic fabrics and various other products used in ground stabilization, drainage protection, erosion, and weed control) | ||||||||||
CUSTOMERS
| • | Manufacturers of upholstered furniture | ||||||||||
| • | Office furniture manufacturers | ||||||||||
| • | Flooring retailers and distributors, including big box retailers and home improvement centers | ||||||||||
| • | Contractors, landscapers, road construction companies, retailers, and government agencies using or selling geo components | ||||||||||
| • | Mattress and furniture producers and manufacturers of packaging, filtration, and draperies | ||||||||||
6
PART I
Revised Segment Structure
Our operations are comprised of 132 manufacturing facilities located in 17 countries around the world. Our reportable segments are the same as our operating segments, which also correspond with our management organizational structure. To reflect how we manage our businesses, and in conjunction with the change in executive officer leadership, our management organizational structure and all related internal reporting changed effective January 1, 2020. As a result, our segment reporting changed to reflect the new structure. These segment changes are retrospectively applied to all prior periods presented. The modified structure consists of three segments, seven business groups, and 15 business units organized as follows:
Bedding Products Segment 1 | Specialized Products Segment 2 | Furniture, Flooring & Textile Products Segment 3 | ||||||||||||
| BEDDING GROUP | AUTOMOTIVE GROUP | HOME FURNITURE GROUP | ||||||||||||
| Steel Rod | Automotive | Home Furniture | ||||||||||||
| Drawn Wire | ||||||||||||||
| U.S. Spring | AEROSPACE PRODUCTS GROUP | WORK FURNITURE GROUP | ||||||||||||
| Specialty Foam | Aerospace Products | Work Furniture | ||||||||||||
| Adjustable Bed | ||||||||||||||
| International Spring | HYDRAULIC CYLINDERS | FLOORING & TEXTILE | ||||||||||||
| Machinery | GROUP | PRODUCTS GROUP | ||||||||||||
| Hydraulic Cylinders | Flooring Products | |||||||||||||
| Fabric Converting | ||||||||||||||
| Geo Components | ||||||||||||||
1 The new segment consists of the former Residential Products and Industrial Products segments, plus the former Consumer Products Group (which is renamed the Adjustable Bed business unit), minus the former Fabric & Flooring Products Group (which is renamed the Flooring & Textile Products Group). The Bedding Products Segment generated 48% of our trade sales during 2020.
2 The Specialized Products segment generated 21% of our trade sales during 2020.
3 The new segment consists of the former Furniture Products segment, plus the former Fabric & Flooring Products Group (which is renamed the Flooring & Textile Products Group) minus the former Consumer Products Group (which is renamed the Adjustable Bed business unit). The Furniture, Flooring & Textile Products Segment generated 31% of our trade sales in 2020.
Strategic Priorities
Primary Financial Metric
Total Shareholder Return (TSR), relative to peer companies, is a primary financial measure that we use to assess long-term performance. TSR = (Change in Stock Price + Dividends)/Beginning Stock Price. Our goal is to achieve TSR in the top third of the S&P 500 companies over rolling three-year periods through an approach that employs four TSR drivers: revenue growth, margin expansion, dividends, and share repurchases.
Our incentive programs reward return and cash generation, and profitable growth. Senior executives participate in a TSR-based incentive program (based on our performance compared to a group of approximately 300 peers). For information about our TSR targets, see the discussion under "Total Shareholder Return" in Item 7, Management's Discussion and Analysis of Financial Condition and Results of Operations on page 34.
7
PART I
Disciplined Growth
The expected long-term contribution to TSR from revenue growth is 6-9%. From 2018 to 2020, we generated combined unit volume and acquisition growth of 2% per year on average. We also benefited slightly from commodity inflation, resulting in total revenue growth of 3% per year on average.
We will continue to make investments to support expansion in current businesses and product lines where sales are growing profitably. We also envision periodic acquisitions that add capabilities in these businesses or provide opportunities to enter more diverse, faster-growing, and higher margin markets. We expect all acquisitions to have a clear strategic rationale, a sustainable competitive advantage, a strong fit with the Company, and be in attractive and growing markets.
Returning Cash to Shareholders
From 2018 to 2020, we generated $1.71 billion of operating cash, and we returned much of this cash to shareholders in the form of dividends ($610 million) and share repurchases ($139 million). Our top priorities for use of cash are organic growth (capital expenditures), dividends, and strategic acquisitions. Historically, after funding those priorities, we generally repurchased stock with remaining available cash. Currently, because of the debt level increases in connection with the ECS acquisition in early 2019, we have and expect to continue to focus instead on deleveraging by temporarily limiting share repurchases, controlling the pace of acquisition spending, and using operating cash flow to repay debt.
For information about dividends and share repurchases, see the discussion under "Pay Dividends" and "Repurchase Stock" in Item 7, Management's Discussion and Analysis of Financial Condition and Results of Operations beginning on page 53.
2020 Market Volatility Challenges and Our Response
The impact of the COVID-19 pandemic began in January 2020, directly affecting our operations in China, as well as the global supply chain. The crisis accelerated, impacting virtually all geographies by mid-March. We took action to:
•Implement comprehensive safety protocols,
•Monitor and manage supply chain risks,
•Align our variable cost structure to demand levels,
•Significantly reduce fixed costs and cut capital expenditures,
•Prioritize accounts receivable collections and inventory management, and
•Amend the financial covenant in our revolving credit facility to provide additional liquidity.
These efforts helped to strengthen cash flow and protect our balance sheet as we moved through the year. By mid-second quarter 2020, we began to see rapid recovery in businesses serving home-related markets. With consumers spending less on travel and entertainment, they began investing more in their homes. This benefited our Bedding, Home Furniture, Flooring, and Textiles businesses.
In addition, the long-term trends in the bedding market that led us to acquire Elite Comfort Solutions (ECS) in early 2019 accelerated as a result of the pandemic. Consumers have increasingly purchased compressed mattresses, including hybrids, online and through various retail channels. Because of ECS, we have benefited from this shift to an omni-channel environment.
As demand recovered in Bedding in the third quarter of 2020, we began to face global constraints.
•Nonwoven fabrics used in the production of ComfortCore® innersprings were diverted into use for face masks, hospital gowns, and other personal protective equipment.
•Labor availability was impacted by the pandemic itself, as well as government restrictions and relief programs. Labor issues were amplified by the rapid change in our production needs. Our operations shifted from a near shutdown in early April to customer demand in excess of pre-pandemic levels in a matter of weeks across many of our businesses.
8
PART I
•Chemical shortages emerged as producers of the chemicals used to make foam were impacted by tropical storms and hurricanes and reported a variety of equipment and production issues.
We made progress on both the nonwoven fabrics and labor shortages as we moved through 2020. Chemical shortages are ongoing and are expected to continue through at least mid-2021.
As sales recovered in the third and fourth quarters of 2020, we maintained most of the fixed cost reductions, adding costs only to support higher volumes and future growth opportunities. Margins benefited from this cost discipline. We ended the year with fixed cost savings of approximately $90 million.
For more information regarding the impact of COVID-19 on our business, refer to "COVID-19 Impacts on our Business" in Item 7, Management's Discussion and Analysis of Financial Condition and Results of Operations beginning on page 35.
Acquisitions
2020
There were no acquisitions of businesses in 2020. However, we paid approximately $8 million of additional consideration associated with an upholstered office furniture business in Poland acquired in a prior year.
2019
In January 2019, we completed the acquisition of ECS for cash consideration of approximately $1.25 billion. ECS is a leader in proprietary specialized foam technology, primarily for the bedding and furniture industries. ECS operates a vertically-integrated model, developing many of the chemicals and additives used in foam production, producing specialty foam, and manufacturing private label finished products. These innovative specialty foam products include finished mattresses sold through both traditional and online channels, mattress components, mattress toppers and pillows, and furniture foams. ECS operates within the Bedding Products segment.
In December 2019, we acquired a manufacturer and distributor of a wide range of geosynthetic fabrics, grids, and erosion control products for cash consideration of approximately $21 million. The acquisition is reported in our Geo Components business unit within the Furniture, Flooring & Textile Products segment.
2018
In January 2018, we acquired Precision Hydraulic Cylinders (PHC), a leading global manufacturer of engineered hydraulic cylinders primarily for the materials handling market. The total consideration paid was $87 million. PHC serves a market of mainly large OEM customers utilizing highly engineered components with long product life-cycles that represent a small part of the end product’s cost. PHC operates within the Specialized Products segment.
We also acquired two small Geo Components businesses for total consideration of $22 million. They manufacture and distribute silt fencing and home and garden products.
For more information regarding our acquisitions, please refer to Note R on page 125 of the Notes to Consolidated Financial Statements.
9
PART I
Divestitures
In 2020, we divested two small businesses in our Bedding Products segment: a specialty wire operation in our Drawn Wire business, with annual sales of $30 million, and the final operation in our former Fashion Bed business, with annual sales of $15 million. The businesses were sold for an aggregate selling price of approximately $11 million. There were no divestitures in 2019 or 2018.
Foreign Operations
The percentages of our trade sales related to products manufactured outside the United States for the previous three years were 37%, 34%, and 34% in 2018, 2019, and 2020, respectively. Sales by ECS (acquired in January 2019) are not included in the 2018 total. Substantially all ECS sales are in the United States. Our Specialized Products segment has a larger percentage of trade sales manufactured outside the United States, relative to our other two segments, which ranged between 80% and 85% over the last three years.
Our international operations are principally located in Europe, China, Canada, and Mexico. Our products in these foreign locations primarily consist of:
Europe
| • | Innersprings for mattresses | ||||
| • | Lumbar and seat suspension systems for automotive seating and actuators for automotive applications | ||||
| • | Seamless and welded tubing and fabricated assemblies for aerospace applications | ||||
| • | Select lines of private label finished furniture | ||||
| • | Machinery and equipment designed to manufacture innersprings for mattresses | ||||
China
| • | Lumbar and seat suspension systems for automotive seating | ||||
| • | Cables, motors, and actuators for automotive applications | ||||
| • | Recliner mechanisms and bases for upholstered furniture | ||||
| • | Work furniture components, including chair bases and casters | ||||
| • | Innersprings for mattresses | ||||
Canada
| • | Lumbar supports for automotive seats | ||||
| • | Fabricated wire for the furniture and automotive industries | ||||
| • | Work furniture chair controls and bases | ||||
Mexico
| • | Lumbar and seat suspension systems for automotive seating | ||||
| • | Adjustable beds | ||||
| • | Innersprings and fabricated wire for the bedding industry | ||||
| • | Select lines of private label finished furniture | ||||
10
PART I
Geographic Areas of Operation
As of December 31, 2020, we had 132 manufacturing facilities; 84 located in the U.S. and 48 located in 16 foreign countries, as shown below. We also had various sales, warehouse, and administrative facilities. However, our manufacturing plants are our most important properties.
| Bedding Products | Specialized Products | Furniture, Flooring & Textile Products | |||||||||
| North America | |||||||||||
| Canada | n | n | |||||||||
| Mexico | n | n | n | ||||||||
| United States | n | n | n | ||||||||
| Europe | |||||||||||
| Austria | n | ||||||||||
| Belgium | n | ||||||||||
| Croatia | n | ||||||||||
| Denmark | n | ||||||||||
| France | n | ||||||||||
| Hungary | n | ||||||||||
| Poland | n | ||||||||||
| Switzerland | n | ||||||||||
| United Kingdom | n | n | |||||||||
| South America | |||||||||||
| Brazil | n | ||||||||||
| Asia | |||||||||||
| China | n | n | n | ||||||||
| India | n | ||||||||||
| South Korea | n | ||||||||||
| Africa | |||||||||||
| South Africa | n | ||||||||||
11
PART I
Dependence on Market Demand for Key Product Families
Our business is dependent upon the market demand for, and continued sale of various product families. The following table shows our approximate percentage of trade sales by product family for the last three years which indicate the degree of dependence upon market demand:
| Product Families | 2020 | 2019 | 2018 | |||||||||||||||||||||||
Bedding Group 1 | 48 | % | 48 | % | 42 | % | ||||||||||||||||||||
| Flooring & Textile Products Group | 19 | 16 | 17 | |||||||||||||||||||||||
| Automotive Group | 17 | 17 | 19 | |||||||||||||||||||||||
| Home Furniture Group | 7 | 8 | 9 | |||||||||||||||||||||||
| Work Furniture Group | 5 | 6 | 7 | |||||||||||||||||||||||
| Aerospace Products Group | 2 | 3 | 4 | |||||||||||||||||||||||
Hydraulic Cylinders Group | 2 | 2 | 2 | |||||||||||||||||||||||
1 The Company acquired ECS, a leader in proprietary specialized foam technology, primarily for the bedding and furniture industries, in January 2019.
The Company does not have a material amount of sales derived from government contracts subject to renegotiation of profits or termination at the election of any government. As such, our business is not materially dependent upon governmental customers.
Sources and Availability of Raw Materials
The products we manufacture require a variety of raw materials. We believe that worldwide supply sources are readily available for all the raw materials we use, except for nonwoven fabrics, microchips, and certain chemicals as explained below. Among the most important raw materials that we use are:
| • | Various types of steel, including scrap, rod, wire, sheet, and stainless | ||||
| • | Chemicals used in foam production | ||||
| • | Foam scrap | ||||
| • | Woven and nonwoven fabrics | ||||
| • | Titanium and nickel-based alloys and other high strength metals | ||||
| • | Electronic systems | ||||
As a result of the COVD-19 pandemic, the U.S. and other governments have ordered that certain nonwoven fabrics used to produce ComfortCore® innersprings be prioritized to produce medical supplies, resulting in shortages of the fabrics for non-medical applications. These shortages and strong bedding demand have caused us temporarily to be unable to supply full industry demand for ComfortCore®. We are engaging with customers in an effort to work through these issues. The shortages have resulted in higher pricing for nonwoven fabrics. If we are unable to obtain the fabrics, cannot pass the cost along to our customers, are required to modify existing contracts to accommodate customers, or pay damage claims to customers, our results of operations may be negatively impacted.
Because of the shift of production by semiconductor microchip manufacturers to consumer electronics, such as laptops and tablets for home schooling and home offices, and away from automotive applications during the COVID-19 related automotive industry shutdowns in 2020, currently there is a shortage of microchips in the automotive industry. Our Automotive Group uses the microchips in seat comfort products, and to a lesser extent in motors and actuators. Although, to date, our Automotive Group has been able to obtain an adequate supply of microchips, we are dependent on our suppliers to deliver these microchips in accordance with our production schedule, and a shortage of the microchips can disrupt our operations and our ability to deliver products to our customers. Also, because of the industry shortage, automotive OEMs and other suppliers have not been able to secure an adequate supply of microchips, and as a result have reduced their production of automobiles or parts, which in turn has recently reduced, and may continue to reduce our sale
12
PART I
of products. If we cannot secure an adequate supply of microchips in our supply chain, and the microchips cannot be sourced from a different supplier, or the automotive OEMs and other suppliers continue to reduce their production as a result of such shortage, this may negatively impact our sales, earnings, and financial condition.
Although not directly related to the pandemic, we have experienced supply shortages with certain chemicals used in foam production. This has impacted our ability to supply specialty foam. The shortages have also resulted in higher pricing for the chemicals. If we are unable to obtain the chemicals or pass the cost along to our customers, our results of operations may be negatively impacted.
We supply our own raw materials for many of the products we make. For example, we produce steel rod that we make into steel wire, which we then use to manufacture innersprings and foundations for mattresses. We supply a substantial majority of our domestic steel rod requirements through our own rod mill. Our wire drawing mills supply nearly all of our U.S. requirements for steel wire.
Customer Concentration
We serve thousands of customers worldwide, sustaining many long-term business relationships. In 2020, our largest customer accounted for approximately 6% of our consolidated revenues. Our top 10 customers accounted for approximately 35% of these consolidated revenues. The loss of one or more of these customers could have a material adverse effect on the Company as a whole, and on the respective segment in which the customer’s sales are reported, including each of our segments.
Patents and Trademarks
As of December 31, 2020, we had 1,517 patents issued, 567 patents in process, 997 trademarks registered and 89 trademarks in process. No single patent or group of patents, or trademark or group of trademarks, is material to our operations as a whole. A significant number of our patents relate to products manufactured in each of our three segments, while over half of our trademarks relate to products manufactured by the Bedding Products segment. We do not have any patent or group of patents, the expiration of which would have a material negative effect on our results of operations or financial condition.
Our patents and trademarks include intellectual property acquired with ECS in January 2019 related to the protection of technology around various foam applications. These include specialty polyols and additives that enhance foam performance by reducing heat retention, improving durability and diminishing odor.
s
Some of our most significant trademarks include:
| • | ComfortCore®, Mira-Coil®, VertiCoil®, Quantum®, Nanocoil®, Softech®, Lura-Flex®, Superlastic® and Active Support Technology® (mattress innersprings) | ||||
| • | Energex® and Coolflow® (specialty foam products) | ||||
| • | Semi-Flex® (box spring components and foundations) | ||||
| • | Spuhl®and Fides® (mattress innerspring manufacturing machines) | ||||
| • | Wall Hugger® (recliner chair mechanisms) | ||||
| • | No-Sag® (wire forms used in seating) | ||||
| • | LPSense® (capacitive sensing) | ||||
| • | Hanes® (fabric materials) | ||||
| • | Schukra® (automotive seating products) | ||||
| • | Gribetz®and Porter® (quilting and sewing machines) | ||||
13
PART I
Product Development
One of our strongest performing product categories across the Company is ComfortCore®, our fabric-encased innerspring coils used in hybrid and other mattresses. Our ComfortCore® volume continues to grow, and represented over 60% of our U.S. innerspring units in 2020. A growing number of our ComfortCore® innersprings contain a feature we call Quantum® Edge. These are narrow-diameter, fabric-encased coils that form a perimeter around an innerspring set, replacing a rigid foam perimeter in a finished mattress. In 2020, over 50% of our ComfortCore® innersprings in the U.S. had the Quantum® Edge feature, and Quantum® Edge continues to grow.
With the January 2019 acquisition of ECS, we gained important proprietary technologies in the production of specialty foams, primarily for the bedding and furniture industries. ECS formulates many of the chemicals and additives used in foam production. These branded, specialty polyols and additives enhance foam performance by reducing heat retention, improving durability and diminishing odor. These innovations enable us to create quality mattresses that can be compressed, and we have a significant amount of intellectual property around these specialty chemical formulations.
Many of our other businesses are engaged in product development activities to protect our market position and support ongoing growth.
Human Capital Management
We understand that the Company’s long-term success depends on our ability to attract and retain diverse talent, develop that talent, and plan for future succession. We also recognize the importance of keeping our employees safe. In the following sections, we discuss our efforts to achieve these objectives.
Our Employees
Our Employees. At year-end 2020, we had approximately 20,400 employees, of which 15,100 were engaged in production and 11,400 were international employees (including 5,700 in Asia and 2,600 in Europe). Of these employees, 7,100 were in Bedding Products, 7,700 were in Specialized Products, and 4,800 were in Furniture, Flooring & Textile Products, with the remainder at our corporate office or in other roles. At year-end 2019, we had approximately 22,000 employees.
Collective Bargaining. At year-end 2020, 17% of our employees were represented by labor unions that collectively bargain for work conditions, wages, or other issues. We did not experience any material work stoppage related to labor contract negotiations during 2020. Management is not aware of circumstances likely to result in a material work stoppage related to contract negotiations with labor unions during 2021.
Our Ability to Attract, Recruit, and Retain Employees
Although we operate in competitive labor markets, we strive to attract, recruit, and retain employees through competitive compensation and benefit programs, learning and development opportunities that support career growth and advancement opportunities, and employee engagement initiatives that foster a strong Company culture.
Competitive Compensation and Benefits. In addition to cash compensation, we offer customary benefits in accordance with local regulatory requirements, and in addition many of our locations offer health and wealth benefits to eligible employees and their dependents which may include, but are not limited to, health insurance, dental and vision plans, retirement savings with matching contributions, and income protection benefits, such as short and long-term disability insurance, life insurance, and paid leave benefits that include vacation, personal time, and holidays. In the U.S., we offer a well-being program which includes counseling, legal and financial consultation, work-life assistance, and crisis intervention services. Additionally, in the U.S. and Canada, our employees are eligible to participate in discount stock purchase plans. We also provide cash and equity incentive programs for key management employees based on our performance. Finally, where applicable, we support the work-life balance of our employees, including part-time jobs, flexible hours, and remote working.
14
PART I
Employee Engagement. At many of our locations, we analyze employee satisfaction and attempt to enhance engagement and mitigate related risks. We periodically conduct employee surveys at certain operations to evaluate the employee relations environment. Voluntary employee turnover data is gathered and analyzed. The results of surveys and data analyses are used to assess human capital risks and identify opportunities for more meaningful employee engagement. From this analysis, action plans are developed, and branch-level initiatives are adopted to improve engagement and reduce turnover. We also engage with our employees through our Ethics Hotline, which serves as a grievance-reporting mechanism. Employees can express concerns, confidentially and anonymously, regarding possible violations of ethics, law, or our policies.
Turnover Rates. We rely on a diverse workforce to sustain our strategies and deliver our results of operations. In order to achieve our goals, this workforce must be stable. In 2020, our voluntary turnover rate in the U.S. was 17.3%, which we believe is reasonably comparable to average voluntary turnover rates of manufacturers in the industries in which we operate.
Our Inclusion, Diversity and Equity
We continue to foster a culture of inclusion, diversity, and equity in which everyone is respected, valued, and has an equal opportunity to contribute, thrive, and advance. Our commitment is unwavering, and we are steadfast in maintaining our focus on building a workforce that represents the many customers we serve and the communities in which we operate around the world.
Fostering an Inclusive and Diverse Culture. Diverse teams generate better ideas and make better decisions. We believe that companies who lead in inclusion and diversity also lead financially. We have created a strategy and action plans designed to foster an inclusive and diverse culture that aligns with our values and priorities.
Inclusion and Diversity Plan. In 2020, we established an inclusion and diversity team comprised of a broad group of employees including senior management. The team established long-term strategies and action plans designed to: (i) ensure that we have a safe and inclusive workplace; (ii) equip our people to attract, develop, retain, and reward a diverse and inclusive workforce; (iii) be an inclusive and equitable corporate citizen; (iv) develop a governance and accountability model that will sustain inclusion and diversity; and (v) enhance our business results.
Equal Opportunity. We are committed to equal opportunity and base workplace decisions solely on merit, qualifications, and other job-related, neutral, non-discriminatory criteria. We provide equal employment opportunity without regard to age, race, color, sex, sexual orientation, gender identity, national origin, citizenship, pregnancy, religion, disability, military status, genetic information, or other status protected by law. We are committed to providing a harassment-free work environment, and we prohibit retaliation, intimidation, threats, coercion, or discrimination against individuals who, in good faith, complain of unlawful discrimination or harassment.
Our Workforce Health and Safety
Workforce Health. We are focused on protecting our employees against COVID-19 and ensuring a healthy work environment. To respond to COVID-19, we formed a cross-functional crisis response team. Our business leaders manage items such as developing health and safety protocols, responding to health and safety issues, interpreting government orders, and securing personal protective equipment. We developed a comprehensive handbook to set and communicate work procedures and changes to production necessary to facilitate COVID-19 health and safety measures, including proper social distancing. Our business leaders have implemented training and change management initiatives to drive and maintain new ways of operating. When employees test positive for COVID-19, we follow adopted procedures including enhanced disinfecting that targets applicable areas. The affected employee is required to observe a quarantine period, monitor symptoms, and follow medical guidance prior to returning to work. Contact tracing is performed to identify employees who had direct contact with the affected employee. If direct contacts are identified, those employees must self-isolate, monitor symptoms, and follow medical guidance prior to returning to work.
Workplace Safety. We are also dedicated to the safety of our employees through prevention, education, and awareness with the objective of reducing, or even eliminating, workplace injuries through accident investigation and process safety. Our dedicated staff of professionals supports safety management at our manufacturing facilities, including implementation of a comprehensive program called “SafeGuard.” The SafeGuard program develops relevant job hazard analyses, which are
15
PART I
undertaken on many processes and used to develop comprehensive job procedures. This allows us to implement job-specific health and safety practices across our business.
Continuing Education and Training
Developing Our Talent. Although some of our established learning and development programs, as disclosed below, were less active during 2020 due to the impact of the COVID-19 pandemic, they continue to be part of our ongoing, long-term strategy, which is focused on growing talent throughout all levels of our organization, including technical/skilled positions, supervisory and management levels, and future leaders.
Frontline Supervisor Training Program. We have launched a global Frontline Supervisor Training Program designed to help managers at branch locations develop leadership skills necessary to enhance strong employee engagement. The program stresses communication, conflict resolution, respect in the workplace, and safety.
Intern Program. We have also developed an intern program that is centered on students exploring a future with us, and our attracting a deep and diverse talent pool that can grow with us from intern to entry-level hire.
Health and Safety Training. Our manufacturing employees receive new hire safety training, annual refresher safety training, weekly “tool box” talks regarding safety and training, and job-specific safety training based on the jobs hazards analysis developed from our SafeGuard program.
Succession Development
Management and Leadership Positions. Our commitment to having strong managers and leadership in critical roles across the company continues to serve us well. Our values and culture guide our talent initiatives which are designed to create a pipeline of strong, high performing leadership candidates to serve in progressively important roles throughout the Company. Our internal promotion rate over the last three years for corporate officer positions was 89%. We are building on our success in these areas and continue to push our succession development processes to new levels to allow us to adapt and grow.
Trends in Market Demand and Competition
Demand Trends for our Products. Because of the COVID-19 pandemic, various governments in Asia, Europe, North America, and elsewhere have instituted, and may reinstitute, quarantines, shelter-in-place or stay-at-home orders, or restrictions on public gatherings, as well as limitations on social interactions. The resulting economic downturn has had, and could further have, an effect on the demand for our products and our customers’ products, growth rates in the industries in which we participate, and opportunities in these industries. The impact of the COVID-19 pandemic began in January 2020, directly affecting our operations in China, as well as the global supply chain. The crisis accelerated, impacting virtually all geographies by mid-March. By mid-second quarter 2020, we began to see rapid recovery in businesses serving home-related markets. With consumers spending less on travel and entertainment, they began investing more in their homes. This benefited our Bedding, Home Furniture, Flooring, and Textiles businesses. We ended 2020 with fourth quarter sales in many of our businesses above fourth quarter 2019 levels.
Competition. Many companies offer products that compete with those we manufacture and sell. The number of competing companies varies by product family, but many of the markets for our products are highly competitive. We tend to attract and retain customers through innovation, product quality, competitive pricing, and customer service. Many of our competitors try to win business primarily on price, but, depending upon the particular product, we experience competition based on quality and performance as well. In general, our competitors tend to be smaller, private companies.
16
PART I
We believe we are the largest U.S.-based manufacturer, in terms of revenue, of the following:
| • | Bedding components | ||||
| • | Automotive seat support and lumbar systems | ||||
| • | Specialty bedding foams and private label finished mattresses | ||||
| • | Components for home furniture and work furniture | ||||
| • | Flooring underlayment | ||||
| • | Adjustable beds | ||||
| • | Bedding industry machinery | ||||
We continue to face competitive pressure as some of our customers source a portion of their components and finished products from low cost countries. In addition to lower labor rates, competitors may benefit at times from lower raw material costs. They may also benefit from currency factors and more lenient regulatory climates. We typically remain price competitive, even versus many foreign manufacturers, as a result of our efficient operations, automation, vertical integration in steel and wire, logistics and distribution efficiencies, and large scale purchasing of raw materials and commodities.
For information about antidumping duty orders regarding innerspring, steel wire rod, and mattress imports, please see "Competition" in Item 7, Management’s Discussion and Analysis of Financial Condition and Results of Operations on page 39.
Seasonality
As a diversified manufacturer, we generally have not experienced significant seasonality. However, unusual economic factors in any given year such as inflation and deflation, along with acquisitions and divestitures, can create sales variability and obscure the underlying seasonality of our businesses. Historically, our operating cash flows are stronger in the fourth quarter, primarily related to the timing of cash collections from customers and payments to vendors.
Governmental Regulations
Our operations are subject to various federal, state, local, and international laws and regulations, including environmental regulations. We have policies intended to ensure that our operations are conducted in compliance with applicable laws and regulations. While we cannot predict policy changes by various regulatory agencies or unexpected operational or other developments, management expects that compliance with these laws and regulations will not have a material adverse effect on our capital expenditures (including those capital expenditures for environmental control facilities), earnings, and competitive position.
Internet Access to Information
We routinely post information for investors under the Investor Relations section of our website (www.leggett.com). Our annual reports on Form 10-K, quarterly reports on Form 10-Q, current reports on Form 8-K, and all amendments to those reports are made available, free of charge, on our website as soon as reasonably practicable after electronically filed with, or furnished to, the SEC. In addition to these reports, the Company’s Financial Code of Ethics, Code of Business Conduct and Ethics, and Corporate Governance Guidelines, as well as charters for the Audit, Compensation, and Nominating & Corporate Governance Committees of our Board of Directors, can be found on our website under the Corporate Governance section. Information contained on our website does not constitute part of this Annual Report on Form 10-K.
17
PART I
Industry and Market Data
Unless indicated otherwise, the information concerning our industries contained in this Annual Report is based on our general knowledge of and expectations concerning the industries. Our market share is based on estimates using our internal data, data from various industry analyses, internal research, and adjustments and assumptions that we believe to be reasonable. We have not independently verified data from industry analyses and cannot guarantee their accuracy or completeness.
Item 1A. Risk Factors.
Investing in our securities involves risk. Set forth below and elsewhere in this report are risk factors that could cause actual results to differ materially from the results contemplated by the forward-looking statements contained in this report. We may amend or supplement these risk factors from time to time by other reports we file with the SEC.
OPERATIONAL RISK FACTORS
The COVID-19 pandemic has had, and could further have, an adverse impact to (i) our manufacturing operations' ability to remain open, or fully operate, (ii) our ability to obtain necessary raw materials and parts, maintain appropriate labor levels, and ship finished products to customers; and (iii) our operating costs related to pay and benefits for terminated employees; all of which, in the aggregate, have had, and could further have, a material negative impact on our trade sales, earnings, liquidity, cash flow, financial condition, and our stock price.
We have manufacturing facilities in the United States and 16 other countries. All of these countries have been affected by the COVID-19 pandemic. All of our facilities are open and running at this time. From time to time we have some capacity restrictions on our plants due to governmental orders in various parts of the world. We have been and could be further negatively affected by governmental action in any one or more of the countries in which we operate by the imposition, or re-imposition, of restrictive measures concerning shelter-in-place or stay-at-home orders, public gatherings and human interactions, mandatory closures of retail establishments that sell our products or our customers’ products, travel restrictions, and restrictions on the import or export of products.
The U.S. and other governments have ordered that certain nonwoven fabrics used to produce ComfortCore® innersprings be prioritized to produce medical supplies, resulting in shortages of fabrics used for non-medical applications. These shortages and strong bedding demand have caused the Company temporarily to be unable to supply full industry demand for ComfortCore®. We are engaging with customers in an effort to work through these issues. The shortages have resulted in higher pricing for nonwoven fabrics. If we are unable to obtain the fabrics, cannot pass the cost along to our customers, are required to modify existing contracts to accommodate customers, or pay damage claims to customers, our results of operations may be negatively impacted. As demand has improved, we also have experienced some temporary labor shortages. We are in the process of hiring additional employees and adding equipment, particularly in our U.S. Spring business, to meet this demand.
Because of the shift of production by semiconductor microchip manufacturers to consumer electronics, such as laptops and tablets for home schooling and home offices, and away from automotive applications during the COVID-19 related automotive industry shutdowns in 2020, currently there is a shortage of microchips in the automotive industry. Our Automotive Group uses the microchips in seat comfort products, and to a lesser extent in motors and actuators. Although, to date, our Automotive Group has been able to obtain an adequate supply of microchips, we are dependent on our suppliers to deliver these microchips in accordance with our production schedule, and a shortage of the microchips can disrupt our operations and our ability to deliver products to our customers. Also, because of the industry shortage, automotive OEMs and other suppliers have not been able to secure an adequate supply of microchips, and as a result have reduced their production of automobiles or parts, which in turn has recently reduced, and may continue to reduce our sale of products. If we cannot secure an adequate supply of microchips in our supply chain, and the microchips cannot be sourced from a different supplier, or the automotive OEMs and other suppliers continue to reduce their production as a result of such shortage, this may negatively impact our sales, earnings, and financial condition.
18
PART I
Depending on the length and severity of the COVID-19 pandemic, and the timing and effectiveness of any vaccines, our ability to keep our manufacturing operations open or fully operational, build and maintain appropriate labor levels, obtain necessary raw materials and parts, and ship finished products to customers may be partially or completely disrupted, either on a temporary or prolonged basis. The continued realization of these risks to our manufacturing operations, labor force, and supply chain could also increase labor, commodity, and energy costs.
Also, some facilities have experienced problems delivering products to customers because of travel restrictions and disruption in logistics necessary to import, export, or transfer products across borders. Currently, our supply chains have also been hampered by congested ports.
When our employees have tested positive for COVID-19, we follow governmental orders and internally adopted procedures which include enhanced disinfecting that targets areas that have likely exposure to COVID-19. The employee is required to observe a quarantine period, monitor symptoms, and follow medical guidance prior to returning to work. Contact tracing is performed to identify any other employees who had direct contact with the employee who tested positive for COVID-19. If any direct contacts are identified, those employees must also self-isolate, monitor symptoms, and follow medical guidance prior to returning to work. A significant increase in COVID-19 cases among our employees may disrupt our ability to maintain necessary labor levels and produce and deliver products to our customers if we are unable to shift production to other manufacturing facilities.
In connection with reduced demand for our products in certain business units, we decreased the size of our workforce worldwide. We incurred severance costs of $7 million in 2020 and we do not expect any additional material charges. However, if circumstances change because of lack of demand, additional governmental capacity restrictions related to our facilities or otherwise, we may incur future material separation costs.
Business disruptions to our steel rod mill, if coupled with an inability to purchase an adequate and/or timely supply of quality steel rod from alternative sources, could have a material negative impact on our Bedding Products segment and Company results of operations.
We purchase steel scrap from third party suppliers. This scrap is converted into steel rod in our mill in Sterling, Illinois. Our steel rod mill has historically had annual output of approximately 500,000 tons, a substantial majority of which has been used internally by our wire mills, which convert the steel rod into drawn steel wire. This wire is used in the production of many of our products, including mattress innersprings.
A disruption to the operation of, or supply of steel scrap to, our steel rod mill could require us to purchase steel rod from alternative supply sources, subject to market availability. Ongoing trade action by the United States government, along with the existence of antidumping and countervailing duty orders against multiple countries, could result in reduced market availability and/or higher cost of steel rod.
If we experience a disruption to our ability to produce steel rod in our mill, coupled with a reduction of adequate and/or timely supply from alternative market sources of quality steel rod, we could experience a material negative impact on our Bedding Products segment and the Company's results of operations.
FINANCIAL RISK FACTORS
The COVID-19 pandemic has had, and could further have, an adverse impact on the collection of trade and other notes receivables in accordance with their terms due to customer bankruptcy, financial difficulties, or insolvency.
Bankruptcy, financial difficulties, or insolvency caused by the COVID-19 pandemic, or otherwise, can and has occurred with some of our customers which can impact their ability to pay their debts to us. As of December 31, 2020, we had a $25 million allowance for doubtful accounts ($23 million on a note receivable and $2 million on trade accounts receivable) associated with a customer in our Bedding Products segment who is experiencing financial difficulty and liquidity problems. This customer was placed on nonaccrual status in 2018 and became delinquent in quarterly interest payments in the first quarter of 2020.
In addition to the customer referenced above, many of our customers and other third parties have been adversely affected by the social and governmental restrictions and limitations related to the COVID-19 pandemic. As such, we
19
PART I
increased our allowance for doubtful accounts by $20 million in the first quarter of 2020, including $9 million for the customer referenced above. We had modest activity for the remainder of 2020, and our bad debt expense for the year ended December 31, 2020 was $17 million. If these parties suffer significant financial difficulty, they may be unable to pay their debts to us, they may reject their contractual obligations to us under bankruptcy laws or otherwise, or we may have to negotiate significant discounts and/or extend financing terms with these parties. If we are unable to collect trade receivables and other notes receivables on a timely basis, this inability will require additional provisions for bad debt and result in a negative impact on our earnings, liquidity, cash flow and financial condition.
Our goodwill and other long-lived assets are subject to potential impairment which could negatively impact our earnings.
A significant portion of our assets consists of goodwill and other long-lived assets, the carrying value of which may be reduced if we determine that those assets are impaired. At December 31, 2020, goodwill and other intangible assets represented $2.1 billion, or 44% of our total assets. In addition, net property, plant, and equipment, operating lease right-of-use assets, and sundry assets totaled $1.1 billion, or 22% of total assets.
We review our reporting units for potential goodwill impairment in the second quarter as part of our annual goodwill impairment testing, and more often if an event or circumstance occurs making it likely that impairment exists. In addition, we test for the recoverability of long-lived assets at year end, and more often if an event or circumstance indicates the carrying value may not be recoverable. We conduct impairment testing based on our current business strategy in light of present industry and economic conditions, as well as future expectations.
The 2020 goodwill impairment testing resulted in a $25 million non-cash goodwill impairment charge in the second quarter of 2020 with respect to our Hydraulic Cylinders reporting unit, which is a part of the Specialized Products segment. Demand for hydraulic cylinders is dependent upon capital spending for material handling equipment.
The impairment charge reflects the complete write-off of the goodwill associated with the Hydraulic Cylinders reporting unit and will not result in future cash expenditures. Although we do not believe that a triggering event related to the impairment of goodwill or other long-lived assets occurred in the first quarter of 2020, the anticipated longer-term economic impacts of COVID-19 lowered expectations of future revenue and profitability causing its fair value to fall below its carrying value. We concluded on July 30, 2020, as part of our normal second quarter 2020 annual goodwill impairment testing and in connection with the preparation and review of the second quarter 2020 financial statements, that an impairment charge was required with respect to this reporting unit. We also evaluated other long-lived assets associated with this unit for impairment; no impairments were indicated other than goodwill.
Of the remaining six reporting units, three had fair values in excess of carrying value of less than 100%.
• Fair value for our Bedding reporting unit exceeded carrying value by 68%. Our 2019 acquisition of ECS is part of our Bedding reporting unit, and goodwill for our Bedding reporting unit was $857 million at December 31, 2020.
• Fair value for our Aerospace reporting unit exceeded carrying value by 51%. Goodwill for the Aerospace reporting unit was $59 million at December 31, 2020.
• Fair value for our Work Furniture reporting unit exceeded carrying value by 25%. Goodwill for the Work Furniture reporting unit was $97 million at December 31, 2020.
If there is a prolonged adverse economic impact from the COVID-19 pandemic, or otherwise, we may not be able to achieve projected performance levels. Although we do not believe that a triggering event has occurred, internal forecasts and industry data suggest that economic impacts of COVID-19 for the aerospace industry may be longer than previously expected during the second quarter impairment testing. We are continuing to monitor all factors impacting this industry. If actual results materially differ from the assumptions and estimates used in the goodwill and long-lived asset valuation calculations, we could incur future impairment charges. These non-cash charges could have a material negative impact on our earnings.
For more information regarding potential goodwill and other long-lived asset impairment, please refer to Note C on page 90 of the Notes to Consolidated Financial Statements.
20
PART I
The COVID-19 pandemic could have an adverse impact to our ability to access the commercial paper market, and has had, and could further have, an adverse impact on our ability to borrow under our credit facility, including our ability to comply with the restrictive covenants in our credit facility.
The COVID-19 pandemic could have an adverse impact on our liquidity. Our inability to issue commercial paper in appropriate amounts and tenor, for cash management purposes, could cause us to borrow under our revolving credit facility which serves as support for our commercial paper program. If this were to happen, we would incur higher interest costs.
The credit facility is a multi-currency facility maturing in January 2024, providing us the ability, from time to time subject to certain restrictive covenants and customary conditions, to borrow, repay, and re-borrow up to $1.2 billion. The credit facility also provided for a one-time draw of up to $500 million under a five-year term loan facility, which we fully borrowed in January 2019 to consummate the ECS acquisition.
Because of the economic impacts of the COVID-19 pandemic on our business, effective May 6, 2020, we amended the credit facility to, among other things, change the restrictive borrowing covenants. The prior leverage ratio covenant required us to maintain, as of the last day of each quarter, a leverage ratio of consolidated funded indebtedness to trailing 12-month consolidated EBITDA (each as defined in the credit facility) of not greater than 3.50 to 1.00. The leverage ratio covenant was changed in two ways: (i) the calculation of the ratio now subtracts unrestricted cash (as defined in the credit facility) from consolidated funded indebtedness; and (ii) the ratio levels, calculated as of the last day of the applicable fiscal quarter, were changed to 4.75 to 1.00 for each fiscal quarter end date through March 31, 2021; 4.25 to 1.00 at June 30, 2021; 3.75 to 1.00 at September 30, 2021; and 3.25 to 1.00 at December 31, 2021 and thereafter. In addition, the amount of total secured debt limit was changed from 15% to 5% of our total consolidated assets until December 31, 2021, at which time it will revert back to 15%. Various interest rate terms were also changed. The impact on our interest expense will depend upon our ability to access the commercial paper market, and if so, the degree of that access. The credit facility also contains an anti-cash hoarding provision that limits borrowing if the Company has a consolidated cash balance (as defined in the credit facility) in excess of $300 million without planned expenditures.
If our earnings are reduced because of the COVID-19 pandemic or otherwise, the covenants in the credit facility will reduce our borrowing capacity, both under the credit facility or through commercial paper issuances. Depending on the degree of earnings reduction, our liquidity could be materially negatively impacted. This covenant may also restrict our current and future operations, including (i) our flexibility to plan for, or react to, changes in our businesses and industries; and (ii) our ability to use our cash flows, or obtain additional financing, for future working capital, capital expenditures, acquisitions, or other general corporate purposes.
Also, if we fail to comply with the covenants specified in the credit facility, we may trigger an event of default, in which case the lenders would have the right to: (i) terminate their commitment to provide additional loans under the credit facility; and (ii) declare all borrowings outstanding, together with accrued and unpaid interest and fees, to be immediately due and payable. Additionally, our senior notes contain cross-default provisions which could make outstanding amounts under the senior notes immediately payable in the event of an acceleration of amounts due under the credit facility following a material uncured default. If debt under the credit facility or senior notes were to be accelerated, we may not have sufficient cash to repay this debt, which would have an immediate material adverse effect on our business, results of operations, and financial condition.
We may not be able to realize deferred tax assets on our balance sheet depending upon the amount and source of future taxable income.
Our ability to realize deferred tax assets on our balance sheet is dependent upon the amount and source of future taxable income. As of December 31, 2020, we had $134 million of deferred tax assets ($152 million less an $18 million valuation allowance). After netting of deferred tax liabilities, the net amount presented within Sundry assets on our Consolidated Balance Sheets is $11 million. It is possible the amount and source of our taxable income could materially change in the future. Particularly, our mix of earnings by taxing jurisdiction may materially change in that we may have more or less taxable income generated in North America, Europe, or Asia as compared to prior years. This change may impact our underlying assumptions on which valuation allowances are established and negatively affect future period earnings and balance sheets. As a result, we may not be able to realize deferred tax assets on our balance sheet.
21
PART I
MARKET RISK FACTORS
Costs of raw materials could negatively affect our profit margins and earnings.
Raw material cost increases (and our ability to respond to cost increases through selling price increases) can significantly impact our earnings. We typically have short-term commitments from our suppliers; accordingly, our raw material costs generally move with the market. When we experience significant increases in raw material costs, we typically implement price increases to recover the higher costs. Inability to recover cost increases (or a delay in the recovery time) can negatively impact our earnings. Conversely, if raw material costs decrease, we generally pass through reduced selling prices to our customers. Reduced selling prices combined with higher cost inventory can reduce our profit margins and earnings.
Steel is our principal raw material. The global steel markets are cyclical in nature and have been volatile in recent years. This volatility can result in large swings in pricing and margins from year to year.
As a producer of steel rod, we are also impacted by volatility in metal margins (the difference between the cost of steel scrap and the market price for steel rod). If market conditions cause scrap costs and rod pricing to change at different rates (both in terms of timing and amount), metal margins could be compressed, and this would negatively impact our results of operations.
With the acquisition of ECS, we now have greater exposure to the cost of chemicals, including TDI, MDI, and polyol. We have experienced a shortage of chemicals, and these shortages have resulted in higher pricing. Chemical shortages are expected to continue at least through mid-2021. If we are unable to obtain an adequate supply of chemicals, or cannot purchase them at economically feasible prices and pass the additional cost along to our customers, either the shortages or increased costs may negatively impact our results of operations.
Higher raw material costs could lead some of our customers to modify their product designs, changing the quantity and mix of our components in their finished goods and replacing higher-cost components with lower-cost components. If this were to occur, it could negatively impact our results of operations.
Unfair competition could adversely affect our market share, sales, profit margins, and earnings.
We produce innersprings for mattresses that are sold to bedding manufacturers. We produce steel wire rod for consumption by our wire mills (primarily to produce innersprings) and to sell to third parties. We also produce and sell finished mattresses.
Since 2009, there have been antidumping duties on the import of innersprings from China, South Africa, and Vietnam imposed by the Department of Commerce (DOC) and International Trade Commission (ITC) extending through 2024. The DOC and ITC have also imposed antidumping duties and countervailing duties on imports of steel wire rod from various countries, including China. These duties will expire, unless extended, at different times ranging from 2022 to 2025. Also, antidumping duties have been imposed by the DOC and ITC on the import of finished mattresses from China through 2024, and additional preliminary antidumping duties are in place on import of finished mattresses from Cambodia, Indonesia, Malaysia, Serbia, Thailand, Turkey, and Vietnam, and preliminary countervailing duties on China. If the existing antidumping and countervailing duties are not finalized or extended beyond their current terms and dumping and/or subsidization recurs, or manufacturers in the subject countries circumvent the existing duties through transshipment in other jurisdictions or otherwise, our market share, sales, profit margins, and earnings could be adversely affected.
Our borrowing costs and access to liquidity may be impacted by our credit ratings.
Independent rating agencies evaluate our credit profile on an ongoing basis and have assigned ratings for our long-term and short-term debt. In April 2020, one of three rating agencies, which had our long-term debt rating on negative outlook, lowered that rating by one notch, but changed the outlook to stable. In May 2020, a second rating agency lowered our long-term and short-term ratings by one notch with a stable outlook. In August 2020, we obtained ratings on our long-term and short-term debt from a third rating agency. If we are not able to access the commercial paper market, either partially or completely, we expect to borrow under our credit facility for our liquidity needs but at higher interest costs. Because of the economic impact of the COVID-19 pandemic, our credit ratings could decline further. If this were to occur,
22
PART I
our borrowing costs could increase materially, and our access to sources of liquidity, including the commercial paper market, may be adversely affected.
We are exposed to foreign currency exchange rate risk which may negatively impact our competitiveness, profit margins, and earnings.
International sales have represented a significant percentage of our total sales, which exposes us to currency exchange rate fluctuations. In 2020, 34% of our sales were generated by international operations, primarily in Europe, China, Canada, and Mexico. We expect that a significant amount of our sales will continue to come from outside the United States in the future. Nearly 50 of our manufacturing facilities are located outside the United States. We are also exposed to currency exchange rate fluctuations by our purchase of raw materials and component parts from suppliers in multiple countries. We experience currency-related gains and losses where sales or purchases are denominated in currencies other than the functional currency. As of December 31, 2020, we had foreign exchange rate risk associated with the U.S. Dollar, Mexican Peso, Danish Krone, Euro, South African Rand, Canadian Dollar, Swiss Franc, Chinese Yuan, British Pound Sterling, and the Polish Zloty. If these exchange rates devalue the currency we receive for the sale of our products, or the currency we use to purchase raw materials or component parts from our suppliers, it may have a material adverse effect on our competitiveness, profit margins, and earnings.
For more information regarding currency exchange rate risk, please refer to Note S on page 127 of the Notes to Consolidated Financial Statements.
The COVID-19 pandemic has had, and could further have, an adverse impact to the market demand for our products and our customers’ products, growth rates in the industries in which we participate, and opportunities in those industries.
Because of the COVID-19 pandemic various governments, primarily impacting us in Asia, Europe and North America, and elsewhere have instituted, and may reinstitute quarantines, shelter-in-place or stay-at-home orders, or restrictions on public gatherings as well as limitations on social interactions. These restrictions and limitations have had, and could further have, an adverse effect on the economies and financial markets of the countries where our products, or our customers’ products, are sold. The resulting economic downturn has had, and could further have, an effect on the market demand for our products and our customers’ products, growth rates in the industries in which we participate, and opportunities in those industries. As a result of the decreased market demand, our trade sales, earnings, liquidity, cash flow, and financial condition have been and could be further materially negatively affected.
TECHNOLOGY AND CYBERSECURITY RISK FACTORS
Technology failures or cybersecurity breaches could have a material adverse effect on our operations.
As a manufacturer with 132 production facilities in 17 different countries, primarily in Asia, Europe, North America, and elsewhere, we rely on several on-premise and cloud-based computerized systems and networks to obtain, secure, process, analyze, and manage data, as well as to facilitate the manufacture and distribution of inventory to and from our production facilities. We receive, process, manufacture, and ship orders, manage the billing of and collections from our customers, and manage the accounting for and payment to our vendors. We also have risk associated with the network connectivity and systems for consolidated reporting. Technology failures or security breaches of a new or existing infrastructure could impede normal operations, create system disruptions, or create unauthorized disclosure of confidential information.
We have a formal process in place for both incident response and cybersecurity continuous improvement that includes a cross functional Cybersecurity Oversight Committee. Members of the Cybersecurity Oversight Committee update the Board of Directors quarterly on cyber activity, with procedures in place for interim reporting if necessary.
Although we have not experienced any material technology failures or cybersecurity breaches, we have enhanced our cybersecurity protection efforts over the last few years. We use a third party to periodically benchmark our information security program against the National Institute of Standards and Technology’s Cybersecurity Framework. We provide quarterly cybersecurity training for employees with access to our email and data systems, and we have purchased broad
23
PART I
form cyber insurance coverage. However, because of the risk due to the COVID-19 pandemic regarding increased remote access, remote work conditions, and associated strain on employees, technology failures or cybersecurity breaches could still create system disruptions or unauthorized disclosure of confidential information. We cannot be certain that the attacker’s capabilities will not compromise our technology protecting information systems. We could still experience material technology failures or cybersecurity breaches. If this occurs, our operations could be disrupted, or we may suffer financial loss because of lost or misappropriated information. Also, we may incur remediation costs, increased cybersecurity protection costs, lost revenues resulting from unauthorized use of proprietary information, litigation and legal costs, reputational damages, proprietary and confidentiality impacts, damage to our competitiveness, and negative impact on our stock price and long-term shareholder value. We cannot be certain that advances in criminal capabilities will not compromise our technology protecting information systems. If these systems are interrupted or damaged by these events or fail for any extended period of time, then our results of operations could be adversely affected.
TRADE RISK FACTORS
Tariffs by the United States government could result in materially lower margins, lost sales, and an overall adverse effect on our results of operations.
While we frequently manufacture products where our customers are located, we do, in some cases, import and export various raw materials, components, or finished goods across several business units, including the Automotive and Bedding groups and the Machinery business. The United States has imposed broad-ranging tariffs on steel and aluminum (each of which we use in our manufacturing processes), a wide assortment of Chinese-made products, and other products on a country-specific basis. In retaliation, many other countries have imposed counter-tariffs on US-produced items. If we are unable to pass through additional costs created by these tariffs, it could result in materially lower margins, lost sales, and an overall adverse effect on our results of operations.
The United Kingdom's withdrawal from the European Union could adversely affect us.
In June 2016, the United Kingdom (UK) held a referendum in which voters approved an exit from the European Union (EU), commonly referred to as “Brexit.” In January 2020, the Withdrawal Agreement Act was passed by the UK Parliament and the Brexit deal was ratified by the EU Parliament. This allowed the UK to formally leave the EU on January 31, 2020, with a transition period through December 31, 2020, while the EU and UK were to negotiate a trade agreement, among other things. Additional negotiations among the EU and UK continue, as well as negotiations of trade agreements between the UK and other countries, including the United States. Because we have multiple manufacturing facilities in the United Kingdom, EU, and other countries, and these facilities purchase raw materials and component parts from suppliers in those countries, and sell products into the United Kingdom, EU, and elsewhere, the results of Brexit could cause disruptions and create uncertainty to our supply chain and distribution networks, tariff rates, and currencies, and could fluctuate the value of the British Pound and the Euro relative to the U.S. Dollar and other currencies. These disruptions and uncertainties could increase our costs and adversely affect us.
REGULATORY RISK FACTORS
Privacy and data protection regulations are complex and could harm our business, reputation, financial condition, and operating results.
Governments around the world have adopted legislative and regulatory proposals concerning the collection and use of personal data of consumers, employees, and business contacts. As a company with primarily employee and business contact personal data, we are subject to many different data protection laws, including some U.S. states such as California and countries in Europe, China, and Brazil. For example, the EU General Data Protection Regulation (GDPR) applies to our operations that collect or process personal information of EU individuals, such as personal information concerning our employees at our facilities in Croatia and Poland. If our EU operations are found to violate GDPR requirements, we may incur substantial fines, need to change our business practices, and face reputational harm, any of which could have an adverse effect on our business. As a U.S. company, the ability to centrally manage aspects of our operation and workforce, and to make decisions based on complete and accurate global data, is important and requires the ability to transfer and access data. In order to enable the transfer of personal data from the EU to the U.S., we have self-certified to the U.S.
24
PART I
Department of Commerce and committed to comply with specified requirements under the EU-U.S. Privacy Shield framework.
In July 2020, the Court of Justice of the European Union ruled that the EU-U.S. Privacy Shield is an invalid transfer mechanism, but upheld Standard Contractual Clauses, which we also use, as a valid transfer mechanism under appropriate circumstances. The validity of data transfer mechanisms remains subject to legal, regulatory, and political developments in both Europe and the U.S. The invalidation of the EU-U.S. Privacy Shield and potential invalidation of other data transfer mechanisms could have an adverse impact on our ability to process and transfer personal data outside of the EU. This may inhibit our ability to transfer our employee data from our European operations to the Company’s headquarters in the U.S., or elsewhere, making it much more difficult to effectively manage our global human capital. These evolving privacy and data protection requirements create uncertainty and added compliance obligations that could harm our business, reputation, financial condition, and operating results.
Climate change laws and related regulations could negatively impact our business, capital expenditures, results of operations, financial condition, and competitive position.
We have 132 production facilities world-wide. Some of our facilities are engaged in manufacturing processes that produce greenhouse gas emissions, including carbon dioxide. We also maintain a fleet of over-the-road tractor trailers that emit greenhouse gases. Climate change has received increased attention worldwide. Many scientists, legislators, and others attribute global warming to increased levels of greenhouse gas emissions, including carbon dioxide, which has led to significant legislative and regulatory efforts to limit such emissions. Although we have adopted an environmental sustainability program that encourages employees to carry out efforts, in part, to reduce greenhouse gas emissions, either the enactment of, or change to existing laws and regulations, could mandate more restrictive standards or require such changes on a more accelerated time frame. Our manufacturing facilities are primarily located in North America, Europe and Asia. There continues to be a lack of consistent climate legislation in the jurisdictions where we operate, which creates economic and regulatory uncertainty. To the extent our customers are subject to any of these or other similar proposed or newly enacted laws and regulations, additional costs by customers to comply with such laws and regulations could impact their ability to operate at similar levels in certain jurisdictions, which could adversely impact their demand for our products and services. Also, if these laws or regulations impose significant operational restrictions and compliance requirements on us, they could increase costs associated with our operations, including costs for raw materials and transportation. In either event, they could negatively impact our business, capital expenditures, results of operations, financial condition, and competitive position.
Increased scrutiny from investors, lenders, and other market participants regarding our environmental, social and governance, or sustainability, responsibilities could expose us to additional costs or risks and adversely impact our liquidity, results of operations, reputation, employee retention, and stock price.
Investor advocacy groups, certain institutional investors, investment funds, lenders and other market participants, shareholders, and customers have focused increasingly on the environmental, social and governance (ESG) or “sustainability” practices of companies. These parties have placed increased importance on the implications of the social cost of their investments. If our ESG practices do not meet investor, lender, or other industry stakeholder expectations and standards, which continue to evolve, our access to capital may be negatively impacted based on an assessment of our ESG practices. These limitations, in both the debt and equity markets, may materially negatively affect our ability to manage our liquidity, our ability to refinance existing debt, grow our businesses, implement our strategies, our results of operations, and the price of our common stock.
We are currently preparing and expect to publish our first sustainability report in 2021, which will detail how we seek to manage our operations responsibly and ethically. The sustainability report is expected to include our policies and practices on a variety of social and ethical matters, including, but not limited to, corporate governance, environmental compliance, employee health and safety practices, human capital management, product quality, supply chain management, and workforce inclusion and diversity. It is possible that stakeholders may not be satisfied with our ESG practices or the speed of their adoption. We could also incur additional costs and require additional resources to monitor, report, and comply with various ESG practices. Also, our failure, or perceived failure, to meet the standards set forth in the sustainability report could negatively impact our reputation, employee retention, and the willingness of our customers and suppliers to do business with us.
25
PART I
Changes in tax laws or challenges to our tax positions pursuant to ongoing tax audits could negatively impact our earnings and cash flows.
We are subject to the tax laws and reporting rules of the U.S. (federal, state, and local) and several foreign jurisdictions. Current economic and political conditions make these tax rules (and governmental interpretation of these rules) in any jurisdiction, including the U.S., subject to significant change and uncertainty. There have been proposals, most notably by the Organization for Economic Cooperation and Development, to reform tax laws or change interpretations of existing tax rules. These proposals, if adopted, could significantly impact how our earnings and transactions are taxed as a multinational corporation. Although we cannot predict whether or in what form these proposals will become law, or how they might be interpreted, such changes could impact our assumptions related to the taxation of certain foreign earnings and have a material adverse effect on our earnings and cash flows.
We are currently in various stages of audit by the U.S. and foreign governmental taxing authorities. We have established liabilities as we believe are appropriate, with such amounts representing what we believe is a reasonable provision for taxes that we ultimately might be required to pay. However, these liabilities could be increased over time as more information becomes known relative to the resolution of these audits, as either certain governmental tax positions may be sustained on audit or we may agree to certain tax adjustments. We could incur additional tax expense if we have adjustments higher than the liabilities recorded.
LITIGATION RISK FACTORS
We are exposed to litigation contingencies that, if realized, could have a material negative impact on our financial condition, results of operations, and cash flows.
Although we deny liability in all currently threatened or pending litigation proceedings and believe that we have valid bases to contest all claims made against us, we have recorded an immaterial aggregate litigation contingency accrual at December 31, 2020. Based on current facts and circumstances, aggregate reasonably possible (but not probable) losses in excess of the recorded accruals for litigation contingencies (which include Brazilian value-added tax and other matters) are estimated to be $12 million. If our assumptions or analyses regarding any of our contingencies are incorrect, or if facts and circumstances change, we could realize loss in excess of the recorded accruals (and in excess of the $12 million referenced above) which could have a material negative impact on our financial condition, results of operations, and cash flows. For more information regarding our legal contingencies, please see Note T on page 130 of the Notes to Consolidated Financial Statements.
Item 1B. Unresolved Staff Comments.
None.
Item 2. Properties.
The Company’s corporate office is located in Carthage, Missouri. As of December 31, 2020, we had 132 manufacturing locations, of which 84 were located across the United States and 48 were located in 16 foreign countries. We also had various sales, warehouse, and administrative facilities. However, our manufacturing plants are our most important properties.
26
PART I
Manufacturing Locations by Segment
Company- Wide | Subtotals by Segment | |||||||||||||||||||||||||
Manufacturing Locations | Bedding Products | Specialized Products | Furniture, Flooring & Textile Products | |||||||||||||||||||||||
| United States | 84 | 36 | 6 | 42 | ||||||||||||||||||||||
| China | 14 | 2 | 10 | 2 | ||||||||||||||||||||||
| Europe | 14 | 5 | 8 | 1 | ||||||||||||||||||||||
| Canada | 8 | — | 3 | 5 | ||||||||||||||||||||||
| Mexico | 7 | 4 | 2 | 1 | ||||||||||||||||||||||
| Other | 5 | 2 | 3 | — | ||||||||||||||||||||||
| Total | 132 | 49 | 32 | 51 | ||||||||||||||||||||||
For more information regarding the geographic location of our manufacturing facilities refer to “Geographic Areas of Operation” under Item 1 Business on page 11.
Manufacturing Locations Owned or Leased by Segment
Company- Wide | Subtotals by Segment | |||||||||||||||||||||||||
Manufacturing Locations | Bedding Products | Specialized Products | Furniture, Flooring & Textile Products | |||||||||||||||||||||||
| Owned | 70 | 34 | 13 | 23 | ||||||||||||||||||||||
| Leased | 62 | 15 | 19 | 28 | ||||||||||||||||||||||
| Total | 132 | 49 | 32 | 51 | ||||||||||||||||||||||
Upon the acquisition of ECS in January 2019, we added 13 manufacturing facilities located across the United States, of which six are owned. All of these facilities are held within Bedding Products and are included in the above totals.
We lease many of our manufacturing, warehouses, and other facilities on terms that vary by lease (including purchase options, renewals, and maintenance costs). For additional information regarding lease obligations, see Note K on page 105 of the Notes to Consolidated Financial Statements. Of our 132 manufacturing facilities, none are subject to liens or encumbrances that are material to the segment in which they are reported or to the Company as a whole.
None of our physical properties are, by themselves, material to the Company’s overall manufacturing processes, except for our steel rod mill in Sterling, Illinois, which is reported in Bedding Products. The rod mill consists of approximately 1 million square feet of production space, which we own. It has annual capacity and output of approximately 500,000 tons of steel rod, of which a substantial majority is used by our own wire mills. Our wire mills convert the steel rod into drawn steel wire. This wire is used in the production of many of our products, including mattress innersprings. A disruption to the operation of, or supply of steel scrap to, our steel rod mill could require us to purchase steel rod from alternative supply sources, subject to market availability. Trade actions by the United States government, along with the existence of antidumping and countervailing duty orders against multiple countries, could result in reduced market availability and/or an increase in the cost of steel rod. If we experience a disruption in our ability to produce steel rod in our mill, coupled with a reduction of adequate and/or timely supply from alternative market sources of quality steel rod, we could experience a material negative impact on our Bedding Products segment's and the Company's results of operations.
In the opinion of management, the Company’s owned and leased facilities are suitable and adequate for the manufacture, assembly and distribution of our products. Our properties are located to allow timely and efficient delivery of
27
PART I
products and services to our diverse customer base. Although our manufacturing facilities are generally operated at relatively high utilization rates, we do have excess production capacity in certain businesses.
Although the potential sale is subject to significant conditions that may change the timing, the amount, and whether the sale is completed at all, we have agreed to sell certain real estate associated with prior years' restructuring activities in the Bedding Products segment. If the sale is completed, we expect to realize a gain of up to $25 to $30 million on this transaction in 2021.
Item 3. Legal Proceedings.
Reference is made to the information in Note T beginning on page 130 of the Notes to Consolidated Financial Statements, which is incorporated into this section by reference.
Mattress Antidumping Matters
On March 31, 2020, the Company, along with six other domestic mattress producers, Brooklyn Bedding, Corsicana Mattress Company, Elite Comfort Solutions (a Leggett subsidiary), FXI, Inc., Innocor, Inc., and Kolcraft Enterprises, Inc., and two unions, the International Brotherhood of Teamsters and United Steel, Paper and Forestry, Rubber, Manufacturing, Energy, Allied Industrial and Service Workers International Union, AFL-CIO, filed petitions with the U.S. Department of Commerce (DOC) and the U.S. International Trade Commission (ITC) alleging that manufacturers of mattresses in Cambodia, Indonesia, Malaysia, Serbia, Thailand, Turkey, and Vietnam were unfairly selling their products in the United States at less than fair value (dumping) and manufacturers of mattresses in China were unfairly benefiting from subsidies, causing harm to the U.S. industry and seeking the imposition of duties on mattresses imported from these countries. On May 14, 2020, the ITC made a unanimous, affirmative preliminary determination of a reasonable likelihood of injury. On August 28, 2020, DOC made a preliminary determination on Chinese subsidies, assigning a duty rate of 97.78%. On October 28, 2020, DOC made a preliminary determination on dumping, assigning duty rates on imports from Cambodia (252.74%), Indonesia (2.61%), Malaysia (42.92%), Serbia (13.65%), Thailand (572.56-763.28%), Turkey (20.03%), and Vietnam (190.79-989.9%). Final determinations are expected in the first half of 2021, and, if affirmative, antidumping and countervailing duty orders would remain in effect for a five-year period.
Environmental Matters Involving Potential Monetary Sanctions of $300,000 or More
On February 16, 2021, a summons was issued to the Company’s French subsidiary, Specitubes SAS, to appear before the Judicial Court of Boulogne-Sur-Mer, France. The prosecutor has alleged (i) that Specitubes violated certain French environmental air emission standards, and an administrative order concerning those standards, by its use of a chlorinated lubricant, and (ii) that Specitubes, because of its use of the chlorinated lubricant, created a human health hazard. The allegations carry a possible fine of up to approximately $.6 million USD. Specitubes intends to defend this matter and will challenge the allegation. Although the outcome of this matter cannot be predicted with certainty, we do not expect it to have a material adverse effect on our financial position, cash flows or results of operations.
Item 4. Mine Safety Disclosures.
Not applicable.
28
PART I
Supplemental Item. Information About Our Executive Officers.
The following information is included in accordance with the provisions of Part III, Item 10 of Form 10-K, Item 401(b) of Regulation S-K, and the Instruction to Item 401 of Regulation S-K.
The table below sets forth the names, ages and positions of all executive officers of the Company. Executive officers are normally appointed annually by the Board of Directors.
| Name | Age | Position | ||||||||||||
| Karl G. Glassman | 62 | Chairman and Chief Executive Officer | ||||||||||||
| J. Mitchell Dolloff | 55 | President and Chief Operating Officer, President—Bedding Products | ||||||||||||
| Jeffrey L. Tate | 51 | Executive Vice President and Chief Financial Officer | ||||||||||||
| Steven K. Henderson | 60 | Executive Vice President, President—Specialized Products and Furniture, Flooring & Textile Products | ||||||||||||
| Scott S. Douglas | 61 | Senior Vice President, General Counsel & Secretary | ||||||||||||
| Susan R. McCoy | 56 | Senior Vice President, Investor Relations | ||||||||||||
| Tammy M. Trent | 54 | Senior Vice President, Chief Accounting Officer | ||||||||||||
Subject to the severance benefit agreements with Mr. Glassman, Mr. Dolloff, Mr. Tate, Mr. Henderson, and Mr. Douglas listed as exhibits to this Report, the executive officers generally serve at the pleasure of the Board of Directors. Please see Exhibit Index on page 135 for reference to the agreements.
Karl G. Glassman was appointed Chairman of the Board effective January 1, 2020 and continues to serve as Chief Executive Officer since his appointment in 2016. He previously served as President from 2013 to 2019, Chief Operating Officer from 2006 to 2015, Executive Vice President from 2002 to 2013, President of the former Residential Furnishings segment from 1999 to 2006, Senior Vice President from 1999 to 2002, and in various capacities since 1982.
J. Mitchell Dolloff was appointed the Company’s President and Chief Operating Officer, President—Bedding Products effective January 1, 2020. He previously served as Executive Vice President—Chief Operating Officer in 2019, President—Specialized Products and Furniture Products from 2017 to 2019, Senior Vice President and President of Specialized Products from 2016 to 2017, Vice President and President of the Automotive Group from 2014 to 2015, President of Automotive Asia from 2011 to 2013, Vice President of Specialized Products from 2009 to 2013, and in various other capacities for the Company since 2000.
Jeffrey L. Tate was appointed Executive Vice President and Chief Financial Officer of the Company effective September 3, 2019. He previously served as Vice President and Business CFO of the Packaging & Specialty Plastics Operating Segment of The Dow Chemical Company since 2017. He served The Dow Chemical Company as Chief Audit Executive from 2012 to 2017, as Division CFO of Performance Products from 2009 to 2012, and Director, Investor Relations from 2006 to 2009. Mr. Tate served Dow Automotive as Global Finance Director from 2003 to 2006, and he served The Dow Chemical Company as Global Finance Manager, Polyurethane Systems from 2000 to 2003 and in various controller and financial analyst positions from 1992 to 2000.
Steven K. Henderson was appointed Executive Vice President, President—Specialized Products and Furniture, Flooring & Textile Products, effective January 1, 2020. Mr. Henderson previously served the Company as Vice President, President—Automotive Group since 2017. He joined the Company after more than 30 years of experience in a variety of leadership positions at Dow Automotive Systems and served as Business President—Automotive Systems since 2009, where he was responsible for the global business, including profit and loss, business strategy, and organizational health.
Scott S. Douglas was appointed Senior Vice President and General Counsel in 2011. He was appointed Secretary of the Company in 2016. He previously served as Vice President and General Counsel from 2010 to 2011, as Vice President—Law and Deputy General Counsel from 2008 to 2010, as Associate General Counsel—Mergers & Acquisitions from 2001 to 2007, and as Assistant General Counsel from 1991 to 2001. He has served the Company in various legal capacities since 1987.
29
PART I
Susan R. McCoy was appointed Senior Vice President, Investor Relations in 2019. She previously served as Vice President, Investor Relations from 2014 to 2019, Staff Vice President, Investor Relations from 2011 to 2014, and Director of Investor Relations from 2002 to 2011. She also served as Due Diligence Manager from 1999 to 2002, Manager of Financial Reporting in 1999 and in various financial capacities since 1986.
Tammy M. Trent was appointed Senior Vice President in 2017 and has served as Chief Accounting Officer since 2015. She previously served as Vice President from 2015 to 2017, and Staff Vice President, Financial Reporting from 2007 to 2015. She has served the Company in various financial capacities since 1998.
30
PART II
PART II
Item 5. Market for Registrant’s Common Equity, Related Stockholder Matters and Issuer Purchases of Equity Securities.
Market Information
Our common stock is traded on the New York Stock Exchange (symbol LEG).
Shareholders and Dividends
As of February 16, 2021, we had 7,949 shareholders of record.
Increasing the dividend and maintaining our position as a Dividend Aristocrat remains a high priority. In 2020, we increased the annual dividend by $.02 from $1.58 to $1.60 per share. For over 30 years, we have generated operating cash in excess of our annual requirement for capital expenditures and dividends. We expect this again to be the case in 2021. We have no restrictions that materially limit our ability to pay such dividends or that we reasonably believe are likely to limit the future payment of dividends. Future dividends will be determined based on our earnings, capital requirements, financial condition, and other factors considered by our Board of Directors. However, our current expectation is to continue paying cash dividends on our common stock at the same or higher rate.
For more information on dividends see "Pay Dividends" in Item 7, Management’s Discussion and Analysis of Financial Condition and Results of Operations on page 53.
Issuer Purchases of Equity Securities
The table below is a listing of purchases of the Company’s common stock by us or any affiliated purchaser during each calendar month of the fourth quarter of 2020.
| Period | Total Number of Shares Purchased 1 | Average Price Paid per Share | Total Number of Shares Purchased as Part of Publicly Announced Plans or Programs 2 | Maximum Number of Shares that May Yet Be Purchased Under the Plans or Programs 2 | ||||||||||||||||||||||
| October 2020 | 5,882 | $ | 44.94 | — | 10,000,000 | |||||||||||||||||||||
| November 2020 | — | $ | — | — | 10,000,000 | |||||||||||||||||||||
| December 2020 | — | $ | — | — | 10,000,000 | |||||||||||||||||||||
| Total | 5,882 | $ | 44.94 | — | ||||||||||||||||||||||
1 This number represents shares which were not purchased as part of a publicly announced plan or program, all of which were shares surrendered in transactions permitted under the Company’s benefit plans. It does not include shares withheld for taxes on option exercises, stock unit conversions, and forfeitures, all of which totaled 11,316 shares in the fourth quarter.
2 On August 4, 2004, the Board authorized management to repurchase up to 10 million shares each calendar year beginning January 1, 2005. This standing authorization was first reported in the quarterly report on Form 10-Q for the period ended June 30, 2004, filed August 5, 2004, and will remain in force until repealed by the Board of Directors. As such, effective January 1, 2021, the Company was authorized by the Board of Directors to repurchase up to 10 million shares in 2021. No specific repurchase schedule has been established. Because of the debt level increases in connection with the ECS acquisition in early 2019, we have and expect to continue to focus on deleveraging by temporarily limiting share repurchases, and using operating cash flow to repay debt.
31
Item 6. Selected Financial Data.
| (Unaudited) | 2020 1 | 2019 2 | 2018 3 | 2017 4 | 2016 5 | ||||||||||||||||||||||||
| (Dollar amounts in millions, except per share data) | |||||||||||||||||||||||||||||
| Summary of Operations | |||||||||||||||||||||||||||||
| Net Trade Sales from Continuing Operations | $ | 4,280 | $ | 4,753 | $ | 4,270 | $ | 3,944 | $ | 3,750 | |||||||||||||||||||
| Earnings from Continuing Operations | 248 | 334 | 306 | 294 | 367 | ||||||||||||||||||||||||
| Earnings (loss) from Discontinued Operations, net of tax | — | — | — | (1) | 19 | ||||||||||||||||||||||||
| Net Earnings attributable to Leggett & Platt, Inc. common shareholders | 248 | 334 | 306 | 293 | 386 | ||||||||||||||||||||||||
| Earnings per share from Continuing Operations | |||||||||||||||||||||||||||||
| Basic | 1.82 | 2.48 | 2.28 | 2.16 | 2.66 | ||||||||||||||||||||||||
| Diluted | 1.82 | 2.47 | 2.26 | 2.14 | 2.62 | ||||||||||||||||||||||||
| Earnings (Loss) per share from Discontinued Operations | |||||||||||||||||||||||||||||
| Basic | — | — | — | (.01) | .14 | ||||||||||||||||||||||||
| Diluted | — | — | — | (.01) | .14 | ||||||||||||||||||||||||
| Net Earnings per share | |||||||||||||||||||||||||||||
| Basic | 1.82 | 2.48 | 2.28 | 2.15 | 2.80 | ||||||||||||||||||||||||
| Diluted | 1.82 | 2.47 | 2.26 | 2.13 | 2.76 | ||||||||||||||||||||||||
| Cash Dividends declared per share | 1.60 | 1.58 | 1.50 | 1.42 | 1.34 | ||||||||||||||||||||||||
| Summary of Financial Position | |||||||||||||||||||||||||||||
| Total Assets | $ | 4,754 | $ | 4,816 | $ | 3,382 | $ | 3,551 | $ | 2,984 | |||||||||||||||||||
| Long-term Debt, including finance leases | $ | 1,849 | $ | 2,067 | $ | 1,168 | $ | 1,098 | $ | 956 | |||||||||||||||||||
All amounts are presented after tax.
1 Earnings from Continuing Operations for 2020 includes a $25 million goodwill impairment charge; a $6 million charge for note impairment; a $3 million stock write-off from a prior year divestiture; a $7 million charge for restructuring; and decreases from the impact of lower sales, primarily from pandemic-related economic declines across most of our businesses.
2 In January 2019, we acquired ECS for approximately $1.25 billion and increased our debt levels as discussed in Note R on page 125 and Note J on page 103 of the Notes to Consolidated Financial Statements. Earnings from Continuing Operations for 2019 includes a $13 million charge for restructuring; and a $1 million charge for ECS transaction costs.
3 Earnings from Continuing Operations for 2018 includes a $14 million charge for restructuring; a $12 million charge for note impairment; a $6 million charge for ECS transaction costs; and a $2 million benefit associated with Tax Cuts and Jobs Act (TCJA).
4 Earnings from Continuing Operations for 2017 includes a $50 million charge associated with TCJA; $13 million of net gains on sales of a business and real estate; an $8 million tax benefit from a divestiture; a $10 million pension settlement charge; and a $3 million charge for an impairment of a wire business.
5 Earnings from Continuing Operations for 2016 includes $16 million of gains on sales of businesses; a $3 million goodwill impairment charge; and a $5 million gain on a foam litigation settlement. Discontinued operations primarily consists of a gain on a foam litigation settlement.
32
PART II
Item 7. Management’s Discussion and Analysis of Financial Condition and Results of Operations.
HIGHLIGHTS
As with most companies, we faced a wide variety of challenges in 2020 stemming from the COVID-19 pandemic. The impact began in January, directly affecting our operations in China. The crisis accelerated, impacting virtually all geographies by mid-March. We quickly took action to align our variable cost structure to demand levels, significantly reduce fixed costs and cut capital expenditures, prioritize accounts receivable and inventory management, and amend the financial covenant in our revolving credit facility to provide additional liquidity. These efforts helped to strengthen cash flow and protect our balance sheet. By mid-second quarter, we began to see rapid recovery in businesses serving home-related markets. This benefited our Bedding, Home Furniture, Flooring, and Textiles businesses. As sales recovered, we maintained most of the fixed cost reductions, adding costs only to support higher volumes and future growth opportunities. EBIT margins benefited from this cost discipline.
Sales decreased 10% in 2020, primarily from pandemic-related economic declines across most of our businesses. Acquisitions added 1% to sales. Organic sales (as defined below) were down 11%, on 10% lower volume and raw material-related selling price decreases of 1%.
Earnings decreased primarily from the impact of lower sales, a change in LIFO impact, and a goodwill impairment charge, partially offset by fixed cost reductions.
In 2020, we generated operating cash flow of $603 million, a $65 million decrease versus a record $668 million in 2019. The decrease was driven primarily by lower earnings. We generated more than enough operating cash flow to fund dividends and capital expenditures, something we have accomplished each year for over 30 years.
Because of the economic impacts of the COVID-19 pandemic on our business, we amended our revolving credit agreement in May to change our financial covenant to a 4.75x net debt to trailing 12-month EBITDA metric (from 3.5x total debt). This change increased availability under our revolving credit facility, which serves as back-up for our commercial paper program. We ended 2020 with full availability under the $1.2 billion credit facility. We also continued our focus on deleveraging in 2020 by limiting acquisitions and share repurchases and using operating cash flow to repay debt. We reduced debt by $228 million in 2020 and expect to further reduce debt levels in 2021. Our financial base remains strong.
We increased the annual dividend in 2020 to $1.60 per share from $1.58 per share in 2019 and extended our record of consecutive annual increases to 49 years. Consistent with our deleveraging plan, share repurchases were limited in 2020. For the full year, we repurchased 240,000 shares of our stock, primarily surrendered for employee benefit plans.
Portfolio management remains a strategic priority. Over the past several years we have enhanced our business portfolio and improved margins by growing our stronger businesses and exiting or restructuring businesses that consistently struggled to deliver acceptable returns. During 2020, we divested two businesses in our Bedding Products segment: a small operation in our former Fashion Bed business and a small specialty wire operation in our Drawn Wire business. Total capital expenditures were $66 million, 54% lower than 2019, reflecting our sharp focus on optimizing cash flow as we navigated the effects of the COVID-19 pandemic.
We incurred the following pretax charges in 2020:
| (Dollar amounts in millions) | Cash | Non-Cash | Total | ||||||||||||||
| Goodwill impairment | $ | — | $ | 25 | $ | 25 | |||||||||||
| Note impairment | — | 8 | 8 | ||||||||||||||
| Stock write-off from prior year divestiture | — | 4 | 4 | ||||||||||||||
| Restructuring-related charges | 8 | 1 | 9 | ||||||||||||||
| Total charges | $ | 8 | $ | 38 | $ | 46 | |||||||||||
33
The $25 million goodwill impairment charge related to our Hydraulic Cylinders business. The $8 million impairment charge related to a note receivable. The $4 million stock write-off was associated with a prior year divestiture that filed bankruptcy in 2020. The restructuring-related charges are primarily attributable to pandemic-related severance costs.
These topics are discussed in more detail in the sections that follow.
INTRODUCTION
Total Shareholder Return
Total Shareholder Return (TSR), relative to peer companies, is a primary financial measure that we use to assess long-term performance. TSR = (Change in Stock Price + Dividends) ÷ Beginning Stock Price. Our goal is to achieve TSR in the top third of the S&P 500 companies over the long term through an approach that employs four TSR sources: revenue growth, margin expansion, dividends, and share repurchases.
We monitor our TSR performance relative to the S&P 500 on a rolling three-year basis. Our TSR was below the 11-14% target over the most recent 3-year period. Over those same years, the TSR of the S&P 500 at 14% was well above historical averages. As a result, our recent 3-year averages did not meet our top-third goal. For the 3-year period that ended on December 31, 2020, our TSR performance of 1% placed us in the bottom third of the S&P 500. We believe our disciplined growth strategy, portfolio management, and prudent use of capital will support achievement of our goal over time.
The table below shows the components of our TSR targets. Long term, accomplishing this level of performance over rolling three-year periods should enable us to consistently attain our top-third TSR goal.
| Current Targets | ||||||||
| Revenue Growth | 6-9% | |||||||
| Margin Increase | 1% | |||||||
| Dividend Yield | 3% | |||||||
| Stock Buyback | 1% | |||||||
| Total Shareholder Return | 11-14% | |||||||
Senior executives participate in an incentive program with a three-year performance period based on two equal measures: (i) our TSR performance compared to the performance of a group of approximately 300 peers, and (ii) the Company or segment Earnings Before Interest and Taxes (EBIT) Compound Annual Growth Rate (CAGR).
Customers
We serve a broad suite of customers, with our largest customer representing approximately 6% of our sales in 2020. Many are companies whose names are widely recognized. They include bedding brands and manufacturers; residential and office furniture producers; automotive OEM and Tier 1 manufacturers; and a variety of other companies.
Organic Sales
We calculate organic sales as trade sales excluding sales attributable to acquisitions and divestitures consummated within the last twelve months. Management uses the metric, and it is useful to investors, as supplemental information to analyze our underlying sales performance from period to period in our legacy businesses.
34
PART II
Major Factors That Impact Our Business
Many factors impact our business, but those that generally have the greatest impact are market demand, raw material cost trends, and competition. However, in 2020 COVID-19 has had the largest impact on our business.
COVID-19 Impacts on our Business
The impact of the COVID-19 pandemic began in January 2020, directly affecting our operations in China, as well as the global supply chain. The crisis accelerated, impacting virtually all geographies by mid-March. The pandemic had, and could further have, an adverse impact, in varying degrees, to among other things (i) the demand for our products and our customers’ products, growth rates in the industries in which we participate, and opportunities in those industries; (ii) our manufacturing operations' ability to remain open, or fully operate, obtain necessary raw materials and parts, maintain appropriate labor levels, and ship finished products to customers; (iii) operating costs related to pay and benefits for terminated employees; (iv) the collection of trade and other notes receivables in accordance with their terms due to customer bankruptcy, financial difficulties, or insolvency; (v) impairment of goodwill and long-lived assets; and (vi) our ability to borrow under our credit facility in compliance with restrictive covenants; all of which, in the aggregate, had, and could further have, a material negative impact on our trade sales, earnings, cash flow, and financial condition.
In response to the COVID-19 pandemic, we took action to:
•Implement comprehensive safety protocols
•Monitor and manage supply chain risks
•Align our variable cost structure to demand levels
•Significantly reduce fixed costs by approximately $90 million and cut capital expenditures by over 50% to $66 million (used primarily for maintenance capital)
•Prioritize accounts receivable collections and manage inventory levels
•Amend the financial covenant in our revolving credit facility to provide additional liquidity
These efforts helped to strengthen cash flow and protect our balance sheet as we moved through the year. By mid-second quarter 2020, we began to see rapid recovery in businesses serving home-related markets. With consumers spending less on travel and entertainment, they began investing more in their homes. This benefited our Bedding, Home Furniture, Flooring, and Textiles businesses. We ended 2020 with fourth quarter sales in many of our businesses above fourth quarter 2019 levels. We believe that our financial resources and liquidity levels, along with various contingency plans to reduce costs are sufficient to manage the impact currently anticipated from the COVID-19 pandemic. Below is a more in-depth discussion of the various 2020 impacts of COVID-19 on our business.
Demand for our Products. Various governments in Asia, Europe, North America, and elsewhere instituted, and some have reinstituted, quarantines, shelter-in-place, or stay-at-home orders, or restrictions on public gatherings as well as limitations on social interactions, which have had, and could further have, an adverse effect on the demand for our products.
Trade sales in 2020 were down 10% versus 2019. Following steep declines in the second quarter of 2020, we returned to year-over-year sales growth in the third and fourth quarters in ECS, U.S. and European Spring, Home Furniture, Fabric Converting, and Geo Components. These business units continued to benefit from a consumer spending focus on home products. Automotive trade sales grew in the fourth quarter, while demand continues to be weak in our Aerospace and Work Furniture business units.
Impact on our Manufacturing Operations. We have manufacturing facilities in the United States and 16 other countries. All of these countries have been affected by the COVID-19 pandemic. Our facilities are open but we have, from time to time, some capacity restrictions on our plants due to governmental orders in various parts of the world. We have been and could be further negatively affected by governmental action in any one or more of the countries in which we operate by the imposition, or re-imposition, of restrictive social measures, mandatory closures of retail establishments that sell our products or our customers’ products, travel restrictions, and restrictions on the import or export of products.
35
PART II
The U.S. and other governments have ordered that certain nonwoven fabrics used to produce ComfortCore® innersprings be prioritized to produce medical supplies, resulting in shortages of the fabrics for non-medical applications. These shortages and strong bedding demand have caused the Company temporarily to be unable to supply full industry demand for ComfortCore®. In an effort to manage supply chain risks, we are engaging with customers to work through these issues. The shortages have resulted in higher pricing for nonwoven fabrics. If we are unable to obtain the fabrics, cannot pass the cost along to our customers, are required to modify existing contracts to accommodate customers, or pay damage claims to customers, our results of operations may be negatively impacted. As demand has improved, we also have experienced some temporary labor shortages. We are in the process of hiring additional employees and adding equipment, particularly in our U.S. Spring business, to meet this demand.
Because of the shift of production by semiconductor microchip manufacturers to consumer electronics, such as laptops and tablets for home-schooling and home-offices, and away from automotive applications during the COVID-19 related automotive industry shutdowns in 2020, currently there is a shortage of microchips in the automotive industry. Our Automotive Group uses the microchips in seat comfort products, and to a lesser extent in motors and actuators. Although, to date, our Automotive Group has been able to obtain an adequate supply of microchips, we are dependent on our suppliers to deliver these microchips in accordance with our production schedule, and a shortage of the microchips can disrupt our operations and our ability to deliver products to our customers. Also, because of the industry shortage, automotive OEMs and other suppliers have not been able to secure an adequate supply of microchips, and as a result have reduced their production of automobiles or parts, which in turn has recently reduced, and may continue to reduce our sale of products. If we cannot secure an adequate supply of microchips in our supply chain, and the microchips cannot be sourced from a different supplier, or the automotive OEMs and other suppliers continue to reduce their production as a result of such shortage, this may negatively impact our sales, earnings and financial condition.
Some facilities have experienced problems delivering products to customers because of travel restrictions and disruption in logistics necessary to import, export, or transfer products across borders.
Our inability to keep our manufacturing operations open, build and maintain appropriate labor levels, obtain necessary raw materials and parts, and ship finished products to customers may increase labor and commodity costs and otherwise negatively impact our results of operations.
The Company has implemented comprehensive safety protocols focused on protecting our employees and ensuring a safe work environment. Where possible, our employees are working remotely. However, most of our production employees have returned to work. When employees test positive for COVID-19, we follow adopted protocols which include enhanced disinfecting that targets areas that have likely exposure to COVID-19. The employee is required to observe a quarantine period, monitor symptoms, and follow medical guidance prior to returning to work. Contact tracing is performed to identify any other employees who had direct contact with the employee who tested positive for COVID-19. If any direct contacts are identified, those employees must also self-isolate, monitor symptoms, and follow medical guidance prior to returning to work. A significant increase in COVID-19 cases among our employees may disrupt our ability to maintain necessary labor levels and produce and deliver products to our customers if we are unable to shift production to other manufacturing facilities.
Severance Costs Related to Workforce Reductions. To align our variable cost structure to reduced demand for our products in certain business units, we decreased the size of our workforce. We incurred severance costs of $7 million in 2020 and we do not expect any additional material charges. However, if circumstances change because of lack of demand, mandatory governmental closure of our facilities, or otherwise, we may incur future material separation costs.
Collection of Trade and Notes Receivables. Some of our customers and other third parties have been adversely affected by the social and governmental restrictions and limitations related to the COVID-19 pandemic. If these parties suffer significant financial difficulty, they may be unable to pay their debts to us, they may reject their contractual obligations to us under bankruptcy laws or otherwise, or we may have to negotiate significant discounts and/or extend financing terms with these parties. If we are unable to collect trade receivables and other notes receivables on a timely basis, this inability will require larger provisions for bad debt. We are closely monitoring accounts receivable and collections. However, at December 31, 2020, the level of our accounts receivable in current status was above pre-COVID-19 levels.
36
PART II
Impairment of Goodwill and Long-Lived Assets. A significant portion of our assets consists of goodwill and other long-lived assets, the carrying value of which may be reduced if we determine that those assets are impaired. At December 31, 2020, goodwill and other intangible assets represented $2.1 billion, or 44% of our total assets.
The 2020 annual goodwill impairment testing resulted in a $25 million non-cash goodwill impairment charge in the second quarter of 2020 with respect to our Hydraulic Cylinders reporting unit, which is a part of the Specialized Products segment. Demand for hydraulic cylinders is dependent upon capital spending for material handling equipment.
The impairment charge reflects the complete write-off of the goodwill associated with the Hydraulic Cylinders reporting unit and will not result in future cash expenditures. The anticipated longer-term economic impacts of COVID-19 lowered expectations of future revenue and profitability causing its fair value to fall below its carrying value. In connection with the preparation and review of the second quarter financial statements we concluded that an impairment charge was required with respect to this reporting unit.
Of the remaining six reporting units, three had fair values in excess of carrying value of less than 100%.
•Fair value for our Bedding reporting unit exceeded carrying value by 68%. Our 2019 acquisition of ECS is part of our Bedding reporting unit, and goodwill for our Bedding reporting unit was $857 million at December 31, 2020.
•Fair value for our Aerospace reporting unit exceeded carrying value by 51%. Goodwill for the Aerospace reporting unit was $59 million at December 31, 2020.
•Fair value for our Work Furniture reporting unit exceeded carrying value by 25%. Goodwill for the Work Furniture reporting unit was $97 million at December 31, 2020.
If there is a prolonged adverse economic impact from the COVID-19 pandemic, or otherwise, we may not be able to achieve projected performance levels. Internal forecasts and industry data suggest that economic impacts of COVID-19 for the aerospace industry may be longer than previously expected. We are continuing to monitor all factors impacting this industry. If actual results materially differ from the assumptions and estimates used in the goodwill and long-lived asset valuation calculations, we could incur future impairment charges. These non-cash charges could have a material negative impact on our earnings.
Our Ability to Borrow under our Credit Facility. Our multi-currency credit facility matures in January 2024 and provides us the ability, from time to time subject to certain restrictive covenants and customary conditions, to borrow, repay, and re-borrow up to $1.2 billion. Because of the economic impacts of the COVID-19 pandemic on our business, in early May 2020 we amended the credit facility to, among other things, change the restrictive borrowing covenants. The prior leverage ratio covenant required us to maintain a leverage ratio of consolidated funded indebtedness to trailing 12-month consolidated EBITDA (each as defined in the credit facility) of not greater than 3.50 to 1.00. The covenant was changed in two ways: (i) the calculation of the ratio now subtracts unrestricted cash (as defined in the credit facility) from consolidated funded indebtedness; and (ii) the ratio levels were changed to 4.75 to 1.00 for each fiscal quarter-end date through March 31, 2021; 4.25 to 1.00 at June 30, 2021; 3.75 to 1.00 at September 30, 2021; and 3.25 to 1.00 at December 31, 2021 and thereafter. In addition, the amount of total secured debt limit was changed from 15% to 5% of our total consolidated assets until December 31, 2021, at which time it will revert back to 15%. Various interest rate terms were also changed. The impact on our interest expense will depend upon our ability to access the commercial paper market, and if so, the degree of that access. The amended credit facility also contains an anti-cash hoarding provision that limits borrowing if the Company has a consolidated cash balance (as defined in the credit facility) in excess of $300 million without planned expenditures. At December 31, 2020, the Company was in compliance with all of its debt covenants and expects to be able to maintain compliance with the amended debt covenant requirements.
Our credit facility serves as back-up for our commercial paper program. At December 31, 2020, we had no commercial paper outstanding and had no borrowing under the credit facility. As our trailing 12-month consolidated EBITDA, unrestricted cash, and debt levels change, our borrowing capacity increases or decreases. Based on our trailing 12-month consolidated EBITDA, unrestricted cash, and debt levels at December 31, 2020, our borrowing capacity under the credit facility was the full $1.2 billion at year end. However, this may not be indicative of the actual borrowing capacity going forward, which may be materially different depending on our consolidated EBITDA, unrestricted cash, and
37
PART II
debt levels at that time. Also, our access to the commercial paper market may be restricted depending on the impact of the COVID-19 pandemic to the short-term debt markets.
Relief under the CARES Act and Foreign Governmental Subsidies. We are deferring payment of employer's Social Security match into 2021 and 2022, as provided by the Coronavirus Aid, Relief, and Economic Security (CARES) Act. Through December 31, 2020, we have deferred $19 million. Half of the amount will be paid in 2021 and half in 2022. We also received $21 million in government subsidies, primarily in our international locations, in 2020. These deferrals and subsidies are not expected to have a material impact on our short- or long-term financial condition, results of operations, liquidity, or capital resources and do not contain material restrictions on our operations, sources of funding, or otherwise.
Market Demand
Market demand (including product mix) is impacted by several economic factors, with consumer confidence being the most significant. Other important factors include disposable income levels, employment levels, housing turnover, and interest rates. All of these factors influence consumer spending on durable goods, and therefore affect demand for our products and components. Some of these factors also influence business spending on facilities and equipment, which impacts approximately 20% of our sales.
Raw Material Costs
Our costs can vary significantly as market prices for raw materials (many of which are commodities) fluctuate. We typically have short-term commitments from our suppliers; accordingly, our raw material costs generally move with the market. Our ability to recover higher costs (through selling price increases) is crucial. When we experience significant increases in raw material costs, we typically implement price increases to recover the higher costs. Conversely, when costs decrease significantly, we generally pass those lower costs through to our customers. The timing of our price increases or decreases is important; we typically experience a lag in recovering higher costs, and we also realize a lag as costs decline.
Steel is our principal raw material. At various times in past years, we have experienced significant cost fluctuations in this commodity. In most cases, the major changes (both increases and decreases) were passed through to customers with selling price adjustments. Over the past few years, we have seen varying degrees of inflation and deflation in U.S. steel pricing. In 2019, steel costs decreased through most of the year. In 2020, steel costs deflated modestly through the majority of the year followed by significant inflation late in the year.
As a producer of steel rod, we are also impacted by changes in metal margins (the difference in the cost of steel scrap and the market price for steel rod). In 2019, although steel prices decreased through the year, a wider metal margin persisted. As a result, our steel operations experienced enhanced profitability in 2019. In 2020, these metal margins compressed to near normalized levels.
With the acquisition of ECS, we now have greater exposure to the cost of chemicals, including TDI, MDI, and polyol. The cost of these chemicals has fluctuated at times, but ECS has generally passed the changes through to its customers. In 2019, ECS experienced a negative effect on trade sales due to chemical deflation. In 2020, chemicals deflated further in the first half of the year followed by inflation in the second half of the year as a result of supply shortages.
Our other raw materials include woven and nonwoven fabrics and foam scrap. We have experienced changes in the cost of these materials and generally have been able to pass them through to our customers.
When we raise our prices to recover higher raw material costs, this sometimes causes customers to modify their product designs and replace higher cost components with lower cost components. We must continue providing product options to our customers that enable them to improve the functionality of their products and manage their costs, while providing higher profits for our operations.
38
PART II
Competition
Many of our markets are highly competitive, with the number of competitors varying by product line. In general, our competitors tend to be smaller, private companies. Many of our competitors, both domestic and foreign, compete primarily on the basis of price. Our success has stemmed from the ability to remain price competitive, while delivering innovation, better product quality, and customer service.
We continue to face pressure from foreign competitors, as some of our customers source a portion of their components and finished products offshore. In addition to lower labor rates, foreign competitors benefit (at times) from lower raw material costs. They may also benefit from currency factors and more lenient regulatory climates. We typically remain price competitive in most of our business units, even versus many foreign manufacturers, as a result of our highly efficient operations, automation, vertical integration in steel and wire, logistics and distribution efficiencies, and large scale purchasing of raw materials and commodities. However, we have also reacted to foreign competition in certain cases by selectively adjusting prices, developing new proprietary products that help our customers reduce total costs, and shifting production offshore to take advantage of lower input costs.
Since 2009, there have been antidumping duty orders on innerspring imports from China, South Africa, and Vietnam, ranging from 116% to 234%. In September 2019, the Department of Commerce (DOC) and the International Trade Commission (ITC) concluded a second sunset review extending the orders for an additional five years, through October 2024; at which time, the DOC and ITC will conduct a third sunset review to determine whether to extend the orders for an additional five years.
Antidumping and countervailing duty cases filed by major U.S. steel wire rod producers have resulted in the imposition of antidumping duties on imports of steel wire rod from Brazil, China, Belarus, Indonesia, Italy, Korea, Mexico, Moldova, Russia, South Africa, Spain, Trinidad & Tobago, Turkey, Ukraine, United Arab Emirates, and the United Kingdom, ranging from 1% to 757%, and countervailing duties on imports of steel wire rod from Brazil, China, Italy, and Turkey, ranging from 3% to 193%. In June 2020, the ITC and DOC concluded a first sunset review, extending the orders on China through June 2025, and in July 2020, the ITC and DOC concluded a third sunset review, determining to extend the orders on Brazil, Indonesia, Mexico, Moldova, and Trinidad & Tobago through August 2025. Duties will continue through December 2022 for Belarus, Italy, Korea, Russia, South Africa, Spain, Turkey, Ukraine, United Arab Emirates, and the United Kingdom. At those times, the DOC and the ITC will conduct sunset reviews to determine whether to extend those orders for an additional five years.
In September 2018, the Company, along with other domestic mattress producers, filed petitions with the DOC and the ITC alleging that manufacturers of mattresses in China were unfairly selling their products in the United States at less than fair value (dumping) and seeking the imposition of duties on mattresses imported from China. In October 2019, the DOC made a final determination assigning duty rates between 57% to 1,732%. In November 2019, the ITC made a unanimous final determination that domestic mattress producers were materially injured by reason of the unfairly priced imported mattresses. An antidumping order on imports of Chinese mattresses will remain in effect for five years, through December 2024, at which time the DOC and ITC will conduct a sunset review to determine whether to extend the order for an additional five years.
In March 2020, the Company, along with other domestic mattress producers and two labor unions representing workers at other mattress producers, filed antidumping petitions with the DOC and the ITC alleging that manufacturers of mattresses in Cambodia, Indonesia, Malaysia, Serbia, Thailand, Turkey, and Vietnam were unfairly selling their products in the United States at less than fair value (dumping) and a countervailing duty petition alleging manufacturers of mattresses in China were benefiting from subsidies. In May 2020, the ITC made a unanimous, affirmative preliminary determination of a reasonable likelihood of injury. In August 2020, the DOC made a preliminary determination in the countervailing investigation, assigning China a duty rate of 97.78%, and, in late October 2020, the DOC made preliminary determinations in the antidumping investigations, assigning duty rates of 2.61- 989.9%. Final determinations are expected in the first half of 2021. See Item 3 Legal Proceedings on page 28 for more information.
39
PART II
Acquisition of ECS
On January 16, 2019, we acquired ECS for a cash purchase price of approximately $1.25 billion. ECS, headquartered in Newnan, Georgia, is a leader in specialized foam technology, primarily for the bedding and furniture industries. With 16 facilities across the United States, ECS operates a vertically-integrated model, developing many of the chemicals and additives used in foam production, producing specialty foam, and manufacturing private label finished products. These innovative specialty foam products include finished mattresses sold through both traditional and online channels, mattress components, mattress toppers and pillows, and furniture foams. ECS has a diversified customer mix and a strong position in the high-growth compressed mattress market segment. ECS operates within the Bedding Products segment.
For information on the financing of the ECS acquisition, please see the Commercial Paper Program on page 55.
Change in Segment Reporting in 2020
Our reportable segments are the same as our operating segments, which also correspond with our management organizational structure. To reflect how we manage our businesses, and in conjunction with the change in executive officer leadership, our management organizational structure and all related internal reporting changed effective January 1, 2020. As a result, the composition of our segments also changed to reflect the new structure. For information on the change in our segment reporting structure, please see Item 1 Business, Revised Segment Structure on page 7.
RESULTS OF OPERATIONS—2020 vs. 2019
Trade sales decreased 10% in 2020. Acquisitions, net of divestitures, added 1% to sales growth. Organic sales decreased 11%, with volume down 10%. Trade sales were primarily impacted by pandemic-related economic declines along with the planned lower volume in business we exited in connection with the 2018 Restructuring Plan as discussed in Note E beginning on page 93 of the Notes to Consolidated Financial Statements (which reduced trade sales 2%). Raw material-related selling price decreases early in the year reduced trade sales 1%.
Earnings decreased primarily from lower trade sales volume, change in LIFO impact, and a goodwill impairment charge, partially offset by fixed cost reductions. Further details about our consolidated and segment results are discussed below.
40
PART II
Consolidated Results
The following table shows the changes in sales and earnings during 2020, and identifies the major factors contributing to the changes.
| (Dollar amounts in millions, except per share data) | Amount | % 1 | |||||||||
| Net trade sales: | |||||||||||
| Year ended December 31, 2019 | $ | 4,753 | |||||||||
| Divestitures | (14) | — | % | ||||||||
| 2019 sales excluding divestitures | 4,739 | ||||||||||
| Approximate volume losses | (483) | (10) | % | ||||||||
| Approximate raw material-related inflation and currency impact | (32) | (1) | |||||||||
| Organic sales | (515) | (11) | |||||||||
| Acquisition sales growth | 56 | 1 | |||||||||
| Year ended December 31, 2020 | $ | 4,280 | (10) | % | |||||||
| Earnings: | |||||||||||
| (Dollar amounts, net of tax) | |||||||||||
| Year ended December 31, 2019 | $ | 334 | |||||||||
| Lower restructuring-related charges ($13 in 2019; $7 in 2020) | 6 | ||||||||||
| Goodwill impairment | (25) | ||||||||||
| Note impairment | 6 | ||||||||||
| Stock write-off from a prior year divestiture | (3) | ||||||||||
Other items, including COVID-related economic declines and a change in LIFO impact, partially offset by fixed cost reductions, lower interest expense and lower taxes | (70) | ||||||||||
| Year ended December 31, 2020 | $ | 248 | |||||||||
| 2019 Earnings Per Diluted Share | $ | 2.47 | |||||||||
| 2020 Earnings Per Diluted Share | $ | 1.82 | |||||||||
1 Calculations impacted by rounding
Full-year trade sales decreased 10%, to $4,280 million, and organic sales decreased 11%. Volume declined 10%, primarily due to pandemic-related economic declines and the planned exit of business in Fashion Bed and Drawn Wire which reduced sales 2%. Raw material-related selling price deflation early in the year reduced sales by 1%. Acquisitions, net of divestitures, contributed 1% to sales growth.
As indicated in the table above, earnings decreased from the goodwill impairment charge, the impairment charge related to a note receivable, and the stock write-off associated with a prior year divestiture that filed bankruptcy in 2020, partially offset by lower restructuring-related charges. Operationally, earnings decreased primarily from the impact of lower sales and a change in LIFO impact, partially offset by fixed cost reductions.
41
LIFO Impact
The last-in, first-out (LIFO) method is primarily used to value our domestic steel-related inventories, largely in the Bedding Products segment and Furniture, Flooring & Textile Products segment. Prior to 2019, inventories accounted for using the LIFO method represented approximately 50% of our inventories. With the acquisition of ECS in the first quarter of 2019, inventories valued using the LIFO method decreased to roughly 40%, as ECS does not utilize the LIFO method. However, due to the sharp increase in demand that began in the latter part of the second quarter of 2020 and several divestitures and closures of operations using the LIFO method in the last three years, our LIFO inventories have been lower than historical levels, and currently represent about one-third of our total inventories. In 2020, a sharp increase in steel scrap costs during the fourth quarter resulted in a full-year pretax LIFO expense of $8 million. In 2019, decreasing steel costs resulted in a full-year pretax LIFO benefit of $32 million.
For further discussion of inventories, see Note A on page 82 of the Notes to Consolidated Financial Statements.
Interest and Income Taxes
Net interest expense in 2020 was lower by $4 million compared to the twelve months ended December 31, 2019 primarily due to lower debt levels and interest rates.
Our worldwide effective income tax rate was 23% in 2020, compared to 22% in 2019. The following table reflects how our effective income tax rate differs from the statutory federal income tax rate. See Note N on page 119 of the Notes to Consolidated Financial Statements for additional details.
| Year Ended December 31 | |||||||||||
| 2020 | 2019 | ||||||||||
| Statutory federal income tax rate | 21.0 | % | 21.0 | % | |||||||
| Increases (decreases) in rate resulting from: | |||||||||||
| State taxes, net of federal benefit | .8 | 1.4 | |||||||||
| Tax effect of foreign operations | (2.2) | (1.6) | |||||||||
| Global intangible low-taxed income | (.4) | 2.2 | |||||||||
| Current and deferred foreign withholding taxes | 2.8 | 1.2 | |||||||||
| Stock-based compensation | (.6) | (1.1) | |||||||||
| Change in valuation allowance | .8 | .4 | |||||||||
| Change in uncertain tax positions, net | .6 | (.3) | |||||||||
| Goodwill impairment | 1.7 | — | |||||||||
| Other permanent differences, net | (1.4) | (.3) | |||||||||
| Other, net | (.3) | (.5) | |||||||||
| Effective tax rate | 22.8 | % | 22.4 | % | |||||||
42
PART II
Segment Results
In the following section we discuss 2020 sales and EBIT (earnings before interest and taxes) for each of our segments. We provide additional detail about segment results and a reconciliation of segment EBIT to consolidated EBIT in Note F on page 95 of the Notes to Consolidated Financial Statements. All segment data has been retrospectively adjusted to reflect the change in segment structure discussed on page 7.
| (Dollar amounts in millions) | 2020 | 2019 | Change in Sales | % Change Organic | |||||||||||||||||||||||||||||||
| $ | % | Sales 1 | |||||||||||||||||||||||||||||||||
| Trade Sales | |||||||||||||||||||||||||||||||||||
| Bedding Products | $ | 2,039.3 | $ | 2,254.3 | $ | (215.0) | (9.5) | % | (10.0) | % | |||||||||||||||||||||||||
| Specialized Products | 891.2 | 1,066.8 | (175.6) | (16.5) | (16.5) | ||||||||||||||||||||||||||||||
| Furniture, Flooring & Textile Products | 1,349.7 | 1,431.4 | (81.7) | (5.7) | (8.1) | ||||||||||||||||||||||||||||||
| Total trade sales | $ | 4,280.2 | $ | 4,752.5 | $ | (472.3) | (9.9) | % | (10.9) | % | |||||||||||||||||||||||||
| 2020 | 2019 | Change in EBIT | EBIT Margins | ||||||||||||||||||||||||||||||||
| $ | % | 2020 | 2019 | ||||||||||||||||||||||||||||||||
| EBIT | |||||||||||||||||||||||||||||||||||
| Bedding Products | $ | 185.8 | $ | 235.8 | $ | (50.0) | (21.2) | % | 9.1 | % | 10.5 | % | |||||||||||||||||||||||
| Specialized Products | 91.9 | 170.5 | (78.6) | (46.1) | 10.3 | 16.0 | |||||||||||||||||||||||||||||
| Furniture, Flooring & Textile Products | 126.2 | 107.4 | 18.8 | 17.5 | 9.4 | 7.5 | |||||||||||||||||||||||||||||
| Intersegment eliminations & other | (3.4) | (.3) | (3.1) | ||||||||||||||||||||||||||||||||
| Total EBIT | $ | 400.5 | $ | 513.4 | $ | (112.9) | (22.0) | % | 9.4 | % | 10.8 | % | |||||||||||||||||||||||
| 2020 | 2019 | ||||||||||||||||||||||||||||||||||
| Depreciation and Amortization | |||||||||||||||||||||||||||||||||||
| Bedding Products | $ | 106.7 | $ | 107.3 | |||||||||||||||||||||||||||||||
| Specialized Products | 44.3 | 41.8 | |||||||||||||||||||||||||||||||||
| Furniture, Flooring & Textile Products | 25.5 | 25.7 | |||||||||||||||||||||||||||||||||
Unallocated 2 | 12.9 | 17.1 | |||||||||||||||||||||||||||||||||
| Total Depreciation and Amortization | $ | 189.4 | $ | 191.9 | |||||||||||||||||||||||||||||||
1 This is the change in sales not attributable to acquisitions or divestitures in the last 12 months. Refer to the Bedding Products and Furniture, Flooring & Textile Products discussions below for a reconciliation of the change in total segment sales to organic sales.
2 Unallocated consists primarily of depreciation and amortization on non-operating assets.
Bedding Products
Trade sales decreased 9.5%. Acquisitions, net of divestitures, increased sales .5%. Organic sales were down 10%. Volume decreased 9%, with raw material-related selling price decreases and negative currency impact reducing sales 1%.
EBIT decreased $50 million, primarily from pandemic-related economic declines, change in LIFO impact, lower metal margin in our rod mill, and the $8 million impairment related to a note receivable, partially offset by fixed cost reductions.
43
Specialized Products
In Specialized Products, trade sales were down 16%. Organic sales were down 16%, with volume down 17%. Currency benefit increased sales 1%.
EBIT decreased $79 million, primarily from pandemic-related economic declines and a $25 million goodwill impairment charge in Hydraulic Cylinders, partially offset by fixed cost reductions.
Furniture, Flooring & Textile Products
Trade sales in Furniture, Flooring & Textile Products decreased 6%. Organic sales were down 8% and volume decreased 8%, with raw material-related selling price decreases offset by a currency benefit. A small Geo Components acquisition completed in December 2019 added 2% to trade sales.
EBIT increased $19 million, primarily from fixed cost reductions, improved pricing and lower restructuring-related charges, partially offset by lower volume.
RESULTS OF OPERATIONS—2019 vs. 2018
Trade sales increased 11% in 2019. Acquisitions, primarily ECS, added 14% to sales. Organic sales were down 3%, on 3% lower volume. Raw material-related selling price increases added 1% to sales, offset by a 1% negative currency impact. Sales growth in most businesses, including U.S. Spring, Automotive, Work Furniture, and Aerospace, was offset primarily by the planned exit of business in Fashion Bed and Home Furniture which reduced sales 3% and weak trade demand for steel rod and wire.
Earnings increased from the non-recurrence of a note impairment charge in 2018 and lower restructuring-related and acquisition-related transaction costs. Earnings further improved from lower raw material costs (including LIFO benefit), the ECS acquisition, and improved earnings performance as a result of the restructuring activities in our Home Furniture and Fashion Bed businesses. Further details about our consolidated and segment results are discussed below.
44
PART II
Consolidated Results
The following table shows the changes in sales and earnings during 2019, and identifies the major factors contributing to the changes.
| (Dollar amounts in millions, except per share data) | Amount | % 1 | |||||||||
| Net trade sales: | |||||||||||
| Year ended December 31, 2018 | $ | 4,270 | |||||||||
| Approximate volume losses | (112) | (3) | % | ||||||||
| Approximate raw material-related inflation and currency impact | (22) | — | |||||||||
| Organic sales | (134) | (3) | |||||||||
| Acquisition sales growth | 617 | 14 | |||||||||
| Year ended December 31, 2019 | $ | 4,753 | 11 | % | |||||||
| Earnings: | |||||||||||
| (Dollar amounts, net of tax) | |||||||||||
| Year ended December 31, 2018 | $ | 306 | |||||||||
| Lower restructuring-related charges ($14 in 2018; $13 in 2019) | 1 | ||||||||||
| Lower ECS transaction costs ($6 in 2018; $1 in 2019) | 5 | ||||||||||
| Non-recurrence of note impairment | 12 | ||||||||||
| Other items, including contribution from ECS, lower raw material costs (including LIFO benefit) and improved earnings primarily in Furniture, Flooring & Textile Products partially offset by higher interest expense and higher taxes | 10 | ||||||||||
| Year ended December 31, 2019 | $ | 334 | |||||||||
| 2018 Earnings Per Diluted Share | $ | 2.26 | |||||||||
| 2019 Earnings Per Diluted Share | $ | 2.47 | |||||||||
1 Calculations impacted by rounding
Full-year trade sales grew 11%, to $4.75 billion, and organic sales decreased 3%. Volume declined 3%, with gains in most of our businesses, including U.S. Spring, Automotive, Work Furniture, and Aerospace, more than offset by the planned exit of business in Fashion Bed and Home Furniture which reduced sales 3% and weak trade demand for steel rod and wire. Raw material-related selling price inflation from increases implemented in late 2018 were offset by a negative currency impact. Acquisitions contributed 14% to sales growth.
As indicated in the table above, earnings increased from the non-recurrence of a note impairment charge in 2018 and lower restructuring-related and acquisition-related transaction costs. Operationally, earnings improved primarily from lower raw material costs (including LIFO benefit), the ECS acquisition, and improved earnings performance from the 2018 Restructuring Plan.
LIFO Impact
At December 31, 2019, approximately 40% of our inventories were valued on the LIFO method. These were primarily our domestic, steel-related inventories. In 2019, decreasing steel costs resulted in a full-year pretax LIFO benefit of $32 million. In 2018, increasing steel costs resulted in a full-year pretax LIFO expense of $31 million.
For further discussion of inventories, see Note A on page 82 of the Notes to Consolidated Financial Statements.
Interest and Income Taxes
Net interest expense in 2019 was higher by $30 million primarily due to debt increases in early 2019 to fund the ECS acquisition.
45
Our worldwide effective income tax rate was 22% in 2019, compared to 20% in 2018. The following table reflects how our effective income tax rate differs from the statutory federal income tax rate. See Note N on page 119 of the Notes to Consolidated Financial Statements for additional details.
| Year Ended December 31 | |||||||||||
| 2019 | 2018 | ||||||||||
| Statutory federal income tax rate | 21.0 | % | 21.0 | % | |||||||
| Increases (decreases) in rate resulting from: | |||||||||||
| State taxes, net of federal benefit | 1.4 | .9 | |||||||||
| Tax effect of foreign operations | (1.6) | (.7) | |||||||||
| Global intangible low-taxed income | 2.2 | .7 | |||||||||
| Current and deferred foreign withholding taxes | 1.2 | 3.8 | |||||||||
| Stock-based compensation | (1.1) | (.8) | |||||||||
| Change in valuation allowance | .4 | (2.0) | |||||||||
| Change in uncertain tax positions, net | (.3) | (.3) | |||||||||
| Other permanent differences, net | (.3) | (1.4) | |||||||||
| Other, net | (.5) | (.8) | |||||||||
| Effective tax rate | 22.4 | % | 20.4 | % | |||||||
46
PART II
Segment Results
In the following section we discuss 2019 sales and EBIT for each of our segments. We provide additional detail about segment results and a reconciliation of segment EBIT to consolidated EBIT in Note F on page 95 of the Notes to Consolidated Financial Statements. All segment data has been retrospectively adjusted to reflect the change in segment structure discussed on page 7.
| (Dollar amounts in millions) | 2019 | 2018 | Change in Sales | % Change Organic | |||||||||||||||||||||||||||||||
| $ | % | Sales 1 | |||||||||||||||||||||||||||||||||
| Trade Sales | |||||||||||||||||||||||||||||||||||
| Bedding Products | $ | 2,254.3 | $ | 1,795.3 | $ | 459.0 | 25.6 | % | (6.0) | % | |||||||||||||||||||||||||
| Specialized Products | 1,066.8 | 1,056.3 | 10.5 | 1.0 | — | ||||||||||||||||||||||||||||||
| Furniture, Flooring & Textile Products | 1,431.4 | 1,417.9 | 13.5 | 1.0 | (2.0) | ||||||||||||||||||||||||||||||
| Total trade sales | $ | 4,752.5 | $ | 4,269.5 | $ | 483.0 | 11.3 | % | (3.0) | % | |||||||||||||||||||||||||
| 2019 | 2018 | Change in EBIT | EBIT Margins | ||||||||||||||||||||||||||||||||
| $ | % | 2019 | 2018 | ||||||||||||||||||||||||||||||||
| EBIT | |||||||||||||||||||||||||||||||||||
| Bedding Products | $ | 235.8 | $ | 149.8 | $ | 86.0 | 57.4 | % | 10.3 | % | 8.1 | % | |||||||||||||||||||||||
| Specialized Products | 170.5 | 189.0 | (18.5) | (9.8) | 15.9 | 17.8 | |||||||||||||||||||||||||||||
| Furniture, Flooring & Textile Products | 107.4 | 98.6 | 8.8 | 8.9 | 7.4 | 6.9 | |||||||||||||||||||||||||||||
| Intersegment eliminations & other | (.3) | (.5) | .2 | ||||||||||||||||||||||||||||||||
| Total EBIT | $ | 513.4 | $ | 436.9 | $ | 76.5 | 17.5 | % | 10.8 | % | 10.2 | % | |||||||||||||||||||||||
| 2019 | 2018 | ||||||||||||||||||||||||||||||||||
| Depreciation and Amortization | |||||||||||||||||||||||||||||||||||
| Bedding Products | $ | 107.3 | $ | 47.3 | |||||||||||||||||||||||||||||||
| Specialized Products | 41.8 | 39.0 | |||||||||||||||||||||||||||||||||
| Furniture, Flooring & Textile Products | 25.7 | 27.0 | |||||||||||||||||||||||||||||||||
Unallocated 2 | 17.1 | 22.8 | |||||||||||||||||||||||||||||||||
| Total Depreciation and Amortization | $ | 191.9 | $ | 136.1 | |||||||||||||||||||||||||||||||
1 This is the change in sales not attributable to acquisitions or divestitures in the last 12 months. Refer to each segment discussion below for a reconciliation of the change in total segment trade sales to organic sales.
2 Unallocated consists primarily of depreciation and amortization on non-operating assets.
Bedding Products
Trade sales grew 26%. Acquisitions added 32% to sales partially offset by a 6% organic sales decline. Volume decreased 5%, primarily from our decision to exit Fashion Bed and weak trade demand for steel rod and wire, partially offset by growth in U.S Spring and European Spring. Currency impact reduced sales by 1%.
EBIT increased $86 million, primarily from lower raw material costs (including LIFO benefit), earnings from the ECS acquisition (including $45 million of amortization expense and a $5 million non-recurring charge related to acquired inventories) and the non-recurrence of a $16 million non-cash impairment charge related to a note receivable in the fourth quarter of 2018.
47
Specialized Products
Trade sales were up 1% from the PHC acquisition in early 2018. Organic sales were flat. Volume increased 2% from growth in Automotive and Aerospace. Currency impact, net of raw material-related selling price increases in Hydraulic Cylinders, decreased sales 2%.
EBIT decreased $18 million, with earnings from higher sales offset by higher operating costs in Aerospace and Hydraulic Cylinders, negative currency impact, and investment to support future growth in Automotive.
Furniture, Flooring & Textile Products
Trade sales increased 1%. Acquisitions added 3% to sales. Organic sales were down 2%. Volume decreased 3%, primarily from planned declines in Home Furniture and lower sales in Flooring Products, partially offset by growth in Work Furniture and Geo Components. Raw material-related price increases, net of negative current impact, added 1% to sales.
EBIT increased $9 million, primarily from improved pricing and lower fixed costs attributable to restructuring activity and lower restructuring-related charges ($6 million in 2019 versus $9 million in 2018).
LIQUIDITY AND CAPITALIZATION
In 2020, we generated $603 million in cash from operations, a $65 million decrease from 2019. Our operations provided more than enough cash to fund both capital expenditures and dividend payments, something we have accomplished each year for over 30 years. We expect this to again be the case in 2021.
Total capital expenditures in 2020 were $66 million, 54% lower than 2019, reflecting our sharp focus on optimizing cash flow as we navigated the effects of COVID-19. We raised the annual dividend to $1.60 per share from $1.58 per share and extended our record of consecutive annual increases to 49 years.
In May, we amended our revolving credit agreement to change our financial covenant to a 4.75x net debt to trailing 12-month EBITDA metric (from 3.5x total debt). This change increased availability under the revolving credit facility, which serves as back-up for our commercial paper program. We ended 2020 with full availability under the $1.2 billion credit facility.
We also continued our focus on deleveraging in 2020 by limiting acquisitions and share repurchases and using operating cash flow to repay debt. We reduced debt by $228 million in 2020 and expect to further reduce debt levels in 2021. In keeping with our deleveraging plan, we repurchased only 240,000 shares of our stock during the year, primarily surrendered for employee benefit plans.
48
PART II
Cash from Operations
Cash from operations is our primary source of funds. Earnings and changes in working capital levels are the two factors that generally have the greatest impact on our cash from operations.
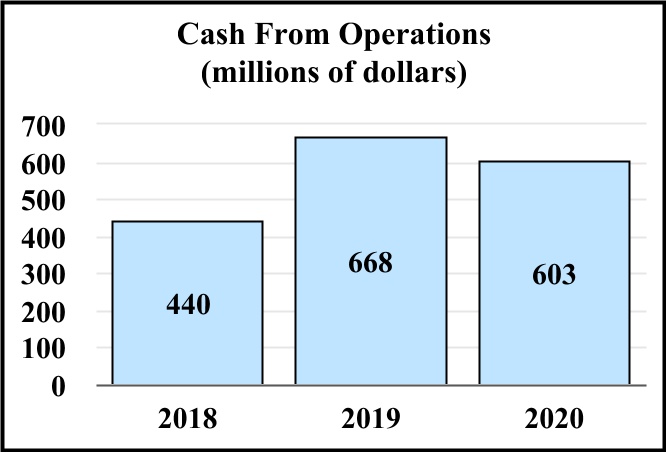
Cash from operations-2018 $440 million, 2019 $668 million, 2020 $603 million
Cash from operations decreased $65 million in 2020, primarily reflecting lower earnings.
We closely monitor our working capital levels and we ended 2020 with working capital at 12.8% and adjusted working capital at 7.4% of annualized sales.1 The table below explains this non-GAAP calculation. We eliminate cash and current debt maturities from working capital to monitor our operating efficiency and performance related to trade receivables, inventories, and accounts payable. We believe this provides a more useful measurement to investors since cash and current maturities can fluctuate significantly from period to period.
| (Dollar amounts in millions) | 2020 | 2019 | |||||||||
| Current assets | $ | 1,612.1 | $ | 1,538.1 | |||||||
| Current liabilities | 1,006.0 | 928.1 | |||||||||
| Working capital | 606.1 | 610.0 | |||||||||
| Cash and cash equivalents | 348.9 | 247.6 | |||||||||
| Current debt maturities and current portion of operating lease liabilities | 93.3 | 90.4 | |||||||||
| Adjusted working capital | $ | 350.5 | $ | 452.8 | |||||||
Annualized sales 1 | $ | 4,728.0 | $ | 4,579.6 | |||||||
| Working capital as a percent of annualized sales | 12.8 | % | 13.3 | % | |||||||
| Adjusted working capital as a percent of annualized sales | 7.4 | % | 9.9 | % | |||||||
1 Annualized sales equal fourth quarter sales ($1,182.0 million in 2020 and $1,144.9 million in 2019) multiplied by 4. We believe measuring our working capital against this sales metric is more useful, since efficient management of working capital includes adjusting those net asset levels to reflect current business volume.
49
PART II
Three Primary Components of our Working Capital
| Amount (in millions) | Days | |||||||||||||||||||||||||||||||||||||
| 2020 | 2019 | 2018 | 2020 | 2019 | 2018 | |||||||||||||||||||||||||||||||||
| Trade Receivables | $ | 535 | $ | 564 | $ | 545 | DSO 1 | 47 | 43 | 46 | ||||||||||||||||||||||||||||
| Inventories | 646 | 637 | 634 | DIO 2 | 69 | 63 | 65 | |||||||||||||||||||||||||||||||
| Accounts Payable | 552 | 463 | 465 | DPO 3 | 55 | 46 | 48 | |||||||||||||||||||||||||||||||
1Days sales outstanding: ((beginning of year trade receivables + end of period trade receivables) ÷ 2) ÷ (net trade sales ÷ number of days in the period).
2Days inventory on hand: ((beginning of year inventory + end of period inventory) ÷ 2) ÷ (cost of goods sold ÷ number of days in the period).
3Days payables outstanding: ((beginning of year accounts payable + end of period accounts payable) ÷ 2) ÷ (cost of goods sold ÷ number of days in the period).
Trade Receivables - At December 31, 2020, compared to 2019, our trade receivables decreased by $29 million and our DSO increased. Although our DSO increased notably in the first half of the year as a result of COVID-19, strong credit discipline drove steady DSO improvement in the latter half of the year to a more normal level.
We are closely monitoring accounts receivable and collections. We recognized $17 million of bad debt expense for the year:
•$20 million in the first quarter partially due to COVID-19 impacts on our customers and risk across our account portfolio; approximately half was associated with a Bedding customer that was partially reserved in 2018 and had continued to experience financial difficulties and liquidity problems over the last two years.
•$3 million reductions to bad debt expense during the last half of the year as our accounts receivable in current status improved and returned to a standing consistent with pre-COVID-19 levels.
Although positive trends in the latter half of the year allowed us to reduce some of first quarter’s expense, our full-year expense (in addition to the reserve for one customer noted above) is higher than our historical experience. Our first quarter bad debt expense included an increased qualitative risk for macroeconomic conditions, which we believe continued to be appropriate at year end. We also monitor general macroeconomic conditions and other items that could impact the expected collectibility of all customers, or pools of customers, with similar risk. We obtain credit applications, credit reports, bank and trade references, and periodic financial statements from our customers to establish credit limits and terms as appropriate. In cases where a customer’s payment performance or financial condition begins to deteriorate or in the event of a customer bankruptcy, we tighten our credit limits and terms and make appropriate reserves based upon the facts and circumstances for each individual customer, as well as pools of customers, with similar risk.
Inventories - Our inventories increased $9 million at December 31, 2020 compared to the prior year. Our DIO also increased during 2020. Primary factors contributing to increased inventory include inventory purchases related to growing demand and increased raw material costs. Full-year increase in DIO is primarily a result of lower cost of goods sold. Although we experienced increased raw material costs and higher freight charges due to raw material shortages, volumes at the end of the first quarter and into second quarter were greatly reduced. While inventory balances and DIO fluctuated notably during 2020, the year-end balance and fourth quarter DIO both returned to more normal levels, and we took steps to carefully control inventory levels as demand improved. We believe we have established adequate reserves for any slower-moving or obsolete inventories. We continuously monitor our slower-moving and potentially obsolete inventory through reports on inventory quantities compared to usage within the previous 12 months. We also utilize cycle counting programs and complete physical counts of our inventory. When potential inventory obsolescence is indicated by these controls, we will take charges for write-downs to maintain an adequate level of reserves. Our reserve balances, as a percentage of period-end inventory, were consistent with our historical average.
50
PART II
Accounts Payable - Our accounts payable increased $89 million at December 31, 2020 compared to the prior year. Our DPO also increased during 2020. The rise was primarily related to the inventory factors discussed above and continued focus on optimizing payment terms with our vendors. Our payment terms did not change meaningfully, as we chose to keep our commitment to our vendors by paying on time during periods of reduced demand earlier in the year and did not request an extension of terms. We continue to look for ways to establish and maintain favorable payment terms through our significant purchasing power and also utilize third-party services that offer flexibility to our vendors, which in turn helps us manage our DPO as discussed below.
Accounts Receivable and Accounts Payable Programs
We have participated in trade receivables sales programs with third-party banking institutions and trade receivables sales programs that have been implemented by certain of our customers the last few years. Under each of these programs, we sell our entire interest in the trade receivable for 100% of face value, less a discount. Because control of the sold receivable is transferred to the buyer at the time of sale, accounts receivable balances sold are removed from the Consolidated Balance Sheets and the related proceeds are reported as cash provided by operating activities in the Consolidated Statements of Cash Flows. We had approximately $45 million and $40 million of trade receivables that were sold and removed from our Consolidated Balance Sheets at December 31, 2020 and 2019, respectively. These sales reduced our quarterly DSO by roughly three days, and the impact to operating cash flow was approximately $5 million and $25 million at December 31, 2020 and 2019, respectively.
For accounts payable, we have historically looked for ways to optimize payment terms through utilizing third-party programs that allow our suppliers to be paid earlier at a discount. While these programs assist us in negotiating payment terms with our suppliers, we continue to make payments based on our customary terms. A vendor can elect to take payment from a third party earlier with a discount, and in that case, we pay the third party on the original due date of the invoice. Contracts with our suppliers are negotiated independently of supplier participation in the programs, and we cannot increase payment terms pursuant to the programs. As such, there is no direct impact on our DPO, accounts payable, operating cash flows or liquidity. The accounts payable, which remain on our Consolidated Balance Sheets, settled through the third-party programs, were approximately $105 million and $55 million at December 31, 2020 and 2019, respectively. We did not request an extension of terms during the pandemic. However, we increased purchases late in the year as demand returned, which resulted in greater vendor participation by those that have historically utilized these programs, and we have also experienced greater interest by other vendors as they also strive to optimize their customer collections.
While we utilize the above items as tools in our cash flow management, and offer them as options to facilitate customer and vendor operating cycles, if there were to be a cessation of these programs, we do not expect it would materially impact our operating cash flows or liquidity.
51
PART II
Uses of Cash
Finance Capital Requirements
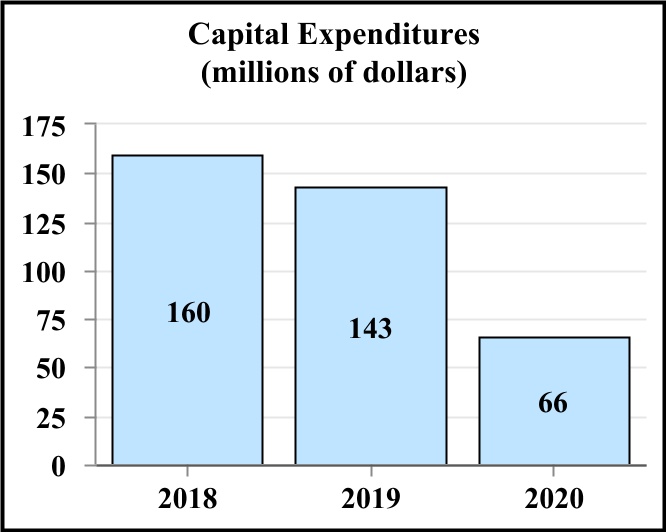
Capital expenditures-2018 $160 million, 2019 $143 million, 2020 $66 million
To carefully manage cash during the pandemic-related economic declines across most of our businesses, we reduced capital expenditures by over 50% for 2020 (to be used primarily for maintenance capital) and limited acquisition spending. We intend to make investments to support expansion in businesses and product lines where sales are profitably growing, for efficiency improvement and maintenance, and for system enhancements. We expect capital expenditures to approximate $150 million in 2021. Our employee incentive plans emphasize returns on capital, which include net fixed assets and working capital. This emphasis focuses our management on asset utilization and helps ensure that we are investing additional capital dollars where attractive return potential exists.
Our long-term, 6-9% annual revenue growth objective envisions periodic acquisitions. We are seeking strategic acquisitions, and we are looking for opportunities to enter new growth markets (carefully screened for sustainable competitive advantage). As a reminder, in connection with the acquisition of ECS our debt levels increased, and we are focused on deleveraging by, among other factors, controlling the pace of acquisition spending.
In 2018, we acquired three businesses for total consideration of $109 million. The first is Precision Hydraulic Cylinders (PHC), a leading global manufacturer of engineered hydraulic cylinders primarily for the materials handling market. The second and third are both operations in our Geo Components business: a small producer of geo components, and a manufacturer and distributor of innovative home and garden products that can be found at many major retailers.
In 2019, we acquired two businesses for total consideration of $1.27 billion. In January 2019, we acquired ECS, a leader in the production of proprietary specialized foam used primarily for the bedding and furniture industries, for total consideration of approximately $1.25 billion. In December 2019, we acquired a small manufacturer and distributor of geosynthetic fabrics, grids and erosion control products in our Geo Components business unit.
In 2020, we acquired no businesses.
Additional details about acquisitions can be found in Note R on page 125 of the Notes to Consolidated Financial Statements.
52
PART II
Pay Dividends
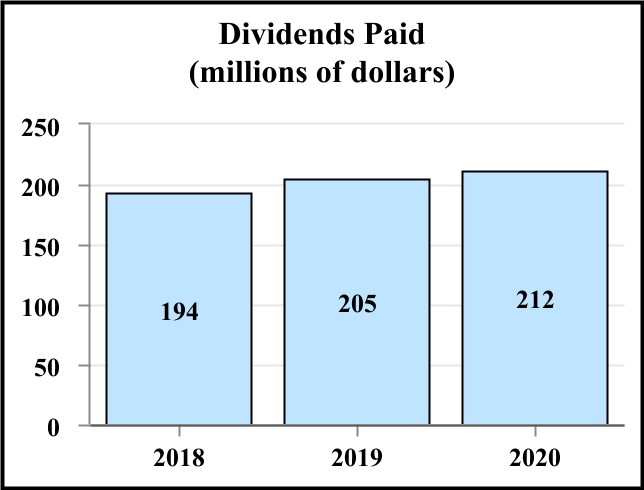
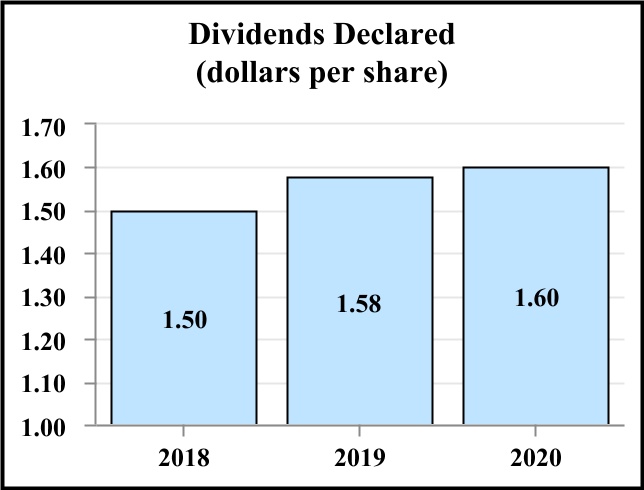
Dividends Paid-2018 $194 million, 2019 $205 million, 2020 $212 million; Dividends Declared-2018 $1.50, 2019 $1.58, 2020 $1.60
Dividends are the primary means by which we return cash to shareholders. The cash requirement for dividends in 2021 should approximate $220 million.
Our long-term targeted dividend payout ratio is approximately 50% of adjusted EPS (which excludes special items such as significant tax law impacts, impairment charges, restructuring-related charges, divestiture gains, and litigation accruals/settlements). Continuing our long track record of increasing the dividend remains a high priority. In 2020, we increased the annual dividend by $.02 from $1.58 to $1.60 per share. 2020 marked our 49th consecutive annual dividend increase, a record that only ten S&P 500 companies currently exceed. We are proud of our dividend record and plan to extend it.
Repurchase Stock
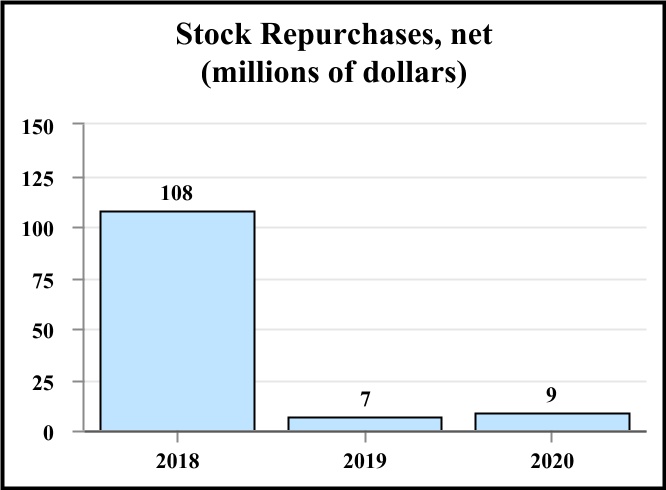
Stock , net-2018 $108 million, 2019 $7 million, 2020 $9 million
Share repurchases are the other means by which we return cash to shareholders. During the last three years, we repurchased a total of 4 million shares of our stock and issued 4 million shares (through employee benefit plans and stock option exercises). In 2020, we repurchased 240,000 shares (at an average price of $46.32) and issued 1 million shares.
Our long-term priorities for use of cash remain: fund organic growth, pay dividends, fund strategic acquisitions, and repurchase stock with available cash. With the increase in leverage from our acquisition of ECS, as previously discussed, we are prioritizing debt repayment after funding necessary expenditures and dividends, and as a result, are temporarily limiting share repurchases and acquisitions. We have been authorized by the Board to repurchase up to 10 million shares each year, but we have established no specific repurchase commitment or timetable.
53
PART II
Capitalization
This table presents key debt and capitalization statistics at the end of the three most recent years.
| (Dollar amounts in millions) | 2020 | 2019 | 2018 | ||||||||||||||
| Total debt excluding revolving credit/commercial paper | $ | 1,900.2 | $ | 2,056.1 | $ | 1,099.0 | |||||||||||
| Less: Current maturities of long-term debt | 50.9 | 51.1 | 1.2 | ||||||||||||||
| Scheduled maturities of long-term debt | 1,849.3 | 2,005.0 | 1,097.8 | ||||||||||||||
Average interest rates 1 | 3.7 | % | 3.6 | % | 3.6 | % | |||||||||||
Average maturities in years 1 | 5.3 | 6.0 | 6.7 | ||||||||||||||
Revolving credit/commercial paper 2 | — | 61.5 | 70.0 | ||||||||||||||
Weighted average interest rate on year-end balance | — | % | 2.0 | % | 2.6 | % | |||||||||||
Average interest rate during the year | 2.0 | % | 2.6 | % | 2.4 | % | |||||||||||
| Total long-term debt | 1,849.3 | 2,066.5 | 1,167.8 | ||||||||||||||
| Deferred income taxes and other liabilities | 508.4 | 509.3 | 240.9 | ||||||||||||||
| Equity | 1,390.3 | 1,312.5 | 1,157.6 | ||||||||||||||
| Total capitalization | $ | 3,748.0 | $ | 3,888.3 | $ | 2,566.3 | |||||||||||
Unused committed credit: 2 | |||||||||||||||||
| Long-term | $ | 1,200.0 | $ | 1,138.5 | $ | 730.0 | |||||||||||
| Short-term | — | — | — | ||||||||||||||
| Total unused committed credit | $ | 1,200.0 | $ | 1,138.5 | $ | 730.0 | |||||||||||
| Cash and cash equivalents | $ | 348.9 | $ | 247.6 | $ | 268.1 | |||||||||||
1 These rates include current maturities, but exclude commercial paper to reflect the averages of outstanding debt with scheduled maturities. The rates also include amortization of interest rate swaps.
2 The unused committed credit amount is based on our revolving credit facility and commercial paper program which, at the end of 2018, had $800 million of borrowing capacity. In January 2019, we expanded the size of our revolving credit facility from $800 million to $1.2 billion and correspondingly increased permitted borrowings, subject to covenant restrictions, under our commercial paper program primarily to finance the ECS transaction.
In July 2018, we retired $150 million of 4.4% notes at maturity.
In January 2019, we increased the size of our revolving credit facility from $800 million to $1.2 billion (and increased permitted borrowings, subject to covenant restrictions, under our commercial paper program in a corresponding amount), and added additional borrowing capacity in the form of the five-year term loan facility in the amount of $500 million, all primarily to finance the ECS acquisition. We pay quarterly principal installments of $12.5 million through the maturity date of January 2024. Additional principal payments, including a complete early payoff, are allowed without penalty. As of December 31, 2020, we had repaid $195 million, including prepayments on a portion of Term Loan A of $60 million in the third quarter and $48 million in the fourth quarter of 2020.
In March 2019, we issued $500 million aggregate principal amount of notes that mature in 2029. The notes bear interest at a rate of 4.4% per year, with interest payable semi-annually beginning on September 15, 2019. The net proceeds of these notes were used to repay a portion of the commercial paper indebtedness incurred to finance the ECS acquisition.
Our next large maturity is in August 2022 when $300 million of senior notes will mature.
54
PART II
Commercial Paper Program
In January 2019, we expanded the borrowing capacity under our credit facility from $800 million to $1.2 billion, extended the term to January 2024, and correspondingly increased permitted borrowings under our commercial paper program primarily to finance the ECS Acquisition. The ECS Acquisition was financed through the issuance of approximately $750 million of commercial paper (of which roughly $500 million was subsequently refinanced through the public issuance of 10-year 4.4% notes due in 2029) and the issuance of a $500 million five-year Term Loan A, with our current bank group, pursuant to which we pay principal in the amount of $12.5 million each quarter and the remaining principal at maturity. The credit facility allows us to issue letters of credit totaling up to $125 million. When we issue letters of credit under the facility, we reduce our available credit and commercial paper capacity by a corresponding amount. Amounts outstanding related to our commercial paper program were:
| (Dollar amounts in millions) | 2020 | 2019 | 2018 | ||||||||||||||
| Total program authorized | $ | 1,200.0 | $ | 1,200.0 | $ | 800.0 | |||||||||||
| Commercial paper outstanding (classified as long-term debt) | — | 61.5 | 70.0 | ||||||||||||||
| Letters of credit issued under the credit facility | — | — | — | ||||||||||||||
| Total program usage | — | 61.5 | 70.0 | ||||||||||||||
| Total program available | $ | 1,200.0 | $ | 1,138.5 | $ | 730.0 | |||||||||||
The average and maximum amounts of commercial paper outstanding during 2020 were $145 million and $422 million, respectively. During the fourth quarter, the average and maximum amounts outstanding were $49 million and $122 million, respectively. At year end, we had no letters of credit outstanding under the credit facility, but we had issued $41 million of stand-by letters of credit under other bank agreements to take advantage of better pricing. Over the long term, and subject to our capital needs, market conditions, alternative capital market opportunities, and our ability to continue to access the commercial paper market, we expect to maintain the indebtedness under the program by continuously repaying and reissuing the commercial paper notes. We view commercial paper as a source of long-term funds and when outstanding, have classified the borrowings under the commercial paper program as long-term debt on our balance sheet. We have the intent to roll over such obligations on a long-term basis and have the ability to refinance these borrowings on a long-term basis as evidenced by our $1.2 billion revolving credit facility maturing in 2024 discussed above.
With cash on hand, operating cash flow, our commercial paper program and/or our credit facility, and our ability to obtain debt financing, we believe we have sufficient funds available to repay maturing debt, as well as support our ongoing operations.
Our credit facility was amended in May 2020 and contains revised restrictive covenants. The revised covenants limit: a) as of the last day of each fiscal quarter, the leverage ratio of consolidated funded indebtedness (minus unrestricted cash) to trailing 12-month consolidated EBITDA (each as defined in the credit facility) must not exceed 4.75 to 1.00 for each fiscal quarter end date through March 31, 2021; 4.25 to 1.00 at June 30, 2021; 3.75 to 1.00 at September 30, 2021; and 3.25 to 1.00 at December 31, 2021 and thereafter; b) the amount of total secured debt to 5% of our total consolidated assets until December 31, 2021, at which time it will revert to 15% of our total consolidated assets; and c) our ability to sell, lease, transfer, or dispose of all or substantially all of our total consolidated assets. Various interest rate terms were also changed. The impact on our interest expense will depend upon our ability to access the commercial paper market, and if so, the degree of that access. The amendment also added an anti-cash hoarding provision that limits borrowing if the Company has a consolidated cash balance (as defined in the credit facility) in excess of $300 million without planned expenditures. We were comfortably in compliance with our covenants at the end of 2020, and had access to the full $1.2 billion borrowing capacity under the credit agreement. For more information about long-term debt, please see Note J on page 103 of the Notes to Consolidated Financial Statements.
55
PART II
Accessibility of Cash
At December 31, 2020, we had cash and cash equivalents of $349 million primarily invested in interest-bearing bank accounts and in bank time deposits with original maturities of three months or less. Substantially all of these funds are held in the international accounts of our foreign operations. During 2020, 2019, and 2018 we brought back $188 million, $279 million, and $314 million of foreign cash, respectively.
If we were to immediately bring back all our foreign cash to the U.S. in the form of dividends, we would pay foreign withholding taxes of approximately $20 million. Due to capital requirements in various jurisdictions, approximately $58 million of this cash was inaccessible for repatriation at year end.
CONTRACTUAL OBLIGATIONS
The following table summarizes our future contractual cash obligations and commitments at December 31, 2020:
Payments Due by Period 5 | ||||||||||||||||||||||||||||||||
| Contractual Obligations | Total | Less Than 1 Year | 1-3 Years | 3-5 Years | More Than 5 Years | |||||||||||||||||||||||||||
| (Dollar amounts in millions) | ||||||||||||||||||||||||||||||||
Long-term debt ¹ | $ | 1,896 | $ | 50 | $ | 399 | $ | 453 | $ | 994 | ||||||||||||||||||||||
| Finance leases | 4 | 1 | 2 | 1 | — | |||||||||||||||||||||||||||
| Operating leases | 180 | 47 | 72 | 38 | 23 | |||||||||||||||||||||||||||
Purchase obligations ² | 450 | 445 | 4 | 1 | — | |||||||||||||||||||||||||||
Interest payments ³ | 390 | 70 | 123 | 90 | 107 | |||||||||||||||||||||||||||
| Deferred income taxes | 194 | — | — | — | 194 | |||||||||||||||||||||||||||
Other obligations (including pensions and net reserves for tax contingencies) 4 | 196 | 4 | 31 | 32 | 129 | |||||||||||||||||||||||||||
| Total contractual cash obligations | $ | 3,310 | $ | 617 | $ | 631 | $ | 615 | $ | 1,447 | ||||||||||||||||||||||
1The long-term debt payment schedule presented above could be accelerated if we were not able to make the principal and interest payments when due. We are focused on deleveraging by temporarily limiting share repurchases, controlling the pace of acquisition spending, and using operating cash flow to repay debt.
2Purchase obligations primarily include open short-term (30-120 days) purchase orders that arise in the normal course of operating our facilities.
3Interest payments assume debt outstanding remains constant with amounts at December 31, 2020 and at rates in effect at the end of the year.
4Other obligations include our net reserves for tax contingencies in the "More Than 5 Years" column, because these obligations are long-term in nature and actual payment dates cannot be specifically determined. Other obligations also include a $32 million long-term deemed repatriation tax payable and our current estimate of $4 million for minimum contributions to defined benefit pension plans.
5Less Than 1 Year (due in 2021), 1-3 Years (due in 2022 and 2023), 3-5 Years (due in 2024 and 2025), and More Than 5 Years (due in 2026 and beyond).
56
PART II
CRITICAL ACCOUNTING POLICIES AND ESTIMATES
We prepare our consolidated financial statements in accordance with accounting principles generally accepted in the United States of America. To do so, we must make estimates and judgments that affect the reported amounts of assets, liabilities, revenues, expenses, and disclosures. If we used different estimates or judgments our financial statements would change, and some of those changes could be significant. Our estimates are frequently based upon historical experience and are considered by management, at the time they are made, to be reasonable and appropriate. Estimates are adjusted for actual events, as they occur.
“Critical accounting estimates” are those that are: (a) subject to uncertainty and change, and (b) of material impact to our financial statements. Listed below are the estimates and judgments, which we believe could have the most significant effect on our financial statements.
We provide additional details regarding our significant accounting policies in Note A on page 82 of the Notes to Consolidated Financial Statements.
| Description | Judgments and Uncertainties | Effect if Actual Results Differ From Assumptions | ||||||||||||
| Goodwill | ||||||||||||||
Goodwill is assessed for impairment annually as of June 30 and as triggering events occur. | Goodwill is evaluated annually for impairment as of June 30 using a quantitative analysis at the reporting unit level, which is one level below our operating segments. Judgment is required in the quantitative analysis. We estimate fair value using a combination of: (a) A discounted cash flow model that contains uncertainties related to the forecast of future results, as many outside economic and competitive factors can influence future performance. Revenue growth, cost of sales, and appropriate discount rates are the most critical estimates in determining enterprise values using the cash flow model. (b) The market approach, using price to earnings ratios for comparable publicly traded companies that operate in the same or similar industry and with characteristics similar to the reporting unit. Judgment is required to determine the appropriate price to earnings ratio. | The June 2020 review resulted in a non-cash goodwill impairment charge of $25 million with respect to our Hydraulic Cylinders reporting unit, which is part of the Specialized Products segment. This impairment charge reflects the complete write-off of the goodwill associated with the Hydraulic Cylinders reporting unit. Three other reporting units had fair values in excess of carrying value of less than 100% as discussed in Note C on page 90 of the Notes to Consolidated Financial Statements. At December 31, 2020, we had $1.4 billion of goodwill. We had no goodwill impairments in 2019 or 2018. Information regarding material assumptions used to determine if a goodwill impairment exists can be found in Note A on page 82 and Note C on page 90 of the Notes to Consolidated Financial Statements. We conduct impairment testing based on our current business strategy in light of present industry and economic conditions, as well as future expectations. If we are not able to achieve projected performance levels, future impairments could be possible. | ||||||||||||
57
| Description | Judgments and Uncertainties | Effect if Actual Results Differ From Assumptions | ||||||||||||
| Other Long-Lived Assets | ||||||||||||||
| Other long-lived assets are tested for recoverability at year end and whenever events or circumstances indicate the carrying value may not be recoverable. For other long-lived assets we estimate fair value at the lowest level where cash flows can be measured (usually at a branch level). | Impairments of other long-lived assets usually occur when major restructuring activities take place, or we decide to discontinue selected products. Our impairment assessments have uncertainties because they require estimates of future cash flows to determine if undiscounted cash flows are sufficient to recover carrying values of these assets. For assets where future cash flows are not expected to recover carrying value, fair value is estimated which requires an estimate of market value based upon asset appraisals for like assets. | These impairments are unpredictable. Impairments did not exceed $8 million per year in any of the last three years. At December 31, 2020, net property, plant and equipment was $785 million, net intangible assets, other than goodwill, was $702 million, and operating right-of-use assets was $162 million. | ||||||||||||
| Inventory Reserves | ||||||||||||||
We reduce the carrying value of inventories to reflect an estimate of net realizable value for slow-moving (i.e., not selling very quickly) and obsolete inventory. Generally, a reserve is required when we have more than a 12-month supply of the product. The calculation also uses an estimate of the ultimate recoverability of items identified as slow-moving, based upon historical experience. If we have had no sales of a given product for 12 months, those items are generally deemed to be obsolete with no value and are written down completely. Finally, costs for approximately 30%-40% of our inventories (consisting primarily of our domestic steel-related inventories) are determined using the last-in, first-out (LIFO) method, which produces a cost that is lower than net realizable value (see Note A on page 82 of the Notes to Consolidated Financial Statements.) | Our inventory reserve contains uncertainties because the calculation requires management to make assumptions about the value of products that are obsolete or slow-moving. Changes in customer behavior and requirements can cause inventory to become obsolete or slow-moving. Restructuring activity and decisions to narrow product offerings also impact the estimated net realizable value of inventories. | At December 31, 2020, the reserve for obsolete and slow-moving inventory was $31 million (approximately 5% of inventories). This is consistent with the reserves at December 31, 2019 and 2018, representing approximately 4% of inventories. Additions to inventory reserves in 2020 were $12 million, which was slightly higher than our $10 million three-year average. Our reserve balances as a percentage of period-end inventory have remained consistent, and we do not expect significant changes to our historical obsolescence levels. | ||||||||||||
58
PART II
| Description | Judgments and Uncertainties | Effect if Actual Results Differ From Assumptions | ||||||||||||
| Credit Losses | ||||||||||||||
For accounts and notes receivable, we estimate a bad debt reserve for the amount that will ultimately be uncollectible. When we become aware of a specific customer’s potential inability to pay, we record a bad debt reserve for the amount we believe may not be collectible. We also monitor general macroeconomic conditions and other items that could impact the expected collectibility of all customers or pools of customers with similar risk. As discussed in Note H on page 99 of the Notes to Consolidated Financial Statements, we adopted ASU 2016-13 "Financial Instruments—Credit Losses" (Topic 326) in 2020, which amended the impairment model to require a forward-looking approach based on expected losses, rather than incurred losses, to estimate credit losses on certain types of financial instruments, including trade receivables. | Our bad debt reserve contains uncertainties because it requires management to estimate the amount uncollectible based upon an evaluation of several factors such as the length of time that receivables are past due, the financial health of the customer, industry and macroeconomic considerations, and historical loss experience. Our customers are diverse and many are small-to-medium sized companies, with some being highly leveraged. Bankruptcy can occur with some of these customers relatively quickly and with little warning. In cases where a customer’s payment performance or financial condition begins to deteriorate, we tighten our credit limits and terms and make appropriate reserves when deemed necessary. Certain of our customers have from time to time experienced bankruptcy, insolvency, and/or an inability to pay their debts to us as they come due. If our customers suffer significant financial difficulty, they may be unable to pay their debts to us timely or at all, they may reject their contractual obligations to us under bankruptcy laws or otherwise, or we may have to negotiate significant discounts and/or extend financing terms with these customers. | A significant change in the financial status of a large customer could impact our estimates. However, we believe we have established adequate reserves on our customer accounts. Our bad debt expense has fluctuated over the last three years: $17 million in 2020, $3 million in 2019, and $17 million in 2018. The expense for 2020 and 2018 was impacted by one account that is now fully reserved at $25 million, including $23 million of a note receivable and $2 million for a trade account receivable ($9 million in 2020 and $16 million in 2018), as discussed in Note H on page 99 of the Notes to Consolidated Financial Statements. 2020's expense was also impacted by pandemic-related economic declines. Although we have not experienced significant issues with customer payment performance during this time, the effects of the pandemic have adversely impacted the operations of many of our customers, which have and could further impact their ability to pay their debts to us. As a result, we increased the reserves on trade accounts receivable to reflect this increased risk. Excluding the note receivable discussed above, the average annual amount of bad debt expense associated with trade accounts receivable was less than $5 million (significantly less than 1% of annual net trade sales) over the last three years. At December 31, 2020, our allowances for doubtful trade accounts receivable were $19 million (less than 4% of our trade receivables of $555 million). | ||||||||||||
59
| Description | Judgments and Uncertainties | Effect if Actual Results Differ From Assumptions | ||||||||||||
| Workers’ Compensation | ||||||||||||||
| We are substantially self-insured for costs related to workers’ compensation, and this requires us to estimate the liability associated with this obligation. | Our estimates of self-insured reserves contain uncertainties regarding the potential amounts we might have to pay. We consider a number of factors, including historical claim experience, demographic factors, and potential recoveries from third party insurance carriers. | Over the past five years, we have incurred, on average, $9 million annually for costs associated with workers’ compensation. Average year-to-year variation over the past five years has been approximately $1 million. At December 31, 2020, we had accrued $32 million to cover future self-insurance liabilities. | ||||||||||||
| Pension Accounting | ||||||||||||||
| For our pension plans, we must estimate the cost of benefits to be provided (well into the future) and the current value of those benefit obligations. | The pension liability calculation contains uncertainties because it requires management's judgment. Assumptions used to measure our pension liabilities and pension expense annually include: - the discount rate used to calculate the present value of future benefits - an estimate of expected return on pension assets based upon the mix of investments held (bonds and equities) - certain employee-related factors, such as turnover, retirement age, and mortality. Mortality assumptions represent our best estimate of the duration of future benefit payments at the measurement date. These estimates are based on each plan's demographics and other relevant facts and circumstances - the rate of salary increases where benefits are based on earnings. | Each 25 basis point decrease in the discount rate increases pension expense by $.6 million and increases the plans’ benefit obligations by $9.8 million. Each 25 basis point reduction in the expected return on assets would increase pension expense by $.4 million, but have no effect on the plans’ funded status. | ||||||||||||
| Contingencies | ||||||||||||||
| We evaluate various legal, environmental, and other potential claims against us to determine if an accrual or disclosure of the contingency is appropriate. If it is probable that an ultimate loss will be incurred and reasonably estimable, we accrue a liability for the estimate of the loss. | Our disclosure and accrual of loss contingencies (i.e., losses that may or may not occur) contain uncertainties because they are based on our assessment of the probability that the expenses will actually occur and our reasonable estimate of the likely cost. Our estimates and judgments are subjective and can involve matters in litigation, the results of which are generally unpredictable. | Legal contingencies are related to numerous lawsuits and claims described in Note T on page 130 of the Notes to Consolidated Financial Statements. During the three-year period ended December 31, 2020, we recorded expense of $3 million. | ||||||||||||
60
PART II
| Description | Judgments and Uncertainties | Effect if Actual Results Differ From Assumptions | ||||||||||||
| Income Taxes | ||||||||||||||
| In the ordinary course of business, we must make estimates of the tax treatment of many transactions, even though the ultimate tax outcome may remain uncertain for some time. These estimates become part of the annual income tax expense reported in our financial statements. Subsequent to year end, we finalize our tax analysis and file income tax returns. Tax authorities periodically audit these income tax returns and examine our tax filing positions, including (among other things) the timing and amounts of deductions, and the allocation of income among tax jurisdictions. If necessary, we adjust income tax expense in our financial statements in the periods in which the actual outcome becomes more certain. | Our tax liability for unrecognized tax benefits contains uncertainties because management is required to make assumptions and to apply judgment to estimate the exposures related to our various filing positions. Our effective tax rate is also impacted by changes in tax laws, the current mix of earnings by taxing jurisdiction, and the results of current tax audits and assessments. At December 31, 2020 and 2019, we had $14 million and $15 million, respectively, of net deferred tax assets on our balance sheet, primarily related to net operating losses and other tax carryforwards. The ultimate realization of these deferred tax assets is dependent upon the amount, source, and timing of future taxable income. In cases where we believe it is more likely than not that we may not realize the future potential tax benefits, we establish a valuation allowance against them. | Changes in U.S. and foreign tax laws could impact assumptions related to the taxation and repatriation of certain foreign earnings. Audits by various taxing authorities continue as governments look for ways to raise additional revenue. Based upon past audit experience, we do not expect any material changes to our tax liability as a result of this audit activity; however, we could incur additional tax expense if we have audit adjustments higher than recent historical experience. The likelihood of recovery of net operating losses and other tax carryforwards has been closely evaluated and is based upon such factors as the time remaining before expiration, viable tax planning strategies, and future taxable earnings expectations. We believe that appropriate valuation allowances have been recorded as necessary. However, if earnings expectations or other assumptions change such that additional valuation allowances are required, we could incur additional tax expense. Likewise, if fewer valuation allowances are needed, we could incur reduced tax expense. | ||||||||||||
61
| Description | Judgments and Uncertainties | Effect if Actual Results Differ From Assumptions | ||||||||||||
| Acquisitions | ||||||||||||||
| When acquisitions occur, we value the assets acquired, liabilities assumed, and any noncontrolling interest in acquired companies at estimated acquisition date fair values. Goodwill is measured as the excess amount of consideration transferred, compared to fair value of the assets acquired and the liabilities assumed. Our estimates of fair value are based upon assumptions believed to be reasonable but which are inherently uncertain. | The purchase price allocation for business acquisitions contains uncertainties because it requires management's judgment. Determining fair value of identifiable assets, particularly intangibles, requires management to make estimates, which are based on all available information. Critical estimates include the timing and amount of future revenues and expenses associated with an asset, as well as an appropriate discount rate. Determining fair values for these items requires significant judgment and includes a variety of methods and models that utilize significant Level 3 inputs, as discussed in Note A on page 82 of the Notes to Consolidated Financial Statements. | In 2020, no businesses were acquired, as discussed in Note R on page 125 of the Notes to Consolidated Financial Statements. The judgments made in determining the estimated fair value assigned to the assets acquired, as well as the estimated life of the assets, can materially impact net income in periods subsequent to the acquisition through depreciation and amortization, and in certain instances through impairment charges, if the asset becomes impaired in the future. We regularly review for impairments. Unanticipated events and circumstances may occur which may affect the accuracy or validity of such assumptions, estimates, or actual results. | ||||||||||||
62
PART II
CONTINGENCIES
For contingencies related to the impact of the COVID-19 pandemic on our business, please see “COVID-19 Impacts on our Business” on page 35.
Litigation
Accruals for Probable Losses
We are exposed to litigation contingencies that, if realized, could have a material negative impact on our financial condition, results of operations, and cash flows. Although we deny liability in all currently threatened or pending litigation proceedings in which we are or may be a party, and believe we have valid bases to contest all claims made against us, we have recorded a litigation contingency accrual for our reasonable estimate of probable loss for pending and threatened litigation proceedings, in aggregate, in millions, as follows:
| Year Ended December 31 | |||||||||||||||||
| 2020 | 2019 | 2018 | |||||||||||||||
| Litigation contingency accrual - Beginning of period | $ | .7 | $ | 1.9 | $ | .4 | |||||||||||
| Adjustment to accruals - expense | .1 | .6 | 1.8 | ||||||||||||||
| Currency | (.1) | — | — | ||||||||||||||
| Cash payments | (.2) | (1.8) | (.3) | ||||||||||||||
| Litigation contingency accrual - End of period | $ | .5 | $ | .7 | $ | 1.9 | |||||||||||
The above litigation contingency accruals do not include accrued expenses related to workers' compensation, vehicle-related personal injury, product and general liability claims, taxation issues, and environmental matters, some of which may contain a portion of litigation expense. However, any litigation expense associated with these categories is not anticipated to have a material effect on our financial condition, results of operations, or cash flows. For more information regarding accrued expenses, see Note I under "Accrued expenses" on page 102 of the Notes to Consolidated Financial Statements.
Reasonably Possible Losses in Excess of Accruals
Although there are a number of uncertainties and potential outcomes associated with all of our pending or threatened litigation proceedings, we believe, based on current known facts, that additional losses, if any, are not expected to materially affect our consolidated financial position, results of operations, or cash flows. However, based upon current known facts, as of December 31, 2020, aggregate reasonably possible (but not probable, and therefore not accrued) losses in excess of the accruals noted above are estimated to be $12 million, including $11 million for Brazilian value-added tax matters and $1 million for other matters. If our assumptions or analyses regarding these contingencies are incorrect, or if facts change, we could realize losses in excess of the recorded accruals (and in excess of the $12 million referenced above), which could have a material negative impact on our financial condition, results of operations, and cash flows.
For more information regarding litigation contingencies, please refer to Note T on page 130 of the Notes to Consolidated Financial Statements, which is incorporated herein by reference.
Aerospace and Work Furniture Reporting Units' Goodwill
Fair value for our Aerospace and Work Furniture reporting units exceeded carrying value by 51% and 25%, respectively, at our June 30, 2020 annual goodwill impairment testing date.
Sales for both of these units were adversely impacted by the COVID-19 pandemic. If there is a prolonged adverse economic impact, or otherwise, we may not be able to achieve projected performance levels. Although we do not believe that a triggering event has occurred, internal forecasts and industry data suggest that economic impacts of COVID-19 for the aerospace industry may be longer than previously expected during the second quarter impairment testing. We are continuing to monitor all factors impacting this industry.
63
The goodwill associated with the Aerospace and Work Furniture reporting units was $59 million and $97 million, respectively, at December 31, 2020.
Continued negative market trends may impact future earnings. If we are not able to achieve projected performance levels, future impairments may be possible.
Potential Sale of Real Estate
Although the potential sale is subject to significant conditions that may change the timing, the amount, and whether the sale is completed at all, we have agreed to sell certain real estate associated with prior years' restructuring activities in the Bedding Products segment. If the sale is completed, we expect to realize a gain of up to $25 million to $30 million on this transaction in 2021.
Cybersecurity Risks
We rely on information systems to obtain, process, analyze, and manage data, as well as to facilitate the manufacture and distribution of inventory to and from our facilities. We receive, process, and ship orders, manage the billing of and collections from our customers, and manage the accounting for and payment to our vendors. We have a formal process in place for both incident response and cybersecurity continuous improvement that includes a cross-functional Cybersecurity Oversight Committee. Members of the Cybersecurity Oversight Committee update the Board quarterly on cyber activity, with procedures in place for interim reporting if necessary.
Although we have not experienced any material cybersecurity incidents, we have enhanced our cybersecurity protection efforts over the last few years. We use a third party to periodically benchmark our information security program against the National Institute of Standards and Technology’s Cybersecurity Framework. We provide quarterly cybersecurity training for employees with access to our email and data systems, and we have purchased broad form cyber insurance coverage. However, because of risk due to the COVID-19 pandemic regarding increased remote access, remote work conditions, and associated strain on employees, technology failures or cybersecurity breaches could still create system disruptions or unauthorized disclosure of confidential information. We cannot be certain that the attacker’s capabilities will not compromise our technology protecting information systems. If these systems are interrupted or damaged by any incident or fail for any extended period of time, then our results of operations could be adversely affected. We may incur remediation costs, increased cybersecurity protection costs, lost revenues resulting from unauthorized use of proprietary information, litigation and legal costs, reputational damage, damage to our competitiveness, and negative impact on stock price and long-term shareholder value.
NEW ACCOUNTING STANDARDS
The FASB has issued accounting guidance effective for current and future periods. See Note A on page 82 of the Notes to Consolidated Financial Statements for a more complete discussion.
64
PART II
Item 7A. Quantitative and Qualitative Disclosures About Market Risk.
(Unaudited)
(Dollar amounts in millions)
Interest Rates
The table below provides information about the Company’s debt obligations sensitive to changes in interest rates. Substantially all of the debt shown in the table below is denominated in United States dollars. The fair value of fixed rate debt was approximately $170 million greater than carrying value at December 31, 2020 and approximately $100 million greater than carrying value at December 31, 2019. The fair value of the fixed rate debt was based on quoted prices in an active market. The fair value of variable rate debt is not significantly different from its recorded amount.
| Long-term debt as of December 31, | Scheduled Maturity Date | ||||||||||||||||||||||||||||||||||||||||||||||
| 2021 | 2022 | 2023 | 2024 | 2025 | Thereafter | 2020 | 2019 | ||||||||||||||||||||||||||||||||||||||||
| Principal fixed rate debt | $ | — | $ | 300.0 | $ | — | $ | 300.0 | $ | — | $ | 1,000.0 | $ | 1,600.0 | $ | 1,600.0 | |||||||||||||||||||||||||||||||
| Average stated interest rate | — | 3.40 | % | — | 3.80 | % | — | 3.95 | % | 3.82 | % | 3.82 | % | ||||||||||||||||||||||||||||||||||
Principal variable rate debt 1 | 50.0 | 50.0 | 50.0 | 155.0 | — | 3.8 | 308.8 | 466.3 | |||||||||||||||||||||||||||||||||||||||
| Unamortized discounts and deferred loan costs | (12.7) | (14.9) | |||||||||||||||||||||||||||||||||||||||||||||
Commercial Paper 2 | — | 61.5 | |||||||||||||||||||||||||||||||||||||||||||||
| Miscellaneous debt, primarily finance leases | 4.1 | 4.7 | |||||||||||||||||||||||||||||||||||||||||||||
| Total debt | 1,900.2 | 2,117.6 | |||||||||||||||||||||||||||||||||||||||||||||
| Less: current maturities | 50.9 | 51.1 | |||||||||||||||||||||||||||||||||||||||||||||
| Total long-term debt | $ | 1,849.3 | $ | 2,066.5 | |||||||||||||||||||||||||||||||||||||||||||
1In January 2019, we issued a $500 million five-year Term Loan A with our current bank group. We pay quarterly principal installments of $12.5 million through the maturity date of January 2024, at which time we will pay the remaining principal. Additional principal payments, including a complete early payoff, are allowed without penalty. As of December 31, 2020, we had repaid $195 million, including prepayments on a portion of Term Loan A of $60 million in the third quarter and $48 million in the fourth quarter of 2020. The Term Loan A bears a variable interest rate as defined in the agreement and was 3.0% at December 31, 2020. Interest is payable based upon a time interval that depends on the selection of interest rate period.
2The weighted average interest rate for the average commercial paper outstanding during the years ended December 31, 2020 and 2019 was 2.0% and 2.6%, respectively. In January 2019, we increased the size of the revolving facility from $800 million to $1.2 billion, added a five-year $500 million term loan facility, and extended the term from 2022 to 2024.
Derivative Financial Instruments
The Company is subject to market and financial risks related to interest rates and foreign currency. In the normal course of business, the Company utilizes derivative instruments (individually or in combinations) to reduce or eliminate these risks. The Company seeks to use derivative contracts that qualify for hedge accounting treatment; however, some instruments may not qualify for hedge accounting treatment. It is the Company’s policy not to speculate using derivative instruments. Information regarding cash flow hedges and fair value hedges is provided in Note S beginning on page 127 of the Notes to Consolidated Financial Statements and is incorporated by reference into this section.
65
Investment in Foreign Subsidiaries
We view our investment in foreign subsidiaries as a long-term commitment. This investment may take the form of either permanent capital or notes. Our net investment (i.e., total assets less total liabilities subject to translation exposure) in foreign operations with functional currencies other than the U.S. dollar at December 31 is as follows:
| Functional Currency (amounts in millions) | 2020 | 2019 | ||||||||||||
| European Currencies | $ | 382.1 | $ | 348.6 | ||||||||||
| Chinese Renminbi | 260.9 | 273.8 | ||||||||||||
| Canadian Dollar | 210.5 | 254.4 | ||||||||||||
| Mexican Peso | 38.6 | 36.3 | ||||||||||||
| Other | 59.9 | 66.1 | ||||||||||||
| Total | $ | 952.0 | $ | 979.2 | ||||||||||
Item 8. Financial Statements and Supplementary Data.
The Consolidated Financial Statements and Notes, Financial Statement Schedule and supplementary financial information included in this Report are listed and included in Item 15 on page 72, and are incorporated by reference into this item.
Item 9. Changes in and Disagreements With Accountants on Accounting and Financial Disclosure.
None.
Item 9A. Controls and Procedures.
Effectiveness of the Company’s Disclosure Controls and Procedures
An evaluation as of December 31, 2020, was carried out by the Company’s management, with the participation of the Company’s Chief Executive Officer and Chief Financial Officer, of the effectiveness of the Company’s disclosure controls and procedures (as defined in Rule 13a-15(e) under the Securities Exchange Act of 1934, as amended (the “Exchange Act”)). Based upon this evaluation, the Chief Executive Officer and Chief Financial Officer have concluded the Company’s disclosure controls and procedures were effective, as of December 31, 2020, to provide assurance that information required to be disclosed by the Company in the reports that it files or submits under the Exchange Act is recorded, processed, summarized, and reported within the time periods specified by the Securities and Exchange Commission’s rules and forms. Disclosure controls and procedures include, without limitation, controls and procedures designed to ensure that information required to be disclosed by the Company in the reports that it files or submits under the Exchange Act is accumulated and communicated to the Company’s management, including its Chief Executive Officer and Chief Financial Officer, or persons performing similar functions, as appropriate to allow timely decisions regarding required disclosure.
Management’s Annual Report on Internal Control over Financial Reporting and Auditor’s Attestation Report
Management’s Annual Report on Internal Control over Financial Reporting can be found on page 73, and the Report of Independent Registered Public Accounting Firm regarding the effectiveness of the Company’s internal control over financial reporting can be found on page 74 of this Form 10-K. Each is incorporated by reference into this Item 9A.
66
PART II
Changes in the Company’s Internal Control Over Financial Reporting
There were no changes during the quarter ended December 31, 2020 that have materially affected, or are reasonably likely to materially affect, our internal control over financial reporting.
Item 9B. Other Information.
None.
67
PART III
PART III
Item 10. Directors, Executive Officers and Corporate Governance.
The subsections titled “Proposal 1—Election of Directors,” “Board and Committee Composition and Meetings,” “Consideration of Director Nominees and Diversity,” “Delinquent Section 16(a) Reports”, and “Director Independence”, as well as the introductory paragraph under the “Corporate Governance and Board Matters” section in the Company’s definitive Proxy Statement for the Company’s Annual Meeting of Shareholders to be held on May 25, 2021, are incorporated by reference.
Directors of the Company
Directors are normally elected annually at the Annual Meeting of Shareholders and hold office until the next annual meeting of shareholders or until their successors are elected and qualified. All current directors have been nominated for re-election at the Company’s Annual Meeting of Shareholders to be held May 25, 2021.
In order to be nominated for election as a director, a nominee must submit a contingent resignation to the Nominating & Corporate Governance Committee (N&CG Committee). The resignation will become effective only if (i) the director nominee fails to receive an affirmative majority of the votes cast in the director election; and (ii) the Board accepts the resignation. If a nominee fails to receive an affirmative majority of the votes cast in the director election, the N&CG Committee will make a recommendation to the Board of Directors whether to accept or reject the director’s resignation and whether any other action should be taken. If a director’s resignation is not accepted, that director will continue to serve until the Company’s next annual meeting or until his or her successor is duly elected and qualified. If the Board accepts the director’s resignation, it may, in its sole discretion, either fill the resulting vacancy or decrease the size of the Board to eliminate the vacancy.
Brief biographies of the Company’s Board of Directors are provided below.
Mark A. Blinn, age 59, was President and Chief Executive Officer and a director of Flowserve Corporation, a leading provider of fluid motion and control products and services for the global infrastructure markets, from 2009 until his retirement in 2017. He previously served Flowserve as Chief Financial Officer from 2004 to 2009 and in the additional role of Head of Latin America from 2007 to 2009. Prior to Flowserve, Mr. Blinn's positions included Chief Financial Officer of FedEx Kinko's Office and Print Services Inc. and Vice President, Corporate Controller and Chief Accounting Officer of Centex Corporation. Mr. Blinn holds a bachelor's degree, a law degree, and an MBA from Southern Methodist University. Mr. Blinn currently serves as a director of Texas Instruments, Incorporated, a global semiconductor design and manufacturing company, Kraton Corporation, a leading global producer of polymers for a wide range of applications, and Emerson Electric Co., a global technology and engineering company for industrial, commercial and residential markets. As the former CEO and CFO of Flowserve, Mr. Blinn has exceptional leadership experience in operations and finance, as well as strategic planning and risk management. His board service at other global, public companies provides additional perspective on current finance, oversight, and governance matters. He was first elected as a director of the Company in 2019.
Robert E. Brunner, age 63, was the Executive Vice President of Illinois Tool Works (ITW), a Fortune 250 global, multi-industrial manufacturer of advanced industrial technology, from 2006 until his retirement in 2012. He previously served ITW as President—Global Auto beginning in 2005 and President—North American Auto from 2003. Mr. Brunner holds a degree in finance from the University of Illinois and an MBA from Baldwin-Wallace University. Mr. Brunner currently serves as the independent Board Chair of Lindsay Corporation, a global manufacturer of irrigation equipment and road safety products, and as a director of NN Inc., a diversified industrial company that designs and manufactures high-precision components and assemblies on a global basis. Mr. Brunner’s experience and leadership with ITW, a diversified manufacturer with a global footprint, provides valuable insight to our Board on the automotive strategy, business development, mergers and acquisitions, operations, and international issues. He was first elected as a director of the Company in 2009.
Mary Campbell, age 53, was appointed Chief Merchandising Officer of Qurate Retail Group and Chief Commerce Officer of QVC US, in 2018. Qurate Retail Group is comprised of a select group of retail brands including QVC, HSN®, Zulily®, Ballard Designs®, Frontgate®, Garnet Hill®, and Grandin Road® and is a leader in video commerce, a top-10
68
PART III
ecommerce retailer, and a leader in mobile and social commerce. During her more than 20 years with the company, Ms. Campbell has held various leadership positions across the Merchandising, Planning and Commerce Platforms functions. Most recently, and prior to her current position, she served Qurate Retail Group as Chief Merchandising and Interactive Officer in 2018 and as Chief Interactive Experience Officer from 2017 to 2018. She also served as Executive Vice President, Commerce Platforms for QVC from 2014 to 2017. Ms. Campbell holds a bachelor's degree in psychology from Central Connecticut State University. Through her positions at Qurate Retail Group and QVC, Ms. Campbell has extensive knowledge in consumer driven product innovation, marketing and brand building, and traditional and new media platforms, as well as leading teams for long term growth and evolution. She was first elected as a director of the Company in 2019.
J. Mitchell Dolloff, age 55, was appointed the Company’s President and Chief Operating Officer, President—Bedding Products effective January 1, 2020. He previously served the Company as Executive Vice President—Chief Operating Officer in 2019; President—Specialized Products and Furniture Products from 2017 to 2019; Senior Vice President and President of Specialized Products from 2016 to 2017; Vice President and President of the Automotive Group from 2014 to 2015; President of Automotive Asia from 2011 to 2013; Vice President of Specialized Products from 2009 to 2013; and in various other capacities for the Company since 2000. Mr. Dolloff holds a degree in economics from Westminster College (Fulton, Missouri), as well as a law degree and an MBA from Vanderbilt University. As the Company’s President and Chief Operating Officer, Mr. Dolloff provides in-depth global operational knowledge to the Board and will complement the Board’s oversight and strategy roles as those plans are implemented throughout the Company. He was first elected as a director of the Company effective January 1, 2020.
Manuel A. Fernandez, age 74, co-founded SI Ventures, a venture capital firm focusing on IT and communications infrastructure, and has served as the managing director since 2000. Previously, he served as the Chairman, President and Chief Executive Officer at Gartner, Inc., a research and advisory company, from 1989 to 2000. Prior to Gartner, Mr. Fernandez was President and CEO of three technology-driven companies, including Dataquest, an information services company, Gavilan Computer Corporation, a laptop computer manufacturer, and Zilog Incorporated, a semiconductor manufacturer. Mr. Fernandez was the Executive Chairman of Sysco Corporation, a marketer and distributor of foodservice products, from 2012 until his retirement in 2013, having previously served as Non-executive Chairman since 2009 and as a director since 2006. Mr. Fernandez holds a degree in electrical engineering from the University of Florida and completed post-graduate work in solid-state engineering at the University of Florida. Mr. Fernandez currently serves as the lead independent director of Performance Food Group Company, a foodservice products distributor. He was previously the non-executive chairman of Brunswick Corporation, a market leader in the marine industry, and as a director of Time, Inc., a global media company. Mr. Fernandez’ venture capital experience, leadership of several technology companies as CEO and service on a number of public company boards offers Leggett outstanding insight into corporate strategy and development, information technology, international growth, and corporate governance. He was first elected as a director of the Company in 2014.
Karl G. Glassman, age 62, was appointed Chairman of the Board effective January 1, 2020 and continues to serve as Chief Executive Officer since his appointment in 2016. He previously served as President from 2013 to 2019, Chief Operating Officer from 2006 to 2015, Executive Vice President from 2002 to 2013, President of the former Residential Furnishings segment from 1999 to 2006, Senior Vice President from 1999 to 2002, and in various capacities since 1982. Mr. Glassman holds a degree in business management and finance from California State University-Long Beach. He previously served as a director of Remy International, Inc., a leading global manufacturer of alternators, starter motors and electric traction motors. As the Company’s CEO, Mr. Glassman provides comprehensive insight to the Board from strategic planning to implementation at all levels of the Company around the world, as well as the Company’s relationships with investors, the financial community and other key stakeholders. Mr. Glassman also serves on the Board of Directors of the National Association of Manufacturers. He was first elected as a director of the Company in 2002.
Joseph W. McClanathan, age 68, served as President and Chief Executive Officer of the Household Products Division of Energizer Holdings, Inc., a manufacturer of portable power solutions, from 2007 through his retirement in 2012. Previously, he served Energizer as President and Chief Executive Officer of the Energizer Battery Division from 2004 to 2007, as President—North America from 2002 to 2004, and as Vice President—North America from 2000 to 2002. Mr. McClanathan holds a degree in management from Arizona State University. He currently serves as a director of Brunswick Corporation, a market leader in the marine industry. Through his leadership experience at Energizer and as a former director of the Retail Industry Leaders Association, Mr. McClanathan offers an exceptional perspective to the Board on manufacturing operations, marketing and development of international capabilities. He was first elected as a director of the Company in 2005.
69
PART III
Judy C. Odom, age 68, served until her retirement in 2002, as Chief Executive Officer and Board Chair at Software Spectrum, Inc., a global business to business software services company, which she co-founded in 1983. Prior to founding Software Spectrum, she was a partner with the international accounting firm, Grant Thornton. Ms. Odom is a licensed Certified Public Accountant and holds a degree in business administration from Texas Tech University. Ms. Odom is a director of Sabre, Inc., which provides technology solutions for the global travel and tourism industry, and she was previously a director of Harte-Hanks, a direct marketing service company. Ms. Odom’s director experience with several companies offers a broad leadership perspective on strategic and operating issues. Her experience co-founding Software Spectrum and growing it to a global Fortune 1000 enterprise before selling it to another public company provides the insight of a long-serving CEO with international operating experience. Ms. Odom was first elected as a director of the Company in 2002.
Srikanth Padmanabhan, age 56, has served Cummins Inc., a global manufacturer of engines and power solutions, as a Vice President since 2008 and President of its Engine Business segment since 2016. Previously, he served Cummins as Vice President—Engine Business from 2014 to 2016, Vice President and General Manager of Emission Solutions from 2008 to 2014, and in various other capacities since 1991. Mr. Padmanabhan holds a bachelor's degree in mechanical engineering from the National Institute of Technology in Trichy, India, a Ph.D. in mechanical engineering from Iowa State University, and has completed the Advanced Management Program at Harvard Business School. With nearly 30 years at Cummins in a variety of leadership roles, Mr. Padmanabhan offers considerable knowledge of the automotive industry and the industrial sector. He brings extensive experience in managing operations, technology and innovation across a multi-billion-dollar global business. He has lived and worked in India, the United States, Mexico, and the United Kingdom. He was first elected as a director of the Company in 2018.
Jai Shah, age 54, serves as a Group President of Masco Corporation, a Fortune 500 global leader in the design, manufacture and distribution of branded home improvement and building products. In this position since 2018, Mr. Shah has responsibility for operating companies with leading brands in architectural coatings, decorative and outdoor lighting, decorative hardware and wellness businesses in North America. Mr. Shah is also responsible for Masco's Corporate Strategic Planning activities. He previously served as President of Delta Faucet Company, a Masco business unit, from 2014 to 2018, as Vice President and Chief Human Resources Officer for Masco from 2012 to 2014, and in various capacities since 2003. Prior to Masco, Mr. Shah held a number of senior management positions at Diversey Corporation and served as Senior Auditor for KPMG Peat Marwick Chartered Accountants. Mr. Shah is a Certified Public Accountant and Chartered Professional Accountant (Canada) and holds an MBA from the University of Michigan, as well as bachelor's and master's degrees in accounting from the University of Waterloo in Ontario, Canada. Mr. Shah's range of experience at Masco in a variety of operational, financial and corporate roles offers the Board a broad perspective on relevant issues facing global corporations, including growth strategy development and implementation, talent management, and adapting to e-business and market innovations. He was first elected as a director of the Company in 2019.
Phoebe A. Wood, age 67, has been a principal in CompaniesWood, a consulting firm specializing in early stage investments, since her 2008 retirement as Vice Chairman and Chief Financial Officer of Brown-Forman Corporation, a diversified consumer products manufacturer, where she had served since 2001. Ms. Wood previously held various positions at Atlantic Richfield Company, an oil and gas company, from 1976 to 2000. Ms. Wood holds a degree in psychology from Smith College and an MBA from UCLA. Ms. Wood is a director of Invesco, Ltd., an independent global investment manager, Pioneer Natural Resources, an independent oil and gas company, and PPL Corporation, a utility and energy services company. She previously served as a director of Coca-Cola Enterprises, Inc., a major bottler and distributor of Coca-Cola products. From her career in business and various directorships, Ms. Wood provides the Board with a wealth of understanding of the strategic, financial and accounting issues the Board addresses in its oversight role. She was first elected as a director of the Company in 2005.
Please see the “Supplemental Item” in Part I on page 29 hereof, for a listing of and a description of the positions and offices held by the executive officers of the Company.
The Company has adopted a code of ethics that applies to its chief executive officer, chief financial officer, and chief accounting officer called the Leggett & Platt, Incorporated Financial Code of Ethics. The Company has also adopted a Code of Business Conduct and Ethics for directors, officers, and employees and Corporate Governance Guidelines. The Financial Code of Ethics, the Code of Business Conduct and Ethics and the Corporate Governance Guidelines are available on the Company’s website at www.leggett-search.com/governance. Each of these documents is available in print to any person, without charge, upon request. Such requests may be made to the Company’s Secretary at Leggett & Platt, Incorporated, No. 1 Leggett Road, Carthage, Missouri 64836.
70
PART III
On February 23, 2021, the Company's Nominating & Corporate Governance Committee of the Board (the “Committee”) amended the Company's procedures regarding shareholder recommendations for nominations of directors. Prior to the amendment, the procedures provided that the Committee will always have regard for the need to consider candidates to maintain and strengthen the Board’s diversity, and that it consider director candidates from a wide variety of backgrounds, without discrimination based on race, ethnicity, color, ancestry, national origin, religion, sex, sexual orientation, gender identity, age, disability, or any other status protected by law. The Committee amended the procedures to expressly require that (i) the Committee actively seek director candidates from a wide variety of backgrounds without discrimination based on any of the enumerated categories listed above and (ii) for each director search, the pool of candidates must include female and racial or ethnic minority candidates. The complete procedure can be found at www.leggett-search.com/governance, under Corporate Governance, Director Nomination Procedure.
The Company intends to satisfy the disclosure requirement under Item 5.05 of Form 8-K by posting any applicable amendment or waiver to its Financial Code of Ethics, within four business days, on its website at the above address for at least a 12-month period. We routinely post important information to our website. However, the Company’s website does not constitute part of this Annual Report on Form 10-K.
Item 11. Executive Compensation.
The subsections titled “Board’s Oversight of Risk Management,” “Director Compensation,” together with the entire section titled “Executive Compensation and Related Matters” in the Company’s definitive Proxy Statement for the Company’s Annual Meeting of Shareholders to be held on May 25, 2021, are incorporated by reference. No Compensation Committee member had an interlocking relationship as described in Item 407(e)(4) of Regulations S-K.
Item 12. Security Ownership of Certain Beneficial Owners and Management and Related Stockholder Matters.
The entire sections titled “Security Ownership” and “Equity Compensation Plan Information” in the Company’s definitive Proxy Statement for the Company’s Annual Meeting of Shareholders to be held on May 25, 2021, are incorporated by reference.
Item 13. Certain Relationships and Related Transactions, and Director Independence.
The subsections titled “Proposal 1 - Election of Directors,” “Transactions with Related Persons,” “Director Independence”, and “Board and Committee Composition and Meetings” in the Company’s definitive Proxy Statement for the Company’s Annual Meeting of Shareholders to be held on May 25, 2021, are incorporated by reference.
Item 14. Principal Accounting Fees and Services.
The subsections titled “Audit and Non-Audit Fees” and “Pre-Approval Procedures for Audit and Non-Audit Services” in the Company’s definitive Proxy Statement for the Company’s Annual Meeting of Shareholders to be held on May 25, 2021, are incorporated by reference.
71
PART IV
PART IV
Item 15. Exhibits and Financial Statement Schedules.
(a) Financial Statements and Financial Statement Schedule.
The Reports, Financial Statements and Notes, supplementary financial information and Financial Statement Schedule listed below are included in this Form 10-K:
| Page No. | |||||
We have omitted other information schedules because the information is inapplicable, not required, or in the financial statements or notes.
We did not file other long-term debt instruments because the total amount of securities authorized under all of these instruments does not exceed ten percent of the total assets of the Company and its subsidiaries on a consolidated basis. The Company agrees to furnish a copy of such instruments to the SEC upon request.
72
PART IV
Management’s Annual Report on Internal Control Over Financial Reporting
Management of Leggett & Platt, Incorporated is responsible for establishing and maintaining adequate internal control over financial reporting as defined in Exchange Act Rule 13a-15(f). Leggett & Platt’s internal control over financial reporting is a process designed to provide reasonable assurance regarding the reliability of financial reporting and the preparation of financial statements for external purposes in accordance with accounting principles generally accepted in the United States of America. The Company’s internal control over financial reporting includes those policies and procedures that:
•Pertain to the maintenance of records that, in reasonable detail, accurately and fairly reflect the transactions and dispositions of the assets of Leggett & Platt;
•Provide reasonable assurance that transactions are recorded as necessary to permit preparation of financial statements in accordance with accounting principles generally accepted in the United States of America, and that receipts and expenditures of Leggett & Platt are being made only in accordance with authorizations of management and directors of Leggett & Platt; and
•Provide reasonable assurance regarding prevention or timely detection of unauthorized acquisition, use or disposition of Leggett & Platt assets that could have a material effect on the financial statements.
Because of its inherent limitations, internal control over financial reporting may not prevent or detect misstatements. Also, projections of any evaluation of effectiveness to future periods are subject to the risk that controls may become inadequate because of changes in conditions, or that the degree of compliance with the policies or procedures may deteriorate.
Under the supervision and with the participation of management (including ourselves), we conducted an evaluation of the effectiveness of Leggett & Platt’s internal control over financial reporting, as of December 31, 2020, based on the criteria in Internal Control—Integrated Framework (2013) issued by the Committee of Sponsoring Organizations of the Treadway Commission. Based on the evaluation under this framework, we concluded that Leggett & Platt’s internal control over financial reporting was effective as of December 31, 2020.
Leggett & Platt’s internal control over financial reporting, as of December 31, 2020, has been audited by PricewaterhouseCoopers LLP, an independent registered public accounting firm, as stated in their report appearing on page 74 of this Form 10-K.
| /s/ KARL G. GLASSMAN | /s/ JEFFREY L. TATE | |||||||
| Karl G. Glassman Chairman and Chief Executive Officer | Jeffrey L. Tate Executive Vice President and Chief Financial Officer | |||||||
| February 24, 2021 | February 24, 2021 | |||||||
73
PART IV
Report of Independent Registered Public Accounting Firm
To the Board of Directors and Shareholders of
Leggett & Platt, Incorporated
Opinions on the Financial Statements and Internal Control over Financial Reporting
We have audited the accompanying consolidated balance sheets of Leggett & Platt, Incorporated and its subsidiaries (the “Company”) as of December 31, 2020 and 2019, and the related consolidated statements of operations, comprehensive income (loss), changes in equity and cash flows for each of the three years in the period ended December 31, 2020, including the related notes and financial statement schedule listed in the index appearing under Item 15(a) (collectively referred to as the “consolidated financial statements”). We also have audited the Company's internal control over financial reporting as of December 31, 2020, based on criteria established in Internal Control - Integrated Framework (2013) issued by the Committee of Sponsoring Organizations of the Treadway Commission (COSO).
In our opinion, the consolidated financial statements referred to above present fairly, in all material respects, the financial position of the Company as of December 31, 2020 and 2019, and the results of its operations and its cash flows for each of the three years in the period ended December 31, 2020 in conformity with accounting principles generally accepted in the United States of America. Also in our opinion, the Company maintained, in all material respects, effective internal control over financial reporting as of December 31, 2020, based on criteria established in Internal Control - Integrated Framework (2013) issued by the COSO.
Changes in Accounting Principles
As discussed in Note K to the consolidated financial statements, the Company changed the manner in which it accounts for leases in 2019.
Basis for Opinions
The Company's management is responsible for these consolidated financial statements, for maintaining effective internal control over financial reporting, and for its assessment of the effectiveness of internal control over financial reporting, included in the accompanying Management’s Annual Report on Internal Control Over Financial Reporting. Our responsibility is to express opinions on the Company’s consolidated financial statements and on the Company's internal control over financial reporting based on our audits. We are a public accounting firm registered with the Public Company Accounting Oversight Board (United States) (PCAOB) and are required to be independent with respect to the Company in accordance with the U.S. federal securities laws and the applicable rules and regulations of the Securities and Exchange Commission and the PCAOB.
We conducted our audits in accordance with the standards of the PCAOB. Those standards require that we plan and perform the audits to obtain reasonable assurance about whether the consolidated financial statements are free of material misstatement, whether due to error or fraud, and whether effective internal control over financial reporting was maintained in all material respects.
Our audits of the consolidated financial statements included performing procedures to assess the risks of material misstatement of the consolidated financial statements, whether due to error or fraud, and performing procedures that respond to those risks. Such procedures included examining, on a test basis, evidence regarding the amounts and disclosures in the consolidated financial statements. Our audits also included evaluating the accounting principles used and significant estimates made by management, as well as evaluating the overall presentation of the consolidated financial statements. Our audit of internal control over financial reporting included obtaining an understanding of internal control over financial reporting, assessing the risk that a material weakness exists, and testing and evaluating the design and operating effectiveness of internal control based on the assessed risk. Our audits also included performing such other procedures as we considered necessary in the circumstances. We believe that our audits provide a reasonable basis for our opinions.
74
PART IV
Definition and Limitations of Internal Control over Financial Reporting
A company’s internal control over financial reporting is a process designed to provide reasonable assurance regarding the reliability of financial reporting and the preparation of financial statements for external purposes in accordance with generally accepted accounting principles. A company’s internal control over financial reporting includes those policies and procedures that (i) pertain to the maintenance of records that, in reasonable detail, accurately and fairly reflect the transactions and dispositions of the assets of the company; (ii) provide reasonable assurance that transactions are recorded as necessary to permit preparation of financial statements in accordance with generally accepted accounting principles, and that receipts and expenditures of the company are being made only in accordance with authorizations of management and directors of the company; and (iii) provide reasonable assurance regarding prevention or timely detection of unauthorized acquisition, use, or disposition of the company’s assets that could have a material effect on the financial statements.
Because of its inherent limitations, internal control over financial reporting may not prevent or detect misstatements. Also, projections of any evaluation of effectiveness to future periods are subject to the risk that controls may become inadequate because of changes in conditions, or that the degree of compliance with the policies or procedures may deteriorate.
Critical Audit Matter
The critical audit matter communicated below is a matter arising from the current period audit of the consolidated financial statements that was communicated or required to be communicated to the audit committee and that (i) relates to accounts or disclosures that are material to the consolidated financial statements and (ii) involved our especially challenging, subjective, or complex judgments. The communication of critical audit matters does not alter in any way our opinion on the consolidated financial statements, taken as a whole, and we are not, by communicating the critical audit matter below, providing a separate opinion on the critical audit matter or on the accounts or disclosures to which it relates.
Goodwill Impairment Assessment - Work Furniture and Aerospace Reporting Units
As described in Notes A, C and D to the consolidated financial statements, the Company’s consolidated net goodwill balance was $1,388.8 million as of December 31, 2020, and the goodwill associated with the Work Furniture and Aerospace reporting units were $97.2 million and $59.5 million, respectively. Management assesses goodwill for impairment annually and as triggering events occur. An impairment charge is recognized for the amount by which the carrying amount exceeds the reporting unit's fair value, up to the total amount of goodwill for the reporting unit. Fair value of the reporting unit is determined by management using a combination of two valuation methods, a market approach and an income approach, with each method generally given equal weighting in determining the fair value assigned to each reporting unit. The market approach estimates fair value by first determining price-to-earnings ratios for comparable publicly traded companies with similar characteristics of the reporting unit. The price-to-earnings ratio for comparable companies is based upon current enterprise value compared to the projected earnings for the next two years. The enterprise value is based upon current market capitalization and includes a control premium. Projected earnings are based upon market analysts’ projections. The earnings ratios are applied to the projected earnings of the comparable reporting unit to estimate fair value. The income approach is based on projected future (debt-free) cash flow that is discounted to present value using factors that consider the timing and risk of future cash flows. Discounted cash flow projections are based on 10-year financial forecasts developed from operating plans and economic projections, sales growth, estimates of future expected changes in operating margins, terminal value growth rates, discount rates, future capital expenditures and changes in working capital requirements.
The principal considerations for our determination that performing procedures relating to the goodwill impairment assessment of the Work Furniture and Aerospace reporting units is a critical audit matter are (i) the significant judgment by management when determining the fair value measurement of the reporting units derived from the income approach; (ii) the high degree of auditor judgment, subjectivity, and effort in performing procedures and evaluating management’s significant assumptions related to sales growth, estimates of future expected changes in operating margins, and discount rates; and (iii) the audit effort involved the use of professionals with specialized skill and knowledge.
Addressing the matter involved performing procedures and evaluating audit evidence in connection with forming our overall opinion on the consolidated financial statements. These procedures included testing the effectiveness of controls relating to management’s goodwill impairment assessment, including controls over determination of the fair value of the
75
PART IV
Company’s Work Furniture and Aerospace reporting units. These procedures also included, among others, (i) testing management's process for determining the fair value estimate of the reporting units, (ii) evaluating the appropriateness of the discounted cash flow model, (iii) testing the completeness, accuracy and relevance of underlying data used in the model, and (iv) evaluating the significant assumptions used by management related to the sales growth, estimates of future expected changes in operating margins, and discount rates. Evaluating management’s assumptions used in the income approach related to sales growth and estimates of future expected changes in operating margins involved evaluating whether the assumptions were reasonable considering (i) past and present performance of the reporting units, (ii) the consistency with external market and industry data, and (iii) whether these assumptions were consistent with evidence obtained in other areas of the audit. Professionals with specialized skill and knowledge were used to assist in the evaluation of the Company's discounted cash flow model and the discount rates.
/s/ PRICEWATERHOUSECOOPERS LLP
St. Louis, Missouri
February 24, 2021
We have served as the Company’s auditor since 1991.
76
LEGGETT & PLATT, INCORPORATED
Consolidated Statements of Operations
| Year Ended December 31 | |||||||||||||||||
| (Amounts in millions, except per share data) | 2020 | 2019 | 2018 | ||||||||||||||
| Net trade sales | $ | $ | $ | ||||||||||||||
| Cost of goods sold | |||||||||||||||||
| Gross profit | |||||||||||||||||
| Selling and administrative expenses | |||||||||||||||||
| Amortization of intangibles | |||||||||||||||||
| Impairments | |||||||||||||||||
| Other (income) expense, net | ( | ( | |||||||||||||||
| Earnings before interest and income taxes | |||||||||||||||||
| Interest expense | |||||||||||||||||
| Interest income | |||||||||||||||||
| Earnings before income taxes | |||||||||||||||||
| Income taxes | |||||||||||||||||
| Net earnings | |||||||||||||||||
| (Earnings) attributable to noncontrolling interest, net of tax | ( | ( | ( | ||||||||||||||
| Net earnings attributable to Leggett & Platt, Inc. common shareholders | $ | $ | $ | ||||||||||||||
| Net earnings per share attributable to Leggett & Platt, Inc. common shareholders | |||||||||||||||||
| Basic | $ | $ | $ | ||||||||||||||
| Diluted | $ | $ | $ | ||||||||||||||
The accompanying notes are an integral part of these financial statements.
77
LEGGETT & PLATT, INCORPORATED
Consolidated Statements of Comprehensive Income (Loss)
| Year Ended December 31 | |||||||||||||||||
| (Amounts in millions) | 2020 | 2019 | 2018 | ||||||||||||||
| Net earnings | $ | $ | $ | ||||||||||||||
| Other comprehensive income (loss), net of tax: | |||||||||||||||||
| Foreign currency translation adjustments | ( | ||||||||||||||||
| Cash flow hedges | ( | ||||||||||||||||
| Defined benefit pension plans | ( | ( | ( | ||||||||||||||
| Other comprehensive income (loss) | ( | ||||||||||||||||
| Comprehensive income | |||||||||||||||||
| Less: comprehensive (income) attributable to noncontrolling interest | ( | ( | |||||||||||||||
| Comprehensive income attributable to Leggett & Platt, Inc. | $ | $ | $ | ||||||||||||||
The accompanying notes are an integral part of these financial statements.
78
LEGGETT & PLATT, INCORPORATED
Consolidated Balance Sheets
| December 31 | |||||||||||
| (Amounts in millions, except per share data) | 2020 | 2019 | |||||||||
| ASSETS | |||||||||||
| Current Assets | |||||||||||
| Cash and cash equivalents | $ | $ | |||||||||
| Trade receivables, net | |||||||||||
| Other receivables, net | |||||||||||
| Total receivables, net | |||||||||||
| Total inventories, net | |||||||||||
| Prepaid expenses and other current assets | |||||||||||
| Total current assets | |||||||||||
| Property, Plant and Equipment—at cost | |||||||||||
| Machinery and equipment | |||||||||||
| Buildings and other | |||||||||||
| Land | |||||||||||
| Total property, plant and equipment | |||||||||||
| Less accumulated depreciation | |||||||||||
| Net property, plant and equipment | |||||||||||
| Other Assets | |||||||||||
| Goodwill | |||||||||||
| Other intangibles, net | |||||||||||
| Operating lease right-of-use assets | |||||||||||
| Sundry | |||||||||||
| Total other assets | |||||||||||
| TOTAL ASSETS | $ | $ | |||||||||
| LIABILITIES AND EQUITY | |||||||||||
| Current Liabilities | |||||||||||
| Current maturities of long-term debt | $ | $ | |||||||||
| Current portion of operating lease liabilities | |||||||||||
| Accounts payable | |||||||||||
| Accrued expenses | |||||||||||
| Other current liabilities | |||||||||||
| Total current liabilities | |||||||||||
| Long-term Liabilities | |||||||||||
| Long-term debt | |||||||||||
| Operating lease liabilities | |||||||||||
| Other long-term liabilities | |||||||||||
| Deferred income taxes | |||||||||||
| Total long-term liabilities | |||||||||||
| Commitments and Contingencies | |||||||||||
| Equity | |||||||||||
Common stock: Preferred stock—authorized, | |||||||||||
| Additional contributed capital | |||||||||||
| Retained earnings | |||||||||||
| Accumulated other comprehensive (loss) | ( | ( | |||||||||
Less treasury stock—at cost ( | ( | ( | |||||||||
| Total Leggett & Platt, Inc. equity | |||||||||||
| Noncontrolling interest | |||||||||||
| Total equity | |||||||||||
| TOTAL LIABILITIES AND EQUITY | $ | $ | |||||||||
| The accompanying notes are an integral part of these financial statements. | |||||||||||
79
LEGGETT & PLATT, INCORPORATED
Consolidated Statements of Cash Flows
| Year Ended December 31 | |||||||||||||||||
| (Amounts in millions) | 2020 | 2019 | 2018 | ||||||||||||||
| Operating Activities | |||||||||||||||||
| Net earnings | $ | $ | $ | ||||||||||||||
| Adjustments to reconcile net earnings to net cash provided by operating activities: | |||||||||||||||||
| Depreciation | |||||||||||||||||
| Amortization of intangibles and supply agreements | |||||||||||||||||
| Long-lived asset impairment | |||||||||||||||||
| Goodwill impairment | |||||||||||||||||
| Provision for losses on accounts and notes receivable | |||||||||||||||||
| Writedown of inventories | |||||||||||||||||
| Net gain from sales of assets and businesses | ( | ( | ( | ||||||||||||||
| Deferred income tax (benefit) expense | ( | ( | |||||||||||||||
| Stock-based compensation | |||||||||||||||||
| Pension expense (income), net of contributions | ( | ||||||||||||||||
| Other, net | |||||||||||||||||
| Increases/decreases in, excluding effects from acquisitions and divestitures: | |||||||||||||||||
| Accounts and other receivables | ( | ||||||||||||||||
| Inventories | ( | ( | |||||||||||||||
| Other current assets | ( | ( | |||||||||||||||
| Accounts payable | ( | ||||||||||||||||
| Accrued expenses and other current liabilities | ( | ||||||||||||||||
| Net Cash Provided by Operating Activities | |||||||||||||||||
| Investing Activities | |||||||||||||||||
| Additions to property, plant and equipment | ( | ( | ( | ||||||||||||||
| Purchases of companies, net of cash acquired | ( | ( | |||||||||||||||
| Proceeds from sales of assets and businesses | |||||||||||||||||
| Other, net | ( | ( | |||||||||||||||
| Net Cash Used for Investing Activities | ( | ( | ( | ||||||||||||||
| Financing Activities | |||||||||||||||||
| Additions to long-term debt | |||||||||||||||||
| Payments on long-term debt | ( | ( | ( | ||||||||||||||
| Change in commercial paper and short-term debt | ( | ( | |||||||||||||||
| Dividends paid | ( | ( | ( | ||||||||||||||
| Issuances of common stock | |||||||||||||||||
| Purchases of common stock | ( | ( | ( | ||||||||||||||
| Additional consideration paid on prior year acquisitions | ( | ( | ( | ||||||||||||||
| Other, net | ( | ( | ( | ||||||||||||||
| Net Cash (Used for) Provided by Financing Activities | ( | ( | |||||||||||||||
| Effect of Exchange Rate Changes on Cash | ( | ( | |||||||||||||||
| Increase (Decrease) in Cash and Cash Equivalents | ( | ( | |||||||||||||||
| Cash and Cash Equivalents—Beginning of Year | |||||||||||||||||
| Cash and Cash Equivalents—End of Year | $ | $ | $ | ||||||||||||||
| Supplemental Information | |||||||||||||||||
| Interest paid (net of amounts capitalized) | $ | $ | $ | ||||||||||||||
| Income taxes paid | |||||||||||||||||
| Property, plant and equipment acquired through finance leases | |||||||||||||||||
| Capital expenditures in accounts payable | |||||||||||||||||
| Prepaid income taxes and taxes receivable (recovered) applied against the deemed repatriation tax liability | ( | ||||||||||||||||
The accompanying notes are an integral part of these financial statements.
80
LEGGETT & PLATT, INCORPORATED
Consolidated Statements of Changes in Equity
(Amounts in millions, except per share data) | Common Stock | Additional Contributed Capital | Retained Earnings | Accumulated Other Comprehensive Income (Loss) | Treasury Stock | Noncontrolling Interest | Total Equity | ||||||||||||||||||||||||||||||||||||||||||||||
| Shares | Amount | Shares | Amount | ||||||||||||||||||||||||||||||||||||||||||||||||||
| Balance, December 31, 2017 | $ | $ | $ | $ | ( | ( | $ | ( | $ | $ | |||||||||||||||||||||||||||||||||||||||||||
| — | — | — | ( | — | — | — | — | ( | |||||||||||||||||||||||||||||||||||||||||||||
| Adjusted beginning balance, January 1, 2018 | ( | ( | ( | ||||||||||||||||||||||||||||||||||||||||||||||||||
| Net earnings attributable to Leggett & Platt, Inc. common shareholders | — | — | — | — | — | — | |||||||||||||||||||||||||||||||||||||||||||||||
| Dividends declared | — | — | ( | — | — | — | — | ( | |||||||||||||||||||||||||||||||||||||||||||||
| Dividends paid to noncontrolling interest | — | — | — | — | — | — | — | ( | ( | ||||||||||||||||||||||||||||||||||||||||||||
| Treasury stock purchased | — | — | — | — | — | ( | ( | — | ( | ||||||||||||||||||||||||||||||||||||||||||||
| Treasury stock issued | — | — | ( | — | — | — | |||||||||||||||||||||||||||||||||||||||||||||||
| — | — | — | — | ( | — | — | — | ( | |||||||||||||||||||||||||||||||||||||||||||||
| Stock-based compensation, net of tax | — | — | — | — | — | — | — | ||||||||||||||||||||||||||||||||||||||||||||||
| Balance, December 31, 2018 | $ | $ | $ | $ | ( | ( | $ | ( | $ | $ | |||||||||||||||||||||||||||||||||||||||||||
| — | — | — | — | — | — | — | |||||||||||||||||||||||||||||||||||||||||||||||
| Adjusted beginning balance, January 1, 2019 | ( | ( | ( | ||||||||||||||||||||||||||||||||||||||||||||||||||
| Net earnings attributable to Leggett & Platt, Inc. common shareholders | — | — | — | — | — | — | |||||||||||||||||||||||||||||||||||||||||||||||
| Dividends declared | — | — | ( | — | — | — | — | ( | |||||||||||||||||||||||||||||||||||||||||||||
| Dividends paid to noncontrolling interest | — | — | — | — | — | — | — | ( | ( | ||||||||||||||||||||||||||||||||||||||||||||
| Treasury stock purchased | — | — | — | — | — | ( | ( | — | ( | ||||||||||||||||||||||||||||||||||||||||||||
| Treasury stock issued | — | — | ( | — | — | — | |||||||||||||||||||||||||||||||||||||||||||||||
| — | — | — | — | — | — | — | |||||||||||||||||||||||||||||||||||||||||||||||
| Stock-based compensation, net of tax | — | — | — | — | — | — | — | ||||||||||||||||||||||||||||||||||||||||||||||
| Balance, December 31, 2019 | $ | $ | $ | $ | ( | ( | $ | ( | $ | $ | |||||||||||||||||||||||||||||||||||||||||||
| — | — | — | ( | — | — | — | — | ( | |||||||||||||||||||||||||||||||||||||||||||||
| Adjusted beginning balance, January 1, 2020 | ( | ( | ( | ||||||||||||||||||||||||||||||||||||||||||||||||||
| Net earnings attributable to Leggett & Platt, Inc. common shareholders | — | — | — | — | — | — | |||||||||||||||||||||||||||||||||||||||||||||||
| Dividends declared | — | — | ( | — | — | — | — | ( | |||||||||||||||||||||||||||||||||||||||||||||
| Treasury stock purchased | — | — | — | — | — | ( | ( | — | ( | ||||||||||||||||||||||||||||||||||||||||||||
| Treasury stock issued | — | — | ( | — | — | — | |||||||||||||||||||||||||||||||||||||||||||||||
| — | — | — | — | — | — | ( | |||||||||||||||||||||||||||||||||||||||||||||||
| Stock-based compensation, net of tax | — | — | — | — | — | — | — | ||||||||||||||||||||||||||||||||||||||||||||||
| Balance, December 31, 2020 | $ | $ | $ | $ | ( | ( | $ | ( | $ | $ | |||||||||||||||||||||||||||||||||||||||||||
The accompanying notes are an integral part of these financial statements.
81
Leggett & Platt, Incorporated
Notes to Consolidated Financial Statements
(Dollar amounts in millions, except per share data)
December 31, 2020, 2019 and 2018
A—Summary of Significant Accounting Policies
TRADE AND OTHER RECEIVABLES AND ALLOWANCE FOR DOUBTFUL ACCOUNTS: Trade receivables are recorded at the invoiced amount and generally do not bear interest. Credit is also occasionally extended in the form of a note receivable to facilitate our customers’ operating cycles. Other notes receivable are established in special circumstances, such as in partial payment for the sale of a business or to support other business opportunities. Other notes receivable generally bear interest at market rates commensurate with the corresponding credit risk on the date of origination.
We have participated in trade receivables sales programs with third-party banking institutions and trade receivables sales programs that have been implemented by certain of our customers the last few years. Under each of these programs, we sell our entire interest in the trade receivable for 100 % of face value, less a discount. Because control of the sold receivable is transferred to the buyer at the time of sale, accounts receivable balances sold are removed from the Consolidated Balance Sheets and the related proceeds are reported as cash provided by operating activities in the Consolidated Statements of Cash Flows. We had approximately $45.0 and $40.0 of trade receivables that were sold and removed from our Consolidated Balance Sheets at December 31, 2020 and 2019.
The allowance for doubtful accounts is an estimate of the amount of probable credit losses. On January 1, 2020, we adopted ASU 2016-13 "Financial Instruments—Credit Losses" (Topic 326) as discussed in Note H. Prior to adoption, allowances and nonaccrual status designations were determined by individual account reviews by management and were based on several factors, such as the length of time that receivables were past due, the financial health of the companies involved, industry and macroeconomic considerations, and historical loss experience. To determine our allowance for doubtful accounts under the new guidance, we also are utilizing a pool approach to group our receivables with similar risk characteristics. Our pools correspond with our business units, which generally have similar terms, industry-specific conditions, and historical or expected loss patterns. Reserves are established for each pool based on their level of risk exposure. When credit deterioration occurs on a specific customer within a pool, we evaluate the receivable separately to estimate the expected credit loss, based on the specific risk characteristics. A qualitative reserve is also established for any current macroeconomic conditions or reasonable and supportable forecasts that could impact the expected collectibility of all or a portion of our receivables portfolio.
82
INVENTORIES: The following table recaps the components of inventory for each period presented:
| December 31, 2020 | December 31, 2019 | ||||||||||
| Finished goods | $ | $ | |||||||||
| Work in process | |||||||||||
| Raw materials and supplies | |||||||||||
| LIFO reserve | ( | ( | |||||||||
| Total inventories, net | $ | $ | |||||||||
All inventories are stated at the lower of cost or net realizable value. We generally use standard costs which include materials, labor, and production overhead at normal production capacity.
The last-in, first-out (LIFO) method is primarily used to value our domestic steel-related inventories, largely in the Bedding Products segment and Furniture, Flooring & Textile Products segment. Prior to 2019, inventories accounted for using the LIFO method represented approximately 50 % of our inventories. With the acquisition of ECS in the first quarter of 2019 (see Note R), inventories valued using the LIFO method decreased to roughly 40 %, as ECS does not utilize the LIFO method. However, due to the sharp increase in demand that began in the latter part of the second quarter of 2020 and several divestitures and closures of operations using the LIFO method in the last three years, our LIFO inventories have been lower than historical levels, and currently represent about one-third of our total inventories. Over those years, the decreases in inventories valued using the LIFO method resulted in the liquidation of LIFO inventory layers. The effect of this reduction did not materially impact our cost of sales for any of the years presented. For the remainder of the inventories, we principally use the first-in, first-out (FIFO) method, which is representative of our standard costs. For these inventories, the FIFO cost for the periods presented approximated expected replacement cost.
Inventories are reviewed at least quarterly for slow-moving and potentially obsolete items using actual inventory turnover and, if necessary, are written down to estimated net realizable value. Restructuring activity and decisions to narrow product offerings (as discussed in Note E) also impact the estimated net realizable value of inventories. We have had no material changes in inventory writedowns or slow-moving and obsolete inventory reserves in any of the years presented.
The following table presents the activity in our LIFO reserve for each of the periods presented:
| Year Ended December 31 | |||||||||||||||||
| 2020 | 2019 | 2018 | |||||||||||||||
| Balance, beginning of year | $ | $ | $ | ||||||||||||||
| LIFO expense (benefit) | ( | ||||||||||||||||
Allocated to divested businesses 1 | ( | ||||||||||||||||
| Balance, end of year | $ | $ | $ | ||||||||||||||
83
We utilize the following methodologies in determining fair value:
•Inventory is valued at current replacement cost for raw materials, with a step-up for work in process and finished goods items that reflects the amount of ultimate profit earned as of the valuation date.
•Other working capital items are generally recorded at carrying value, unless there are known conditions that would impact the ultimate settlement amount of the particular item.
•Buildings and machinery are valued at an estimated replacement cost for an asset of comparable age and condition. Market pricing of comparable assets is used to estimate replacement cost where available.
•The most common identified intangible assets are customer relationships, technology, and tradenames. Discount rates discussed below are typically derived from a weighted-average cost of capital analysis and adjusted to reflect inherent risks.
◦Customer relationships are valued using an excess earnings method using various inputs, such as the estimated customer attrition rate, revenue growth rate and cost of sales, the amount of contributory asset charges, and an appropriate discount rate. The economic useful life is determined based on historical customer turnover rates.
◦Technology and tradenames are valued using a relief-from-royalty method, with various inputs, such as comparable market royalty rates for items of similar value, future earnings forecast, an appropriate discount rate, and a replacement rate for technology. The economic useful life is determined based on the expected life of the technology and tradenames.
DIVESTITURES: Significant accounting policies associated with a decision to dispose of a business are discussed below:
Discontinued Operations—A business is classified as discontinued operations if the disposal represents a strategic shift that will have a major effect on operations or financial results and meets the criteria to be classified as held for sale or is disposed of by sale or otherwise. Significant judgments are involved in determining whether a business meets the criteria for discontinued operations reporting and the period in which these criteria are met.
If a business is reported as a discontinued operation, the results of operations through the date of sale, including any gain or loss recognized on the disposition, are presented on a separate line of the income statement. Interest on debt directly attributable to the discontinued operation is allocated to discontinued operations. Gains and losses related to the sale of businesses that do not meet the discontinued operation criteria are reported in continuing operations and separately disclosed if significant.
Assets Held for Sale—An asset or business is classified as held for sale when (i) management commits to a plan to sell and it is actively marketed; (ii) it is available for immediate sale and the sale is expected to be completed within one year; and (iii) it is unlikely significant changes to the plan will be made or that the plan will be withdrawn. In isolated instances, assets held for sale may exceed one year due to events or circumstances beyond our control. Upon being classified as held for sale, the recoverability of the carrying value must be assessed. Evaluating the recoverability of the assets of a business classified as held for sale follows a defined order in which property and intangible assets subject to amortization are considered only after the recoverability of goodwill and other assets are assessed. After the valuation process is completed, the assets held for sale are reported at the lower of the carrying value or fair value less cost to sell, and the assets are no longer depreciated or amortized. An impairment charge is recognized if the carrying value exceeds the fair value less cost to sell. The assets and related liabilities are aggregated and reported on separate lines of the balance sheet.
Assets Held for Use—If a decision to dispose of an asset or a business is made and the held for sale criteria are not met, it is considered held for use. Assets of the business are evaluated for recoverability in the following order: (i) assets other than goodwill, property and intangibles; (ii) property and intangibles subject to amortization; and (iii) goodwill. In evaluating the recoverability of property and intangible assets subject to amortization, the carrying value is first compared to the sum of the undiscounted cash flows expected to result from the use and eventual disposition. If the carrying value exceeds the undiscounted expected cash flows, then a fair value analysis is performed. An impairment charge is recognized if the carrying value exceeds the fair value.
84
PROPERTY, PLANT AND EQUIPMENT: Property, plant and equipment is stated at cost, less accumulated depreciation. Assets are depreciated by the straight-line method and salvage value, if any, is assumed to be minimal. The table below presents the depreciation periods of the estimated useful lives of our property, plant and equipment. Accelerated methods are used for tax purposes.
| Useful Life Range | Weighted Average Life | ||||||||||
| Machinery and equipment | |||||||||||
| Buildings | |||||||||||
| Other items | |||||||||||
Property is reviewed for recoverability at year end and whenever events or changes in circumstances indicate that its carrying value may not be recoverable as discussed above.
GOODWILL: Goodwill results from the acquisition of existing businesses. It is assessed for impairment annually and as triggering events may occur. Our seven reporting units are the business groups one level below the operating segment level for which discrete financial information is available. We perform our annual review in the second quarter of each year using a quantitative analysis.
Previous to 2020, the quantitative analysis utilized a two-step approach which involved a comparison of the fair value of a reporting unit with its carrying value. If the carrying value of the reporting unit exceeded its fair value, the second step of the process was necessary and involved a comparison of the implied fair value and the carrying value of the goodwill of that reporting unit. If the carrying value of the goodwill of a reporting unit exceeded the implied fair value of that goodwill, an impairment loss was recognized in an amount equal to the excess.
Beginning in 2020, we implemented ASU 2017-04 "Intangibles—Goodwill and Other (Topic 350): Simplifying the Test for Goodwill Impairment," as discussed in "New Accounting Guidance" below. The new process eliminated Step 2 from the goodwill impairment test. The test is now performed by comparing the fair value of a reporting unit with its carrying amount. An impairment charge is recognized for the amount by which the carrying amount exceeds the reporting unit's fair value, up to the total amount of goodwill for the reporting unit.
Fair value of reporting units is determined using a combination of two valuation methods: a market approach and an income approach. Each method is generally given equal weight in determining the fair value assigned to each reporting unit. Absent an indication of fair value from a potential buyer or similar specific transaction, we believe that the use of these two methods provides a reasonable estimate of a reporting unit’s fair value. Assumptions common to both methods are operating plans and economic projections, which are used to project future revenues, earnings, and after-tax cash flows for each reporting unit. These assumptions are applied consistently for both methods.
The market approach estimates fair value by first determining price-to-earnings ratios for comparable publicly-traded companies with similar characteristics of the reporting unit. The price-to-earnings ratio for comparable companies is based upon current enterprise value compared to the projected earnings for the next two years. The enterprise value is based upon current market capitalization and includes a control premium. Projected earnings are based upon market analysts’ projections. The earnings ratios are applied to the projected earnings of the comparable reporting unit to estimate fair value. Management believes this approach is appropriate because it provides a fair value estimate using multiples from entities with operations and economic characteristics comparable to our reporting units.
The income approach is based on projected future (debt-free) cash flow that is discounted to present value using factors that consider the timing and risk of future cash flows. Management believes that this approach is appropriate because it provides a fair value estimate based upon the reporting unit’s expected long-term operating cash flow performance. Discounted cash flow projections are based on 10-year financial forecasts developed from operating plans and economic projections noted above, sales growth, estimates of future expected changes in operating margins, an appropriate discount rate, terminal value growth rates, future capital expenditures, and changes in working capital requirements. There are inherent assumptions and judgments required in the analysis of goodwill impairment. It is possible that assumptions underlying the impairment analysis will change in such a manner that impairment in value may occur in the future.
85
OTHER INTANGIBLE ASSETS: Substantially all other intangible assets are amortized using the straight-line method over their estimated useful lives and are evaluated for impairment using a process similar to that used in evaluating the recoverability of property, plant and equipment.
| Useful Life Range | Weighted Average Life | ||||||||||
| Other intangible assets | |||||||||||
REVENUE RECOGNITION: On January 1, 2018, we adopted ASU 2014-09 "Revenue from Contracts with Customers" (Topic 606) as discussed in Note B. We recognize revenue when control of our products transfers to our customers, which is generally upon shipment from our facilities or upon delivery to our customers’ facilities. We reduce revenue for estimated sales allowances, discounts, and rebates, which are our primary forms of variable consideration.
SHIPPING AND HANDLING FEES AND COSTS: Shipping and handling costs are included as a component of “Cost of goods sold.”
INCOME TAXES: The provision for income taxes is determined using the asset and liability approach of accounting for income taxes. Under this approach, deferred taxes represent the future tax consequences expected to occur when the reported amounts of assets and liabilities are recovered or paid. The provision for income taxes represents income taxes paid or payable for the current year plus the change in deferred taxes during the year. Deferred taxes result from differences between the financial and tax basis of our assets and liabilities and are adjusted for changes in tax rates and laws, as appropriate. A valuation allowance is provided to reduce deferred tax assets when management cannot conclude that it is more likely than not that a tax benefit will be realized. A provision is also made for incremental withholding taxes on undistributed earnings of foreign subsidiaries and related companies to the extent that such earnings are not deemed to be indefinitely invested.
The calculation of our U.S., state, and foreign tax liabilities involves dealing with uncertainties in the application of complex global tax laws. We recognize potential liabilities for anticipated tax issues which might arise in the U.S. and other tax jurisdictions based on management’s estimate of whether, and the extent to which, additional taxes will be due. If payment of these amounts ultimately proves to be unnecessary, the reversal of the liabilities would result in tax benefits being recognized in the period when we determine the liabilities are no longer necessary. Conversely, if the estimate of tax liabilities proves to be less than the ultimate tax assessment, a further charge to tax expense would result.
CONCENTRATION OF CREDIT RISKS, EXPOSURES, AND FINANCIAL INSTRUMENTS: We manufacture, market, and distribute products for the various end markets described in Note F. Our operations are principally located in the United States, although we also have operations in Europe, China, Canada, Mexico and other countries.
We maintain allowances for potential credit losses. We perform ongoing credit evaluations of our customers’ financial conditions and generally require no collateral from our customers, some of which are highly leveraged. Management also monitors the financial condition and status of other notes receivable. Other notes receivable have historically primarily consisted of notes accepted as partial payment for the divestiture of a business or to support other business opportunities. Some of these companies are highly leveraged and the notes are not fully collateralized.
We have no material guarantees or liabilities for product warranties which require disclosure.
From time to time, we will enter into contracts to hedge foreign currency denominated transactions and interest rates related to our debt. To minimize the risk of counterparty default, only highly-rated financial institutions that meet certain requirements are used. We do not anticipate that any of the financial institution counterparties will default on their obligations.
86
DERIVATIVE FINANCIAL INSTRUMENTS: We utilize derivative financial instruments to manage market and financial risks related to foreign currency and interest rates. We seek to use derivative contracts that qualify for hedge accounting treatment; however, some instruments that economically manage currency risk may not qualify for hedge accounting treatment. It is our policy not to speculate using derivative instruments.
Under hedge accounting, we formally document our hedge relationships, including identification of the hedging instruments and the hedged items, as well as our risk management objectives and strategies for entering into the hedge transaction. The process includes designating derivative instruments as hedges of specific assets, liabilities, firm commitments, or forecasted transactions. We also formally assess both at inception and on a quarterly basis thereafter, whether the underlying transactions are probable of occurring. If it is determined that an underlying transaction is probable of not occurring, deferred gains or losses are recorded in the Consolidated Statements of Operations.
On the date the contract is entered into, we designate the derivative as one of the following types of hedging instruments and account for it as follows:
Cash Flow Hedge—The hedge of a forecasted transaction or of the variability of cash flows to be received or paid, related to a recognized asset or liability or anticipated transaction, is designated as a cash flow hedge. The change in fair value is recorded in accumulated other comprehensive income. When the hedged item impacts the income statement, the gain or loss included in "Other comprehensive income (loss)" is reported on the same line of the Consolidated Statements of Operations as the hedged item, to match the gain or loss on the derivative to the gain or loss on the hedged item. If it is determined that an underlying transaction is probable of not occurring, the changes in the fair value is immediately reported in the Consolidated Statements of Operations on the same line as the hedged item. Settlements associated with the sale or production of product are presented in operating cash flows, and settlements associated with debt issuance are presented in financing cash flows.
Fair Value Hedge—The hedge of a recognized asset or liability or an unrecognized firm commitment is designated as a fair value hedge. For fair value hedges the changes in fair value of the derivative, along with the gain or loss on the hedged item that is attributable to the hedged risk, are recorded in earnings and reported in the Consolidated Statements of Operations on the same line as the hedged item. Cash flows from settled contracts are presented in the category consistent with the nature of the item being hedged.
87
NEW ACCOUNTING GUIDANCE: The Financial Accounting Standards Board (FASB) regularly issues updates to the FASB Accounting Standards Codification that are communicated through issuance of an Accounting Standards Update (ASU). Below is a summary of the ASUs, effective for current or future periods, most relevant to our financial statements:
Adopted in 2020:
•On January 1, 2020, we adopted ASU 2016-13 “Financial Instruments—Credit Losses” (Topic 326) as discussed in Note H.
•ASU 2017-04 “Intangibles—Goodwill and Other (Topic 350): Simplifying the Test for Goodwill Impairment”. We adopted this ASU on January 1, 2020. This ASU simplifies the subsequent measurement of goodwill by eliminating Step 2 from the goodwill impairment test. The annual goodwill impairment test is performed by comparing the fair value of a reporting unit with its carrying amount, and an impairment charge would be recognized for the amount by which the carrying amount exceeds the reporting unit's fair value, up to the total amount of goodwill for the reporting unit. We applied this guidance to our annual goodwill impairment testing completed in the second quarter of 2020, as discussed in Note C.
•ASU 2018-15 “Intangibles—Goodwill and Other—Internal-Use Software (Subtopic 350-40): Customer’s Accounting for Implementation Costs Incurred in a Cloud Computing Arrangement That Is a Service Contract (a consensus of the FASB Emerging Issues Task Force)”. We adopted this ASU on January 1, 2020. This ASU aligns the requirements for capitalizing implementation costs incurred in a hosting arrangement that is a service contract with the requirements for capitalizing implementation costs incurred to develop or obtain internal-use software. The adoption of this ASU did not materially impact our financial statements.
To be adopted in future years:
•ASU 2019-12 “Income Taxes (Topic 740): Simplifying the Accounting for Income Taxes”: This ASU will be effective January 1, 2021 and is a part of the FASB overall simplification initiative. We are currently evaluating this guidance.
The FASB has issued accounting guidance, in addition to the issuance discussed above, effective for current and future periods. This guidance did not have a material impact on our current financial statements, and we do not believe it will have a material impact on our future financial statements.
B—Revenue
Initial adoption of new ASU
On January 1, 2018, we adopted “Revenue from Contracts with Customers” (Topic 606) and all the related amendments using the modified retrospective method. We recognized the cumulative effect of initially applying the new revenue standard as a $2.3 reduction to the opening balance of “Retained earnings.”
Performance Obligations and Shipping and Handling Costs
We recognize revenue when performance obligations, under the terms of a contract with our customers, are satisfied. Substantially all of our revenue is recognized upon transfer of control of our products to our customers, which is generally upon shipment from our facilities or upon delivery to our customers' facilities, and is dependent on the terms of the specific contract. This conclusion considers the point at which our customers have the ability to direct the use of and obtain substantially all of the remaining benefits of the products that were transferred. Substantially all unsatisfied performance obligations as of December 31, 2020, will be satisfied within one year or less. Shipping and handling costs are included as a component of “Cost of goods sold.”
Sales, value added, and other taxes collected in connection with revenue-producing activities are excluded from revenue.
88
Sales Allowances and Returns
The amount of consideration we receive and revenue we recognize varies with changes in various sales allowances, discounts, and rebates (variable consideration) that we offer to our customers. We reduce revenue by our estimates of variable consideration, based on contract terms and historical experience. Changes in estimates of variable consideration for the periods presented were not material.
Some of our products transferred to customers can be returned, and we recognize the following for this right:
•An estimated refund liability and a corresponding reduction to revenue, based on historical returns experience.
•An asset and a corresponding reduction to cost of sales for our right to recover products from customers upon settling the refund liability. We reduce the carrying amount of these assets by estimates of costs associated with the recovery and any additional expected reduction in value.
Our refund liability and the corresponding asset associated with our right to recover products from our customers were immaterial for the periods presented.
Other
We expect that at contract inception, the time period between when we transfer a promised good to our customer and our receipt of payment from that customer for that good will be one year or less (our typical trade terms are 30 to 60 days for U.S. customers and up to 90 days for our international customers).
We generally expense costs of obtaining a contract because the amortization period would be one year or less.
Revenue by Product Family
| Year Ended December 31 | |||||||||||||||||
| 2020 | 2019 | 2018 | |||||||||||||||
| Bedding Products | |||||||||||||||||
Bedding Group 1 | $ | $ | $ | ||||||||||||||
| Specialized Products | |||||||||||||||||
| Automotive Group | |||||||||||||||||
| Aerospace Products Group | |||||||||||||||||
| Hydraulic Cylinders Group | |||||||||||||||||
| Furniture, Flooring & Textile Products | |||||||||||||||||
| Home Furniture Group | |||||||||||||||||
| Work Furniture Group | |||||||||||||||||
| Flooring & Textile Products Group | |||||||||||||||||
| $ | $ | $ | |||||||||||||||
89
C—Impairment Charges
Pretax impact of impairment charges is summarized in the following table:
| Year Ended | |||||||||||||||||||||||||||||
| 2020 | 2019 | 2018 | |||||||||||||||||||||||||||
| Goodwill Impairment | Other Long-Lived Asset Impairments 2 | Total Impairments | Other Long-Lived Asset Impairments 2 | Other Long-Lived Asset Impairments 2 | |||||||||||||||||||||||||
| Bedding Products | $ | $ | $ | $ | $ | ||||||||||||||||||||||||
| Specialized Products | |||||||||||||||||||||||||||||
| Furniture, Flooring & Textile Products | |||||||||||||||||||||||||||||
Unallocated 1 | |||||||||||||||||||||||||||||
| Total impairment charges | $ | $ | $ | $ | $ | ||||||||||||||||||||||||
1 This is a charge to write off stock associated with a prior year divestiture that filed bankruptcy in 2020.
2 Except as noted above, other long-lived asset impairments are primarily associated with restructuring activities, as discussed in Note E.
Goodwill Impairment Testing
As discussed in Note A, we test goodwill for impairment at the reporting unit level (the business groups that are one level below the operating segments) when triggering events occur, or at least annually. We perform our annual goodwill impairment testing in the second quarter.
The 2019 and 2018 annual goodwill impairment review indicated no
The 2020 goodwill impairment testing resulted in a $25.4 non-cash goodwill impairment charge in the second quarter of 2020 with respect to our Hydraulic Cylinders reporting unit, which is a part of the Specialized Products segment. Demand for hydraulic cylinders is dependent upon capital spending for material handling equipment. We began seeing some market softness in the industries served by this reporting unit in 2019, and the fair value of this reporting unit exceeded its carrying value by 29 % at December 31, 2019.
The impairment charge reflects the complete write-off of the goodwill associated with the Hydraulic Cylinders reporting unit and will not result in future cash expenditures. Although we do not believe that a triggering event related to the impairment of goodwill or other long-lived assets occurred in the first quarter of 2020, the anticipated longer-term economic impacts of COVID-19 lowered expectations of future revenue and profitability, causing its fair value to fall below its carrying value. We concluded on July 30, 2020, as part of our normal second quarter 2020 annual goodwill impairment testing, and in connection with the preparation and review of the second quarter 2020 financial statements, that an impairment charge was required with respect to this reporting unit. We also evaluated other long-lived assets associated with this unit for impairment; no impairments were indicated other than goodwill.
We tested goodwill for impairment in all reporting units for all years presented using a quantitative approach. The fair values of our reporting units in relation to their respective carrying values and significant assumptions used are presented in the tables below. In general, 2020 fair values for our reporting units decreased versus prior years due to COVID-19 impacts on future cash flows. If actual results differ materially from estimates used in these calculations, we could incur future impairment charges.
90
The 2020 table below excludes Hydraulic Cylinders, as this unit had no goodwill remaining after the second quarter 2020 impairment.
| 2020 | ||||||||||||||||||||||||||
| Fair Value over Carrying Value divided by Carrying Value | December 31, 2020 Goodwill Value | 10-year Compound Annual Growth Rate Range for Sales | Terminal Values Long-term Growth Rate for Debt-Free Cash Flow | Discount Rate Ranges | ||||||||||||||||||||||
Less than | $ | % | ||||||||||||||||||||||||
| $ | % | |||||||||||||||||||||||||
| 2019 | ||||||||||||||||||||||||||
| Fair Value over Carrying Value divided by Carrying Value | December 31, 2019 Goodwill Value | 10-year Compound Annual Growth Rate Range for Sales | Terminal Values Long-term Growth Rate for Debt-Free Cash Flow | Discount Rate Ranges | ||||||||||||||||||||||
Less than | $ | % | ||||||||||||||||||||||||
| $ | % | |||||||||||||||||||||||||
1 This category includes one reporting unit for 2020, Work Furniture, which had fair value exceeding its carrying value by 25 % at December 31, 2020, as compared to 126 % in 2019.
2 This category includes two
•The fair value of our Bedding reporting unit exceeded its carrying value by 68 % at December 31, 2020, as compared to 85 % in 2019. This unit had $856.8 of goodwill at December 31, 2020.
•The fair value of our Aerospace reporting unit exceeded its carrying value by 51 % at December 31, 2020, as compared to 139 % in 2019. This unit had $59.5 of goodwill at December 31, 2020.
3 This category includes one reporting unit for 2019, Hydraulic Cylinders (acquired in 2018), which had fair value exceeding its carrying value by 29 % at December 31, 2019.
Other long-lived assets
As discussed in Note A, we test other long-lived assets for recoverability at year end and whenever events or changes in circumstances indicate that the carrying value may not be recoverable. Fair value, and the resulting impairment charges noted above, was based primarily upon offers from potential buyers or third party estimates of fair value less selling costs.
91
D—Goodwill and Other Intangible Assets
The changes in the carrying amounts of goodwill are as follows:
| Bedding Products | Specialized Products | Furniture, Flooring & Textile Products | Total | ||||||||||||||||||||
| Net goodwill as of January 1, 2019 | $ | $ | $ | $ | |||||||||||||||||||
| Additions for current year acquisitions | |||||||||||||||||||||||
| Adjustments to prior year acquisitions | |||||||||||||||||||||||
| Foreign currency translation adjustment | |||||||||||||||||||||||
| Net goodwill as of December 31, 2019 | |||||||||||||||||||||||
| Adjustments to prior year acquisitions | |||||||||||||||||||||||
| Reductions for sale of business | ( | ( | |||||||||||||||||||||
| Impairment charge | ( | ( | |||||||||||||||||||||
| Foreign currency translation adjustment/other | |||||||||||||||||||||||
| Net goodwill as of December 31, 2020 | $ | $ | $ | $ | |||||||||||||||||||
| Net goodwill as of December 31, 2020 is comprised of: | |||||||||||||||||||||||
| Gross goodwill | $ | $ | $ | $ | |||||||||||||||||||
| Accumulated impairment losses | ( | ( | ( | ( | |||||||||||||||||||
| Net goodwill as of December 31, 2020 | $ | $ | $ | $ | |||||||||||||||||||
92
The gross carrying amount and accumulated amortization by intangible asset class and intangible assets acquired during the periods presented, included in "Other intangibles, net" on the Consolidated Balance Sheets, are as follows:
| Patents and Trademarks | Technology | Non-compete Agreements | Customer- Related Intangibles | Supply Agreements and Other | Total | ||||||||||||||||||||||||||||||
| 2020 | |||||||||||||||||||||||||||||||||||
| Gross carrying amount | $ | $ | $ | $ | $ | $ | |||||||||||||||||||||||||||||
| Accumulated amortization | |||||||||||||||||||||||||||||||||||
| Net other intangibles as of December 31, 2020 | $ | $ | $ | $ | $ | $ | |||||||||||||||||||||||||||||
| Acquired during 2020: | |||||||||||||||||||||||||||||||||||
| Acquired related to business acquisitions | $ | $ | $ | $ | $ | $ | |||||||||||||||||||||||||||||
| Acquired outside business acquisitions | |||||||||||||||||||||||||||||||||||
| Total acquired in 2020 | $ | $ | $ | $ | $ | $ | |||||||||||||||||||||||||||||
| Weighted average amortization period in years for items acquired in 2020 | |||||||||||||||||||||||||||||||||||
| 2019 | |||||||||||||||||||||||||||||||||||
| Gross carrying amount | $ | $ | $ | $ | $ | $ | |||||||||||||||||||||||||||||
| Accumulated amortization | |||||||||||||||||||||||||||||||||||
| Net other intangibles as of December 31, 2019 | $ | $ | $ | $ | $ | $ | |||||||||||||||||||||||||||||
| Acquired during 2019: | |||||||||||||||||||||||||||||||||||
| Acquired related to business acquisitions | $ | $ | $ | $ | $ | $ | |||||||||||||||||||||||||||||
| Acquired outside business acquisitions | |||||||||||||||||||||||||||||||||||
| Total acquired in 2019 | $ | $ | $ | $ | $ | $ | |||||||||||||||||||||||||||||
| Weighted average amortization period in years for items acquired in 2019 | |||||||||||||||||||||||||||||||||||
Estimated amortization expense for the items above included in our December 31, 2020 Consolidated Balance Sheets in each of the next five years is as follows:
| Year ended December 31 | |||||
| 2021 | $ | ||||
| 2022 | |||||
| 2023 | |||||
| 2024 | |||||
| 2025 | |||||
E—Restructuring and Restructuring-Related Charges
We implemented various cost reduction initiatives to improve our operating cost structures in the periods presented. These cost initiatives have, among other actions, included workforce reductions and the closure or consolidation of certain operations. Except as discussed below, none of these initiatives has individually resulted in a material charge to earnings.
93
In response to the effect the COVID-19 pandemic has had on the nature and focus of our operations during 2020, we incurred $6.5 severance expense, primarily for permanent workforce reductions associated with changes in management and organizational structure. See Note U for additional information. Based upon current trends, we do not expect additional permanent workforce reductions associated with COVID-19 resulting in material expense.
In December 2018, we committed to the 2018 Restructuring Plan (Plan) primarily associated with our Furniture, Flooring & Textile Products and Bedding Products segments, including the reorganization of the Home Furniture Group (which produces furniture components for the upholstered furniture industry) and the closure of the Fashion Bed business (which supplied ornamental beds, bed frames and other sleep accessories sold to retailers). Both of these businesses had underperformed expectations, primarily from weaker demand and higher raw material costs. In 2019, we modified the Plan to include four small facilities in the Bedding Products segment. All of these activities were substantially complete by the end of December 31, 2019. The following table presents information associated with this Plan:
| Total Amount Incurred to Date | Total Incurred Full Year 2020 | Total Incurred Full Year 2019 | Total Incurred Full Year 2018 | ||||||||||||||||||||
| 2018 Restructuring Plan | |||||||||||||||||||||||
| Restructuring and restructuring-related | $ | $ | $ | $ | |||||||||||||||||||
| Impairment costs associated with this plan | |||||||||||||||||||||||
| $ | $ | $ | $ | ||||||||||||||||||||
| Amount of total that represents cash charges | $ | $ | $ | $ | |||||||||||||||||||
The table below presents all restructuring and restructuring-related activity for the periods presented:
| Year Ended December 31 | |||||||||||||||||
| 2020 | 2019 | 2018 | |||||||||||||||
| Charged to other (income) expense, net: | |||||||||||||||||
| Severance and other restructuring costs | $ | $ | $ | ||||||||||||||
| Charged to cost of goods sold: | |||||||||||||||||
| Inventory obsolescence and other | ( | ||||||||||||||||
| Total restructuring and restructuring-related costs | $ | $ | $ | ||||||||||||||
| Amount of total that represents cash charges | $ | $ | $ | ||||||||||||||
Restructuring and restructuring-related charges by segment were as follows:
| Year Ended December 31 | |||||||||||||||||
| 2020 | 2019 | 2018 | |||||||||||||||
| Bedding Products | $ | $ | $ | ||||||||||||||
| Specialized Products | |||||||||||||||||
| Furniture, Flooring & Textile Products | |||||||||||||||||
| Total | $ | $ | $ | ||||||||||||||
The accrued liability associated with our total restructuring initiatives consisted of the following:
| Balance at December 31, 2018 | Add: 2019 Charges | Less: 2019 Payments | Balance at December 31, 2019 | Add: 2020 Charges | Less: 2020 Payments | Balance at December 31, 2020 | |||||||||||||||||||||||||||||||||||
| Termination benefits | $ | $ | $ | $ | $ | $ | $ | ||||||||||||||||||||||||||||||||||
| Contract termination costs | |||||||||||||||||||||||||||||||||||||||||
| Other restructuring costs | |||||||||||||||||||||||||||||||||||||||||
| $ | $ | $ | $ | $ | $ | $ | |||||||||||||||||||||||||||||||||||
94
Divestitures
During 2020, we divested two small businesses in our Bedding Products segment: the final operation in our former Fashion Bed business and a specialty wire operation in our Drawn Wire business.
•Annual external sales for these businesses were approximately $45.0 , and EBIT was approximately $2.0 .
•The aggregate selling price was approximately $11.0 , and there was no material gain or loss recognized on the sale of these businesses.
F—Segment Information
Our reportable segments are the same as our operating segments, which also correspond with our management organizational structure. To reflect how we manage our businesses and in conjunction with the change in executive officer leadership, our management organizational structure and all related internal reporting changed effective January 1, 2020. As a result, our segment reporting has changed to reflect the new structure. This segment change was retrospectively applied to all prior periods presented.
The new Bedding Products segment consists of the former Residential Products and Industrial Products segments, plus the Consumer Products Group (which is renamed the Adjustable Bed business unit), minus the Fabric & Flooring Products Group (which is renamed the Flooring & Textile Products Group).
The new Furniture, Flooring & Textile Products segment consists of the former Furniture Products segment, plus the Fabric & Flooring Products Group (which is renamed the Flooring & Textile Products Group) minus the Consumer Products Group (which is renamed the Adjustable Bed business unit).
Our Specialized Products segment was not changed.
We have three operating segments that supply a wide range of products:
•Bedding Products: This segment supplies a variety of components and machinery used by bedding manufacturers in the production and assembly of their finished products, as well as produces private label finished mattresses for bedding brands and adjustable bed bases. This segment is also backwardly integrated into the production and supply of specialty foam chemicals, steel rod, and drawn steel wire to our own operations and to external customers. Our trade customers for wire make mechanical springs and many other end products.
•Specialized Products: From this segment, we supply lumbar support systems, seat suspension systems, motors and actuators, and control cables used by automotive manufacturers. We also produce and distribute tubing and tube assemblies for the aerospace industry and engineered hydraulic cylinders used in the material-handling and construction industries.
•Furniture, Flooring & Textile Products: Operations in this segment supply a wide range of components for residential and work furniture manufacturers, as well as select lines of private label finished furniture. We also produce or distribute carpet cushion, hard surface flooring underlayment, and textile and geo components.
Each reportable segment has an executive vice president who has accountability to, and maintains regular contact with, our chief executive officer, who is the chief operating decision maker (CODM). The operating results and financial information reported through the segment structure are regularly reviewed and used by the CODM to evaluate segment performance, allocate overall resources, and determine management incentive compensation.
The accounting principles used in the preparation of the segment information are the same as those used for the consolidated financial statements. We evaluate performance based on Earnings Before Interest and Taxes (EBIT). Intersegment sales are made primarily at prices that approximate market-based selling prices. Centrally incurred costs are allocated to the segments based on estimates of services used by the segment. Certain of our general and administrative costs and miscellaneous corporate income and expenses are allocated to the segments based on sales or other appropriate metrics. These allocated corporate costs include depreciation and other costs and income related to assets that are not allocated or otherwise included in the segment assets.
95
A summary of segment results for the periods presented are as follows:
| Year Ended December 31 | |||||||||||||||||||||||||||||
Trade 1 Sales | Inter- Segment Sales | Total Segment Sales | EBIT | Depreciation and Amortization | |||||||||||||||||||||||||
| 2020 | |||||||||||||||||||||||||||||
| Bedding Products | $ | $ | $ | $ | $ | ||||||||||||||||||||||||
Specialized Products 2 | |||||||||||||||||||||||||||||
| Furniture, Flooring & Textile Products | |||||||||||||||||||||||||||||
Intersegment eliminations and other 3, 4 | ( | ||||||||||||||||||||||||||||
| $ | $ | $ | $ | $ | |||||||||||||||||||||||||
| 2019 | |||||||||||||||||||||||||||||
| Bedding Products | $ | $ | $ | $ | $ | ||||||||||||||||||||||||
| Specialized Products | |||||||||||||||||||||||||||||
| Furniture, Flooring & Textile Products | |||||||||||||||||||||||||||||
Intersegment eliminations and other 3 | ( | ||||||||||||||||||||||||||||
| $ | $ | $ | $ | $ | |||||||||||||||||||||||||
| 2018 | |||||||||||||||||||||||||||||
| Bedding Products | $ | $ | $ | $ | $ | ||||||||||||||||||||||||
| Specialized Products | |||||||||||||||||||||||||||||
| Furniture, Flooring & Textile Products | |||||||||||||||||||||||||||||
Intersegment eliminations and other 3 | ( | ||||||||||||||||||||||||||||
| $ | $ | $ | $ | $ | |||||||||||||||||||||||||
2 2020 EBIT: Includes $25.4 of goodwill impairment for the Hydraulic Cylinders unit as discussed in (See Note C).
3 Depreciation and amortization: Other relates to non-operating assets (assets not included in segment assets) and is allocated to segment EBIT as discussed above.
4 2020 EBIT: Other includes a $3.5 charge to write off stock associated with a prior year divestiture that filed bankruptcy in 2020.
96
Average assets for our segments are shown in the table below and reflect the basis for return measures used by management to evaluate segment performance. These segment totals include working capital (all current assets and current liabilities) plus net property, plant and equipment. Segment assets for all years are reflected at their estimated average for the year. Acquired companies’ long-lived assets as disclosed below include property, plant and equipment and other long-term assets.
| Year Ended December 31 | |||||||||||||||||
| Assets | Additions to Property, Plant and Equipment | Acquired Companies’ Long-Lived Assets | |||||||||||||||
| 2020 | |||||||||||||||||
| Bedding Products | $ | $ | $ | ||||||||||||||
| Specialized Products | |||||||||||||||||
| Furniture, Flooring & Textile Products | |||||||||||||||||
| Average current liabilities included in segment numbers above | |||||||||||||||||
| Unallocated assets and other | |||||||||||||||||
| Difference between average assets and year-end balance sheet | ( | ||||||||||||||||
| $ | $ | $ | |||||||||||||||
| 2019 | |||||||||||||||||
| Bedding Products | $ | $ | $ | ||||||||||||||
| Specialized Products | |||||||||||||||||
| Furniture, Flooring & Textile Products | |||||||||||||||||
| Average current liabilities included in segment numbers above | |||||||||||||||||
| Unallocated assets and other | |||||||||||||||||
| Difference between average assets and year-end balance sheet | ( | ||||||||||||||||
| $ | $ | $ | |||||||||||||||
| 2018 | |||||||||||||||||
| Bedding Products | $ | $ | $ | ||||||||||||||
| Specialized Products | |||||||||||||||||
| Furniture, Flooring & Textile Products | |||||||||||||||||
| Average current liabilities included in segment numbers above | |||||||||||||||||
| Unallocated assets and other | |||||||||||||||||
| Difference between average assets and year-end balance sheet | |||||||||||||||||
| $ | $ | $ | |||||||||||||||
97
Trade sales and tangible long-lived assets are presented below, based on the geography of manufacture.
| Year Ended December 31 | |||||||||||||||||
| 2020 | 2019 | 2018 | |||||||||||||||
| Trade sales | |||||||||||||||||
| Foreign sales | |||||||||||||||||
| Europe | $ | $ | $ | ||||||||||||||
| China | |||||||||||||||||
| Canada | |||||||||||||||||
| Mexico | |||||||||||||||||
| Other | |||||||||||||||||
| Total foreign sales | |||||||||||||||||
| United States | |||||||||||||||||
| Total trade sales | $ | $ | $ | ||||||||||||||
| Tangible long-lived assets | |||||||||||||||||
| Foreign tangible long-lived assets | |||||||||||||||||
| Europe | $ | $ | $ | ||||||||||||||
| China | |||||||||||||||||
| Canada | |||||||||||||||||
| Mexico | |||||||||||||||||
| Other | |||||||||||||||||
| Total foreign tangible long-lived assets | |||||||||||||||||
| United States | |||||||||||||||||
| Total tangible long-lived assets | $ | $ | $ | ||||||||||||||
98
G—Earnings Per Share
Basic and diluted earnings per share were calculated as follows:
| Year Ended December 31 | |||||||||||||||||
| 2020 | 2019 | 2018 | |||||||||||||||
| Earnings: | |||||||||||||||||
| Net earnings | $ | $ | $ | ||||||||||||||
| (Earnings) attributable to noncontrolling interest, net of tax | ( | ( | ( | ||||||||||||||
| Net earnings attributable to Leggett & Platt, Inc. common shareholders | $ | $ | $ | ||||||||||||||
| Weighted average number of shares (in millions): | |||||||||||||||||
| Weighted average number of common shares used in basic EPS | |||||||||||||||||
| Dilutive effect of stock-based compensation | |||||||||||||||||
| Weighted average number of common shares and dilutive potential common shares used in diluted EPS | |||||||||||||||||
| Basic and Diluted EPS: | |||||||||||||||||
| Basic EPS attributable to Leggett & Platt, Inc. common shareholders | $ | $ | $ | ||||||||||||||
| Diluted EPS attributable to Leggett & Platt, Inc. common shareholders | $ | $ | $ | ||||||||||||||
| Other information: | |||||||||||||||||
| Anti-dilutive shares excluded from diluted EPS computation | |||||||||||||||||
| Cash dividends declared per share | $ | $ | $ | ||||||||||||||
H—Accounts and Other Receivables
Initial adoption of new ASU
Effective January 1, 2020, we adopted “Financial Instruments—Credit Losses” (Topic 326), which amended the impairment model to require a forward-looking approach based on expected losses rather than incurred losses to estimate credit losses on certain types of financial instruments, including trade receivables. In accordance with guidance, the new standard was adopted using the modified retrospective approach as of the effective date; prior periods were not restated. The increase to the allowance for doubtful accounts, net of the deferred tax impact, was recorded as an adjustment to opening retained earnings.
99
The cumulative effect of applying Topic 326 to our Consolidated Balance Sheet was as follows:
| Balance at December 31, 2019 as Previously Reported | Topic 326 Adjustments | Balance at January 1, 2020 | |||||||||||||||
Trade receivables, net 1 | $ | $ | ( | $ | |||||||||||||
| Other current assets | |||||||||||||||||
| Net property, plant and equipment | |||||||||||||||||
| Total other assets | |||||||||||||||||
| Total assets | $ | $ | ( | $ | |||||||||||||
| Total current liabilities | $ | $ | $ | ||||||||||||||
Total long-term liabilities 2 | ( | ||||||||||||||||
| Retained earnings | ( | ||||||||||||||||
| Other equity | ( | ( | |||||||||||||||
| Total liabilities and equity | $ | $ | ( | $ | |||||||||||||
1 This adjustment is to increase our allowance for doubtful accounts for estimated expected credit losses on trade receivables over their contractual life.
2 This adjustment is to reflect a decrease in deferred income tax liability as a result of the change in the allowance for doubtful accounts.
Trade receivables are recorded at the invoiced amount and generally do not bear interest. Credit is also occasionally extended in the form of a note receivable to facilitate our customers' operating cycles. Other notes receivable are established in special circumstances, such as in partial payment for the sale of a business or to support other business opportunities. Other notes receivable generally bear interest at market rates commensurate with the corresponding credit risk on the date of the origination.
To determine our allowance for doubtful accounts under the new guidance, we are utilizing a pool approach to group our receivables with similar risk characteristics. Our pools correspond with our business units, which generally have similar terms, industry-specific conditions, and historical or expected loss patterns. Reserves are established for each pool based on their level of risk exposure. When credit deterioration occurs on a specific customer within a pool, we evaluate the receivable separately to estimate the expected credit loss based on the specific risk characteristics. Management reviews individual accounts and pools for factors such as the length of time that receivables are past due, the financial health of the companies involved, industry and macroeconomic considerations, and historical loss experience. A qualitative reserve is also established for any current macroeconomic conditions or reasonable and supportable forecasts that could impact the expected collectibility of all or a portion of our receivables portfolio.
Account balances are charged against the allowance when it is probable the receivable will not be recovered. Interest income is not recognized for nonperforming accounts that are placed on nonaccrual status. For accounts on nonaccrual status, any interest payments received are applied against the balance of the nonaccrual account.
100
Accounts and other receivables at December 31 consisted of the following:
| 2020 | 2019 | ||||||||||||||||||||||
| Current | Long-term | Current | Long-term | ||||||||||||||||||||
Trade accounts receivable 1 | $ | $ | $ | $ | |||||||||||||||||||
| Trade notes receivable | |||||||||||||||||||||||
| Total trade receivables | |||||||||||||||||||||||
Other notes receivable 1 | |||||||||||||||||||||||
| Taxes receivable, including income taxes | |||||||||||||||||||||||
| Other receivables | |||||||||||||||||||||||
Subtotal other receivables | |||||||||||||||||||||||
Total trade and other receivables | |||||||||||||||||||||||
| Allowance for doubtful accounts: | |||||||||||||||||||||||
Trade accounts receivable 1,2 | ( | ( | |||||||||||||||||||||
| Trade notes receivable | ( | ||||||||||||||||||||||
| Total trade receivables | ( | ( | |||||||||||||||||||||
Other notes receivable 1 | ( | ( | |||||||||||||||||||||
| Total allowance for doubtful accounts | ( | ( | ( | ( | |||||||||||||||||||
| Total net receivables | $ | $ | $ | $ | |||||||||||||||||||
1 The “Trade accounts receivable” and “Other notes receivable” line items above include $24.6 and $26.0 as of December 31, 2020 and December 31, 2019, respectively, from a customer in our Bedding Products segment who is experiencing financial difficulty and liquidity problems. This customer was placed on nonaccrual status in 2018, and became delinquent in quarterly interest payments in the first quarter of 2020. As a result, we first established a partial reserve for this customer in 2018 and fully reserved the balances for this customer in the first quarter of 2020. The reserve for this customer was $24.6 ($22.8 for the note and $1.8 for the trade receivable) at December 31, 2020, and $16.0 ($15.0 for the note and $1.0 for the trade receivable) at December 31, 2019.
2 In addition to the customer reserve discussed above, bad debt expense in 2020 was also impacted by pandemic-related economic declines. Although we have not experienced significant issues with customer payment performance during this time, the effects of the pandemic have adversely impacted the operations of many of our customers, which have and could further impact their ability to pay their debts to us. As a result, we increased the reserves on "Trade accounts receivable" to reflect this increased risk.
Activity related to the allowance for doubtful accounts is reflected below:
| Balance at December 31, 2018 | Add: Charges | Less: Net Charge-offs/(Recoveries) and Other | Balance at December 31, 2019 | Balance at January 1, 2020 | Add: Charges | Less: Net Charge-offs/(Recoveries) and Other | Balance at December 31, 2020 | ||||||||||||||||||||||||||||||||||||||||||||||
| Trade accounts receivable | $ | $ | $ | ( | $ | $ | $ | $ | $ | $ | |||||||||||||||||||||||||||||||||||||||||||
| Trade notes receivable | ( | ||||||||||||||||||||||||||||||||||||||||||||||||||||
| Total trade receivables | ( | ||||||||||||||||||||||||||||||||||||||||||||||||||||
| Other notes receivable | |||||||||||||||||||||||||||||||||||||||||||||||||||||
| Total allowance for doubtful accounts | $ | $ | $ | ( | $ | $ | $ | $ | $ | $ | |||||||||||||||||||||||||||||||||||||||||||
101
I—Supplemental Balance Sheet Information
Additional supplemental balance sheet details at December 31 consisted of the following:
| 2020 | 2019 | ||||||||||
| Sundry | |||||||||||
| $ | $ | ||||||||||
| Investment in associated companies | |||||||||||
| Other | |||||||||||
| $ | $ | ||||||||||
| Accrued expenses | |||||||||||
| $ | $ | ||||||||||
| Wages and commissions payable | |||||||||||
| Workers’ compensation, vehicle-related and product liability, medical/disability | |||||||||||
| Sales promotions | |||||||||||
| Accrued interest | |||||||||||
General taxes, excluding income taxes 1 | |||||||||||
| Environmental reserves | |||||||||||
| Other | |||||||||||
| $ | $ | ||||||||||
| Other current liabilities | |||||||||||
| Dividends payable | $ | $ | |||||||||
| Customer deposits | |||||||||||
| Sales tax payable | |||||||||||
| Outstanding checks in excess of book balances | |||||||||||
| Other | |||||||||||
| $ | $ | ||||||||||
| Other long-term liabilities | |||||||||||
| $ | $ | ||||||||||
| Deemed repatriation tax payable | |||||||||||
| Net reserves for tax contingencies | |||||||||||
| Deferred compensation | |||||||||||
Other 1 | |||||||||||
| $ | $ | ||||||||||
102
J—Long-Term Debt
In light of the potential impacts of COVID-19 on our businesses and the uncertainties associated with the duration of the pandemic at that time, we reviewed our debt covenants early in the second quarter 2020. On May 6, 2020, we amended our credit facility to, among other things, change the restrictive borrowing covenants. The prior leverage ratio covenant required us to maintain, as of the last day of each quarter, a leverage ratio of consolidated funded indebtedness to trailing 12-month consolidated EBITDA (each as defined in the credit facility) of not greater than 3.50 to 1.00.
The leverage ratio covenant was changed in two ways: (i) the calculation of the ratio now subtracts unrestricted cash (as defined in the credit facility) from consolidated funded indebtedness; and (ii) the ratio levels, calculated as of the last day of the applicable fiscal quarter, were changed to 4.75 to 1.00 for each fiscal quarter-end date through March 31, 2021; 4.25 to 1.00 at June 30, 2021; 3.75 to 1.00 at September 30, 2021; and 3.25 to 1.00 at December 31, 2021 and thereafter.
In addition, the amount of total secured debt limit was changed from 15 % to 5 % of our total consolidated assets until December 31, 2021, at which time it will revert back to 15 %. Various interest rate terms were also changed. The credit facility also contains an anti-cash hoarding provision that limits borrowing if the Company has a consolidated cash balance (as defined in the credit facility) in excess of $300.0 without planned expenditures. The maturity date of January 2024 remains unchanged. At December 31, 2020, the Company is in compliance with all of its debt covenants and expects to be able to maintain compliance with the amended debt covenant requirements.
103
Long-term debt, interest rates and due dates at December 31 are as follows:
| 2020 | 2019 | ||||||||||||||||||||||||||||||||||
| Year-end Interest Rate | Due Date Through | Balance | Year-end Interest Rate | Due Date Through | Balance | ||||||||||||||||||||||||||||||
Senior Notes 1 | % | 2022 | $ | % | 2022 | $ | |||||||||||||||||||||||||||||
Senior Notes 1 | % | 2024 | % | 2024 | |||||||||||||||||||||||||||||||
Senior Notes 1 | % | 2027 | % | 2027 | |||||||||||||||||||||||||||||||
Senior Notes 1 | % | 2029 | % | 2029 | |||||||||||||||||||||||||||||||
Term Loan 2 | % | 2024 | % | 2024 | |||||||||||||||||||||||||||||||
| Industrial development bonds, principally variable interest rates | % | 2030 | % | 2030 | |||||||||||||||||||||||||||||||
Commercial paper 3 | % | 2024 | % | 2024 | |||||||||||||||||||||||||||||||
| Finance leases (primarily vehicles) | |||||||||||||||||||||||||||||||||||
| Other, partially secured | |||||||||||||||||||||||||||||||||||
| Unamortized discounts and deferred loan cost | ( | ( | |||||||||||||||||||||||||||||||||
| Total debt | |||||||||||||||||||||||||||||||||||
| Less: current maturities | |||||||||||||||||||||||||||||||||||
| Total long-term debt | $ | $ | |||||||||||||||||||||||||||||||||
1 Senior Notes are unsecured and unsubordinated obligations. For each of the Senior Notes: (i) interest is paid semi-annually in arrears; (ii) principal is due at maturity with no sinking fund; and (iii) we may, at our option, at any time, redeem all or a portion of any of the debt at a make-whole redemption price equal to the greater of: (a) 100 % of the principal amount of the notes being redeemed; and (b) the sum of the present values of the remaining scheduled payments of principal and interest thereon, discounted to the date of redemption on a semi-annual basis (assuming a 360-day year consisting of twelve 30-day months) at a specified discount rate, determined by the terms of each respective note. The Senior Notes may also be redeemed by us within 90 days of maturity at 100 % of the principal amount plus accrued and unpaid interest, and we are required to offer to purchase such notes at 101 % of the principal amount, plus accrued and unpaid interest, if we experience a Change of Control Repurchase Event, as defined in the Senior Notes. Also, each respective Senior Note contains restrictive covenants, including a limitation on secured debt of 15 % of our consolidated assets, a limitation on sale and leaseback transactions, and a limitation on certain consolidations, mergers, and sales of assets.
2 In January 2019, we issued a $500.0 five-year Term Loan A with our current bank group. We pay quarterly principal installments of $12.5 through the maturity date of January 2024, at which time we will pay the remaining principal. Additional principal payments, including a complete early payoff, are allowed without penalty. As of December 31, 2020, we had repaid $195.0 , including prepayments on a portion of Term Loan A of $60.0 in the third quarter and $47.5 in the fourth quarter of 2020. The Term Loan A bears a variable interest rate as defined in the agreement and was 3.0 % at December 31, 2020. Interest is payable based upon a time interval that depends on the selection of interest rate period.
3 The weighted average interest rate for the net commercial paper activity during the years ended December 31, 2020 and 2019 was 2.0 % and 2.6 %, respectively.
Maturities are as follows:
| Year ended December 31 | |||||
| 2021 | $ | ||||
| 2022 | |||||
| 2023 | |||||
| 2024 | |||||
| 2025 | |||||
| Thereafter | |||||
| $ | |||||
104
In January 2019, we increased the size of the revolving facility from $800.0 to $1,200.0 (and increased permitted borrowings, subject to covenant restrictions, under our commercial paper program in a corresponding amount), added a five-year $500.0 term loan facility, and extended the term from 2022 to 2024.
Amounts outstanding at December 31 related to our commercial paper program were:
| 2020 | 2019 | ||||||||||
| Total program authorized | $ | $ | |||||||||
| Commercial paper outstanding (classified as long-term debt) | ( | ||||||||||
| Letters of credit issued under the credit facility | |||||||||||
| Total program usage | ( | ||||||||||
| Total program available | $ | $ | |||||||||
At December 31, 2019, subject to restrictive covenants, we could raise cash by issuing commercial paper through a program that is backed by a $1,200.0 revolving credit facility with a syndicate of 13 lenders. The credit facility allows us to issue total letters of credit up to $125.0 . When we issue letters of credit in this manner, our capacity under the revolving facility, and consequently, our ability to issue commercial paper, is reduced by a corresponding amount. We had no outstanding letters of credit under the facility at year end for the periods presented.
Generally, we may elect one of four types of borrowing under the revolving credit facility, which determines the rate of interest to be paid on the outstanding principal balance. The interest rate would typically be commensurate with the currency borrowed and the term of the borrowing, as well as either (i) a competitive variable or fixed rate, or (ii) various published rates plus a pre-defined spread.
We are required to periodically pay accrued interest on any outstanding principal balance under the revolving credit facility at different time intervals based upon the elected interest rate and the elected interest period. Any outstanding principal under this facility will be due upon the maturity date. We may also terminate or reduce the lending commitments under this facility, in whole or in part, upon three business days’ notice.
K—Lease Obligations
Initial adoption of new ASU
Effective January 1, 2019, we adopted ASU 2016-02 “Leases” (Topic 842), which requires the recognition of lease assets and liabilities for items classified as operating leases under previous guidance. As permitted under ASU 2018-11 “Targeted Improvements to ASC 842”, we elected to not restate comparative periods in transition. Adoption of the new standard resulted in the recording of additional net operating lease assets and lease liabilities of $135.9 and $135.8 , respectively, as of January 1, 2019. The difference between the additional lease assets and lease liabilities, net of the deferred tax impact, was recorded as an adjustment to retained earnings.
Lease Details
Substantially all our operating lease right-of-use assets and operating lease liabilities represent leases for certain operating facilities, warehouses, office space, trucking equipment, and various other assets. Finance lease balances represent substantially all our vehicle leases. We are not involved in any material sale and leaseback transactions, and our sublease arrangements were not material for the periods presented.
At the inception of a contract, we assess whether a contract is, or contains, a lease. Our assessment is based on whether the contract involves the use of a distinct identified asset, whether we obtain the right to substantially all the economic benefit of the asset, and whether we have the right to direct the use of the asset.
Our leases have remaining lease terms that expire at various dates through 2035, some of which include options to extend or terminate the leases at our discretion. Where renewal or termination options are reasonably likely to be exercised,
105
we recognize the option as part of the right-of-use asset and lease liability. Leases with an initial term of 12 months or less are not recorded on the balance sheet; we recognize lease expense for these leases on a straight-line basis over the lease term. Our lease agreements do not contain any material residual value guarantees or material restrictive covenants.
Both lease and non-lease components are accounted for as a single lease component, as we have elected to group lease and non-lease components for all leases.
As most of our leases do not provide an implicit rate, we use our incremental borrowing rate in determining the present value of the lease payments. We apply a portfolio approach for determining the incremental borrowing rate based on the applicable lease terms and the economic environment in the various regions where our operations are located.
At December 31, 2020, we had $2.1 of additional operating leases that had not yet commenced. These operating leases will commence in 2021 with average lease terms of 6 years.
Supplemental balance sheet information related to leases was as follows:
| December 31 | |||||||||||
| 2020 | 2019 | ||||||||||
| Operating leases: | |||||||||||
| Operating lease right-of-use assets | $ | $ | |||||||||
| Current portion of operating lease liabilities | |||||||||||
| Operating lease liabilities | |||||||||||
| Total operating lease liabilities | $ | $ | |||||||||
| Finance leases: | |||||||||||
| Sundry | $ | $ | |||||||||
| Current maturities of long-term debt | |||||||||||
| Long-term debt | |||||||||||
| Total finance lease liabilities | $ | $ | |||||||||
The components of lease expense were as follows:
| Year Ended December 31 | |||||||||||
| 2020 | 2019 | ||||||||||
| Operating lease costs: | |||||||||||
| Lease costs | $ | $ | |||||||||
| Variable lease costs | |||||||||||
| Total operating lease costs | $ | $ | |||||||||
| Short-term lease costs | $ | $ | |||||||||
| Finance lease costs: | |||||||||||
| Amortization of right-of-use assets | $ | $ | |||||||||
| Interest on lease liabilities | |||||||||||
| Total finance lease costs | $ | $ | |||||||||
| Total lease costs | $ | $ | |||||||||
106
Variable lease costs consist primarily of taxes, insurance, and common-area or other maintenance costs for our leased facilities and equipment, which are paid based on actual costs incurred by the lessor.
Supplemental cash flow information related to leases was as follows:
| Year Ended December 31 | |||||||||||
| 2020 | 2019 | ||||||||||
| Cash paid for amounts included in the measurement of lease liabilities: | |||||||||||
| Operating cash flows from operating leases | $ | $ | |||||||||
| Operating cash flows from finance leases | |||||||||||
| Financing cash flows from finance leases | |||||||||||
| Right-of-use assets obtained in exchange for new operating lease liabilities | |||||||||||
| Right-of-use assets obtained in exchange for new finance lease liabilities | |||||||||||
In connection with the ECS transaction discussed in Note R, we acquired operating right-of-use assets in 2019 of approximately $24.0 (including a favorable lease position of $2.4 ). The operating lease liability associated with these right-of-use assets was approximately $21.6 . Finance right-of-use assets acquired in the ECS transaction and the related finance lease liabilities were immaterial.
The following table reconciles the undiscounted cash flows for the operating and finance leases at December 31, 2020 to the operating and finance lease liabilities recorded on the Consolidated Balance Sheets:
| December 31, 2020 | |||||||||||
| Operating Leases | Finance Leases | ||||||||||
| 2021 | $ | $ | |||||||||
| 2022 | |||||||||||
| 2023 | |||||||||||
| 2024 | |||||||||||
| 2025 | |||||||||||
| Thereafter | |||||||||||
| Total | |||||||||||
| Less: Interest | |||||||||||
| Lease Liability | $ | $ | |||||||||
| Weighted average remaining lease term (years) | |||||||||||
| Weighted average discount rate | % | % | |||||||||
L—Stock-Based Compensation
We use various forms of share-based compensation which are summarized below. One stock unit is equivalent to one common share for accounting and earnings-per-share purposes. Shares are issued from treasury for the majority of our stock plans’ activity. All share information is presented in millions.
Stock options and stock units are granted pursuant to our Flexible Stock Plan (the "Plan"). Each option counts as one share against the shares available under the Plan, but each share granted for any other awards will count as three shares against the Plan.
107
At December 31, 2020, the following common shares were authorized for issuance under the Plan:
| Shares Available for Issuance | Maximum Number of Authorized Shares | ||||||||||
| Unexercised options | |||||||||||
| Outstanding stock units—vested | |||||||||||
| Outstanding stock units—unvested | |||||||||||
| Available for grant | |||||||||||
| Authorized for issuance at December 31, 2020 | |||||||||||
| Year Ended December 31 | |||||||||||||||||||||||||||||||||||
| 2020 | 2019 | 2018 | |||||||||||||||||||||||||||||||||
| To Be Settled With Stock | To Be Settled In Cash | To Be Settled With Stock | To Be Settled In Cash | To Be Settled With Stock | To Be Settled In Cash | ||||||||||||||||||||||||||||||
Stock-based retirement plans contributions 2 | $ | $ | $ | $ | $ | $ | |||||||||||||||||||||||||||||
| Discounts on various stock awards: | |||||||||||||||||||||||||||||||||||
Deferred Stock Compensation Program 1 | |||||||||||||||||||||||||||||||||||
Stock-based retirement plans 2 | |||||||||||||||||||||||||||||||||||
Discount Stock Plan 6 | |||||||||||||||||||||||||||||||||||
Performance Stock Unit (PSU) awards: 3 | |||||||||||||||||||||||||||||||||||
2018 and later PSU - TSR based 3A | ( | ||||||||||||||||||||||||||||||||||
2018 and later PSU - EBIT CAGR based 3B | ( | ( | |||||||||||||||||||||||||||||||||
2017 and prior PSU awards 3C | ( | ||||||||||||||||||||||||||||||||||
Profitable Growth Incentive (PGI) awards 4 | |||||||||||||||||||||||||||||||||||
Restricted Stock Units (RSU) awards 5 | |||||||||||||||||||||||||||||||||||
| Other, primarily non-employee directors restricted stock | |||||||||||||||||||||||||||||||||||
| Total stock-related compensation expense (income) | $ | ( | $ | $ | |||||||||||||||||||||||||||||||
| Employee contributions for above stock plans | |||||||||||||||||||||||||||||||||||
| Total stock-based compensation | $ | $ | $ | ||||||||||||||||||||||||||||||||
| Tax benefits on stock-based compensation expense | $ | $ | $ | ||||||||||||||||||||||||||||||||
| Tax benefits on stock-based compensation payments (As discussed below, we elected to pay selected awards in cash during 2018.) | |||||||||||||||||||||||||||||||||||
| Total tax benefits associated with stock-based compensation | $ | $ | $ | ||||||||||||||||||||||||||||||||
108
The following table recaps the impact of stock-based compensation on assets and liabilities for each of the periods presented:
| 2020 | 2019 | ||||||||||||||||||||||||||||||||||
| Current | Long-term | Total | Current | Long-term | Total | ||||||||||||||||||||||||||||||
| Assets: | |||||||||||||||||||||||||||||||||||
Diversified investments associated with the Executive Stock Unit Program 2 | $ | $ | $ | $ | $ | $ | |||||||||||||||||||||||||||||
| Liabilities: | |||||||||||||||||||||||||||||||||||
Executive Stock Unit Program 2 | $ | $ | $ | $ | $ | $ | |||||||||||||||||||||||||||||
Performance Stock Unit (TSR) award 3A | |||||||||||||||||||||||||||||||||||
Performance Stock Unit (EBIT) award 3B | |||||||||||||||||||||||||||||||||||
| Other - primarily timing differences between employee withholdings and related employer contributions to be submitted to various plans' trust accounts | |||||||||||||||||||||||||||||||||||
| Total liabilities associated with stock-based compensation | $ | $ | $ | $ | $ | $ | |||||||||||||||||||||||||||||
1 Stock Option Grants
We have granted stock options in conjunction with our Deferred Compensation Program to senior executives on a discretionary basis, and historically to a broad group of employees.
Deferred Compensation Program
We offer a Deferred Compensation Program under which key managers and outside directors may elect to receive stock options, stock units, or interest-bearing cash deferrals in lieu of cash compensation:
•Stock options under this program are granted in the last month of the year prior to the year the compensation is earned. The number of options granted equals the deferred compensation times five, divided by the stock’s market price on the date of grant. The option has a 10 -year term. It vests as the associated compensation is earned and becomes exercisable beginning 15 months after the grant date. Stock is issued when the option is exercised.
•Deferred stock units (DSU) under this program are acquired every two weeks (when the compensation would have otherwise been paid) at a 20 % discount to the market price of our common stock on each acquisition date, and they vest immediately. Expense is recorded as the compensation is earned. Stock units earn dividends at the same rate as cash dividends paid on our common stock. These dividends are used to acquire stock units at a 20 % discount. Stock units are converted to common stock and distributed in accordance with the participant’s pre-set election. However, stock units may be settled in cash, but only if there is not a sufficient amount of shares reserved for future issuance under the Flexible Stock Plan. Participants must begin receiving distributions no later than 10 years after the effective date of the deferral, and installment distributions cannot exceed 10 years.
•Interest-bearing cash deferrals under this program are reported in "Other long-term liabilities" on the Consolidated Balance Sheets and are disclosed in Note I.
| Options | Units | Cash | |||||||||||||||
| Aggregate amount of compensation deferred during 2020 | $ | $ | $ | ||||||||||||||
109
Options granted to a broad group of employees on a discretionary basis
Options are generally offered only in conjunction with the Deferred Compensation Program discussed above. We occasionally grant options to senior executives in connection with promotions or retention purposes, and prior to 2013, we granted stock options annually on a discretionary basis to a broad group of employees. Those options have a maximum term of 10 years and exercise prices equal to Leggett’s closing stock price on the grant date.
Grant date fair values are calculated using the Black-Scholes option pricing model and are amortized by the straight-line method over the options’ total vesting period (typically three years ), except for employees who are retirement eligible. Expense for employees who are retirement eligible is recognized immediately.
Stock Option Summary
Stock option information for the plans discussed above is as follows:
| Total Stock Options | Weighted Average Exercise Price per Share | Weighted Average Remaining Contractual Life in Years | Aggregate Intrinsic Value | ||||||||||||||||||||
| Outstanding at December 31, 2019 | $ | ||||||||||||||||||||||
| Granted | |||||||||||||||||||||||
| Exercised | ( | ||||||||||||||||||||||
| Outstanding at December 31, 2020 | $ | $ | |||||||||||||||||||||
| Vested or expected to vest | $ | $ | |||||||||||||||||||||
| Exercisable (vested) at December 31, 2020 | $ | $ | |||||||||||||||||||||
Additional information related to stock option activity for the periods presented is as follows:
| Year Ended December 31 | |||||||||||||||||
| 2020 | 2019 | 2018 | |||||||||||||||
| Total intrinsic value of stock options exercised | $ | $ | $ | ||||||||||||||
| Cash received from stock options exercised | |||||||||||||||||
| Total fair value of stock options vested | |||||||||||||||||
The following table summarizes fair values calculated (and assumptions utilized) using the Black-Scholes option pricing model.
| Year Ended December 31 | ||||||||||||||||||||
| 2020 | 2019 | 2018 | ||||||||||||||||||
| Aggregate grant date fair value | $ | $ | $ < | |||||||||||||||||
| Weighted-average per share grant date fair value | ||||||||||||||||||||
| Risk-free interest rate | % | % | % | |||||||||||||||||
| Expected life in years | ||||||||||||||||||||
| Expected volatility (over expected life) | % | % | % | |||||||||||||||||
| Expected dividend yield (over expected life) | % | % | % | |||||||||||||||||
The risk-free rate is determined based on U.S. Treasury yields in effect at the time of grant for maturities equivalent to the expected life of the option. The expected life of the option (estimated average period of time the option will be outstanding) is estimated based on the historical exercise behavior of employees, with executives displaying somewhat longer holding periods than other employees. Expected volatility is based on historical volatility through the grant date, measured daily for a time period equal to the option’s expected life. The expected dividend yield is estimated based on the dividend yield at the time of grant.
110
2 Stock-Based Retirement Plans
Prior to 2019, we had two stock-based retirement plans: the tax-qualified Stock Bonus Plan (SBP) for non-highly compensated employees, and the non-qualified Executive Stock Unit Program (ESUP) for highly compensated employees. We made matching contributions to both plans. In addition to the automatic 50 % match, we would make another matching contribution of up to 50 % of the employee’s contributions for the year if certain profitability levels, as defined in the SBP and the ESUP, were obtained.
For 2019 and thereafter, the provisions of the ESUP are unchanged. We merged the SBP with the Leggett & Platt, Incorporated 401(k) Plan and Trust Agreement (401(k) Plan) on December 31, 2018 (see Note M). After the merger, our common stock was added to the 401(k) Plan as an investment option, and participants may elect up to 20 % of their contributions into our common stock beginning on January 1, 2019. Previously, participants could contribute up to 100 % of their contributions into our common stock.
Participants in the ESUP may contribute up to 10 % (depending upon certain qualifications) of their compensation above the threshold. Participant contributions are credited to a diversified investment account established for the participant, and we make premium contributions to the diversified investment accounts equal to 17.65 % of the participant’s contribution. A participant’s diversified investment account balance is adjusted to mirror the investment experience, whether positive or negative, of the diversified investments selected by the participant. Participants may change investment elections in the diversified investment accounts, but cannot purchase Company common stock or stock units. The diversified investment accounts consist of various mutual funds and retirement target funds and are unfunded, unsecured obligations of the Company that will be settled in cash. Both the assets and liabilities associated with this program are presented in the table above and are adjusted to fair value at each reporting period.
Company matching contributions to the ESUP, including dividend equivalents, are used to acquire stock units at 85 % of the common stock market price on the acquisition date. Stock units are converted to common stock at a 1-to-1 ratio upon distribution from the program and may be settled in cash but only if there is not a sufficient amount of shares reserved for future issuance under the Flexible Stock Plan.
Company matches in the ESUP fully vest upon five years of cumulative service, subject to certain participation requirements. Distributions are triggered by an employee’s retirement, death, disability, or separation from Leggett.
In 2020, employee contributions were $3.9 , and employer premium contributions to diversified investment accounts were $.7 . See the stock-based compensation table above for information regarding employer contributions.
Details regarding stock unit activity for the ESUP plan are reflected in the stock units summary table below.
3 PSU Awards
Starting in 2020 the long-term incentive awards were split between PSUs and RSUs. For executive officers, the split was two thirds PSUs and one third RSUs. For other selected participants, the award was granted at either half PSUs and half RSUs or 100 % RSUs.
PSU awards have a component based on relative Total Shareholder Return (TSR = (Change in Stock Price + Dividends) / Beginning Stock Price) and another component based on EBIT Compound Annual Growth Rate (CAGR). These components are discussed below.
We intend to pay 50 % in shares of our common stock and 50 % in cash; although, we reserve the right, subject to Compensation Committee approval, to pay up to 100 % in cash.
Cash settlements are recorded as a liability and adjusted to fair value at each reporting period. We elected to pay 100 % of the 2015 award (paid in the first quarter 2018) in cash.
111
3A 2018 and Later PSU - TSR Based
Most of the PSU awards are based 50 % upon our TSR compared to a peer group. A small number of PSU awards are based 100 % upon relative TSR for certain business unit employees to complement their particular mix of incentive compensation. Grant date fair values are calculated using a Monte Carlo simulation of stock and volatility data for Leggett and each of the peer companies. Grant date fair values are amortized using the straight-line method over the three-year vesting period.
The relative TSR vesting condition of the 2018 and later PSU award contains the following conditions:
•A service requirement—Awards generally “cliff” vest three years following the grant date; and
•A market condition—Awards are based on our TSR as compared to the TSR of a group of peer companies. The peer group consists of all the companies in the Industrial, Materials and Consumer Discretionary sectors of the S&P 500 and S&P Midcap 400 (approximately 300 companies). Participants will earn from 0 % to 200 % of the base award depending upon how our TSR ranks within the peer group at the end of the three-year performance period.
3B 2018 and Later PSU - EBIT CAGR Based
Most of the PSU awards are based 50 % upon our or the applicable segment's EBIT CAGR. Grant date fair values are calculated using the grant date stock price discounted for dividends over the vesting period. Expense is adjusted every quarter over the three-year vesting period based on the number of shares expected to vest.
The EBIT CAGR portion of this award contains the following conditions:
•A service requirement—Awards generally “cliff” vest three years following the grant date; and
•A performance condition—Awards are based on achieving specified EBIT CAGR performance targets for our or the applicable segment's EBIT during the third year of the performance period compared to EBIT during the fiscal year immediately preceding the performance period. Participants will earn from 0 % to 200 % of the base award.
In connection with the decision to move a significant portion of the long-term incentive opportunity from a two-year to a three-year performance period by eliminating PGI awards, in February 2018, we also granted participants a one-time transition PSU award, based upon EBIT CAGR over a two-year performance period. This award was paid in the first quarter 2020. Average payout percentage of base award was 114 %, and the number of shares paid was .1 . The cash portion payout was $4.1 .
3C 2017 and Prior PSU Awards
The 2017 award was paid out in 2020. The 2017 and prior PSU awards were based solely on relative TSR. Vesting conditions were the same as (3A) above, other than a maximum payout of 175 % of the base award.
112
Below is a summary of shares and grant date fair value related to PSU awards for the periods presented:
| Year Ended December 31 | |||||||||||||||||
| 2020 | 2019 | 2018 | |||||||||||||||
| TSR Based | |||||||||||||||||
| Total shares base award | |||||||||||||||||
| Grant date per share fair value | $ | $ | $ | ||||||||||||||
| Risk-free interest rate | % | % | % | ||||||||||||||
| Expected life in years | |||||||||||||||||
| Expected volatility (over expected life) | % | % | % | ||||||||||||||
| Expected dividend yield (over expected life) | % | % | % | ||||||||||||||
| EBIT CAGR Based | |||||||||||||||||
| Total shares base award | |||||||||||||||||
| Grant date per share fair value | $ | $ | $ | ||||||||||||||
| Vesting period in years | |||||||||||||||||
| Three-Year Performance Cycle for PSU - TSR Based | ||||||||||||||||||||||||||||||||||||||
| Award Year | Completion Date | TSR Performance Relative to the Peer Group (1%=Best) | Payout as a Percent of the Base Award | Number of Shares Distributed | Cash Portion | Distribution Date | ||||||||||||||||||||||||||||||||
| 2016 | December 31, 2018 | th percentile | $ | First quarter 2019 | ||||||||||||||||||||||||||||||||||
| 2017 | December 31, 2019 | rd percentile | $ | First quarter 2020 | ||||||||||||||||||||||||||||||||||
| 2018 | December 31, 2020 | th percentile | < | $ | First quarter 2021 | |||||||||||||||||||||||||||||||||
| Three-Year Performance Cycle for PSU - EBIT CAGR Based | |||||||||||||||||||||||||||||||||||
| Award Year | Completion Date | Payout as a Percent of the Base Award | Number of Shares Distributed | Cash Portion | Distribution Date | ||||||||||||||||||||||||||||||
| 2018 | December 31, 2020 | < | $ | First quarter 2021 | |||||||||||||||||||||||||||||||
4 PGI Awards
In 2017 and prior years, certain key management employees participated in a PGI program, which was replaced in 2018 with the PSU-EBIT CAGR award discussed above. As of the first quarter 2019, all PGI awards have been paid out. The PGI awards vested (0 % to 250 %) at the end of a two-year performance period based on our, or the applicable profit center's, revenue growth (adjusted by a GDP factor when applicable) and EBITDA margin at the end of a two-year performance period. We paid the 2017 award half in shares of our common stock and half in cash. We elected to pay the 2016 award (paid in the first quarter of 2018) in cash. Both components were adjusted to fair value at each reporting period.
| Two-Year Performance Cycle | ||||||||||||||||||||||||||||||||
| Award Year | Completion Date | Average Payout as a Percent of the Base Award | Estimated Number of Shares | Cash Portion | Distribution Date | |||||||||||||||||||||||||||
| 2016 | December 31, 2017 | $ | First quarter 2018 | |||||||||||||||||||||||||||||
| 2017 | December 31, 2018 | < | $ | First quarter 2019 | ||||||||||||||||||||||||||||
113
5 Restricted Stock Unit Awards
Starting in 2020, the RSU award was amended so that those who retire (1) after age 65 or (2) after the date where the participant’s age plus years of service are greater than or equal to 70 years, will continue to receive shares that will vest after the retirement date. Expense associated with these retirement-eligible employees is recognized immediately at the RSU grant date. For those employees who become retirement eligible after the grant date, any remaining RSU expense is recognized at the date the employee meets the retirement-eligible criteria.
RSU awards are generally granted as follows:
•Annual awards to selected managers;
•On a discretionary basis to selected employees; and
•As compensation for outside directors
Starting in 2020 RSUs are granted as part of the long-term incentive awards, along with PSUs, to executive officers and other selected participants as discussed in the PSU Awards section above.
The value of these awards is determined by the stock price on the day of the award, and expense is recognized over the vesting period, except for retirement-eligible employees that are expensed as they become retirement eligible.
Stock Units Summary
As of December 31, 2020, the unrecognized cost of non-vested stock units that is not adjusted to fair value was $5.1 with a weighted-average remaining contractual life of one year .
Stock unit information for the plans discussed above is presented in the table below:
| DSU | ESUP | PSU* | RSU | Total Units | Weighted Average Grant Date Fair Value per Unit | Aggregate Intrinsic Value | |||||||||||||||||||||||||||||||||||
| Unvested at December 31, 2019 | $ | ||||||||||||||||||||||||||||||||||||||||
| Granted based on current service | |||||||||||||||||||||||||||||||||||||||||
| Granted based on future conditions | |||||||||||||||||||||||||||||||||||||||||
| Vested | ( | ( | ( | ( | ( | ||||||||||||||||||||||||||||||||||||
| Forfeited | ( | ( | |||||||||||||||||||||||||||||||||||||||
| Unvested at December 31, 2020 | $ | $ | |||||||||||||||||||||||||||||||||||||||
| Fully vested shares available for issuance at December 31, 2020 | $ | ||||||||||||||||||||||||||||||||||||||||
*PSU awards are presented at maximum payout of 200 %
| Year Ended December 31 | |||||||||||||||||
| 2020 | 2019 | 2018 | |||||||||||||||
| Total intrinsic value of vested stock units converted to common stock | $ | $ | $ | ||||||||||||||
6 Discount Stock Plan
Under the Discount Stock Plan (DSP), a tax-qualified §423 stock purchase plan, eligible employees may purchase shares of Leggett common stock at 85 % of the closing market price on the last business day of each month. Shares are purchased and issued on the last business day of each month and generally cannot be sold or transferred for one year .
114
| Average 2020 purchase price per share (net of discount) | $ | ||||
| 2020 number of shares purchased by employees | |||||
| Shares purchased since inception in 1982 | |||||
| Maximum shares under the plan | |||||
M—Employee Benefit Plans
The Consolidated Balance Sheets reflect a net liability for the funded status of our domestic and foreign defined benefit pension plans as of all periods presented. Our U.S. plans (comprised primarily of three significant plans) represent approximately 84 % of our pension benefit obligation in each of the periods presented. Participants in one of the significant domestic plans have stopped earning benefits; this plan is referred to as our Frozen Plan in the following narrative.
A summary of our pension obligations and funded status as of December 31 is as follows:
| 2020 | 2019 | 2018 | |||||||||||||||
| Change in benefit obligation | |||||||||||||||||
| Benefit obligation, beginning of period | $ | $ | $ | ||||||||||||||
| Service cost | |||||||||||||||||
| Interest cost | |||||||||||||||||
| Plan participants’ contributions | |||||||||||||||||
Actuarial loss (gain)1 | ( | ||||||||||||||||
| Benefits paid | ( | ( | ( | ||||||||||||||
| Plan amendments | ( | ||||||||||||||||
| Foreign currency exchange rate changes | ( | ||||||||||||||||
| Benefit obligation, end of period | |||||||||||||||||
| Change in plan assets | |||||||||||||||||
| Fair value of plan assets, beginning of period | |||||||||||||||||
| Actual return (loss) on plan assets | ( | ||||||||||||||||
| Employer contributions | |||||||||||||||||
| Plan participants’ contributions | |||||||||||||||||
| Benefits paid | ( | ( | ( | ||||||||||||||
| Foreign currency exchange rate changes | ( | ||||||||||||||||
| Fair value of plan assets, end of period | |||||||||||||||||
| Net funded status | $ | ( | $ | ( | $ | ( | |||||||||||
| Funded status recognized in the Consolidated Balance Sheets | |||||||||||||||||
| Other assets—sundry | $ | $ | $ | ||||||||||||||
| Other current liabilities | ( | ( | ( | ||||||||||||||
| Other long-term liabilities | ( | ( | ( | ||||||||||||||
| Net funded status | $ | ( | $ | ( | $ | ( | |||||||||||
1 Year-over-year fluctuations in "Actuarial loss (gain)" are primarily driven by changes in the weighted average discount rate assumptions.
Our accumulated benefit obligation was not materially different from our projected benefit obligation for the periods presented.
Included in the above plans is a subsidiary’s unfunded supplemental executive retirement plan. This is a non-qualified plan, and these benefits are secured by insurance policies that are not included in the plan’s assets. Cash surrender values associated with these policies were approximately $2.6
115
Comprehensive Income
Amounts and activity included in accumulated other comprehensive income associated with pensions are reflected below:
| December 31, 2019 | 2020 Amortization | 2020 Net Actuarial Loss | 2020 Foreign Currency Exchange Rates Change | 2020 Income Tax Change | December 31, 2020 | ||||||||||||||||||||||||||||||
| Net loss (gain) (before tax) | $ | $ | ( | $ | $ | $ | $ | ||||||||||||||||||||||||||||
| Deferred income taxes | ( | ( | ( | ||||||||||||||||||||||||||||||||
| Accumulated other comprehensive (income) loss (net of tax) | $ | $ | ( | $ | $ | $ | ( | $ | |||||||||||||||||||||||||||
Net Pension (Expense) Income
Components of net pension (expense) income for the years ended December 31 were as follows:
| 2020 | 2019 | 2018 | |||||||||||||||
| Service cost | $ | ( | $ | ( | $ | ( | |||||||||||
| Interest cost | ( | ( | ( | ||||||||||||||
| Expected return on plan assets | |||||||||||||||||
| Recognized net actuarial loss | ( | ( | ( | ||||||||||||||
| Prior service cost | ( | ||||||||||||||||
| Net pension expense | $ | ( | $ | ( | $ | ( | |||||||||||
| Weighted average assumptions for pension costs: | |||||||||||||||||
| Discount rate used in net pension costs | % | % | % | ||||||||||||||
| Rate of compensation increase used in pension costs | % | % | % | ||||||||||||||
| Expected return on plan assets | % | % | % | ||||||||||||||
| Weighted average assumptions for benefit obligation: | |||||||||||||||||
| Discount rate used in benefit obligation | % | % | % | ||||||||||||||
| Rate of compensation increase used in benefit obligation | % | % | % | ||||||||||||||
Assumptions used for U.S. and international plans were not significantly different.
The components of net pension expense other than the service cost component are included in the line item "Other (income) expense, net" in the Consolidated Statements of Operations.
We use the average of a Pension Liability Index rate and a 10+ year AAA-AA US Corporate Index rate to determine the discount rate used for our significant pension plans (rounded to the nearest 25 basis points). The Pension Liability Index rate is a calculated rate using yearly spot rates matched against expected future benefit payments. The 10+ year AAA-AA US Corporate Index rate is based on the weighted average yield of a portfolio of high-grade Corporate Bonds with an average duration approximating the plans’ projected benefit payments. The discount rates used for our other, primarily foreign, plans are based on rates appropriate for the respective country and the plan obligations.
The overall, expected long-term rate of return is based on each plan’s historical experience and our expectations of future returns based upon each plan’s investment holdings, as discussed below.
116
Pension Plan Assets
The fair value of our major categories of pension plan assets is disclosed below using a three-level valuation hierarchy that separates fair value valuation techniques into the following categories:
•Level 1: Quoted prices for identical assets or liabilities in active markets.
•Level 2: Other significant inputs observable either directly or indirectly (including quoted prices for similar securities, interest rates, yield curves, credit risk, etc.).
•Level 3: Unobservable inputs that are not corroborated by market data.
Presented below are our major categories of investments for the periods presented:
| Year Ended December 31, 2020 | Year Ended December 31, 2019 | ||||||||||||||||||||||||||||||||||||||||||||||||||||||||||
| Level 1 | Level 2 | Level 3 | Assets Measured at NAV1 | Total | Level 1 | Level 2 | Level 3 | Assets Measured at NAV1 | Total | ||||||||||||||||||||||||||||||||||||||||||||||||||
| Mutual and pooled funds | |||||||||||||||||||||||||||||||||||||||||||||||||||||||||||
| Fixed income | $ | $ | $ | $ | — | $ | $ | $ | $ | $ | — | $ | |||||||||||||||||||||||||||||||||||||||||||||||
| Equities | — | — | |||||||||||||||||||||||||||||||||||||||||||||||||||||||||
| Stable value funds | — | — | |||||||||||||||||||||||||||||||||||||||||||||||||||||||||
| Money market funds, cash and other | |||||||||||||||||||||||||||||||||||||||||||||||||||||||||||
| Total investments at fair value | $ | $ | $ | $ | $ | $ | $ | $ | $ | $ | |||||||||||||||||||||||||||||||||||||||||||||||||
1Certain investments that are measured at fair value using the net asset value (NAV) per share (or its equivalent) practical expedient have not been classified in the fair value hierarchy.
Plan assets are invested in diversified portfolios of equity, debt and government securities, as well as a stable value fund. The aggregate allocation of these investments is as follows:
| 2020 | 2019 | ||||||||||
| Asset Category | |||||||||||
| Equity securities | % | % | |||||||||
| Debt securities | |||||||||||
| Stable value funds | |||||||||||
| Other, including cash | |||||||||||
| Total | % | % | |||||||||
Our investment policy and strategies are established with a long-term view in mind. We strive for a sufficiently diversified asset mix to minimize the risk of a material loss to the portfolio value due to the devaluation of any single investment. In determining the appropriate asset mix, our financial strength and ability to fund potential shortfalls that might result from poor investment performance are considered. The assets in our Frozen Plan employ a liability-driven investment strategy and have a target allocation of 60 % fixed income and 40 % equities. The remaining two significant plans have a target allocation of 75 % equities and 25 % fixed income, as historical equity returns have tended to exceed bond returns over the long term.
Assets of our domestic plans represent the majority of plan assets and are allocated to seven different investments.
117
•U.S. Total Stock Market Index: Large-, mid-, and small-cap equity diversified across growth and value styles.
•U.S. Large-Cap Index: Large-cap equity diversified across growth and value styles.
•U.S. Small-Cap Index: Small-cap equity utilizing value style.
•World ex US Index: International equity; broad exposure across developed and emerging non-U.S. equity markets.
•Long-term Bond Index: Diversified exposure to the long-term, investment-grade U.S. bond market.
•Extended Duration Treasury Index: Diversified exposure to U.S. treasuries with maturities of 20 -30 years.
The stable value fund consists of a fixed income portfolio offering consistent return and protection against interest rate volatility.
Future Contributions and Benefit Payments
We expect to contribute approximately $4.0 to our defined benefit pension plans in 2021.
Estimated benefit payments expected over the next 10 years are as follows:
| 2021 | $ | ||||
| 2022 | |||||
| 2023 | |||||
| 2024 | |||||
| 2025 | |||||
| 2026-2030 | |||||
Defined Contribution Plans
Total expense for defined contribution plans was as follows:
| 2020 | 2019 | 2018 | |||||||||||||||
| 401(k) Plan | $ | $ | $ | ||||||||||||||
| Other defined contribution plans | |||||||||||||||||
| $ | $ | $ | |||||||||||||||
Expense for our 401(k) Plan increased in 2019, primarily due to the December 31, 2018 merger of the SBP and 401(k) Plan, as discussed in Note L, and the implementation of automatic enrollment features (effective January 1, 2019).
Multi-employer Pension Plans
118
N—Income Taxes
The components of earnings before income taxes are as follows:
| Year Ended December 31 | |||||||||||||||||
| 2020 | 2019 | 2018 | |||||||||||||||
| Domestic | $ | $ | $ | ||||||||||||||
| Foreign | |||||||||||||||||
| $ | $ | $ | |||||||||||||||
Income tax expense is comprised of the following components:
| Year Ended December 31 | |||||||||||||||||
| 2020 | 2019 | 2018 | |||||||||||||||
| Current | |||||||||||||||||
| Federal | $ | $ | $ | ||||||||||||||
| State and local | |||||||||||||||||
| Foreign | |||||||||||||||||
| Deferred | |||||||||||||||||
| Federal | ( | ||||||||||||||||
| State and local | ( | ( | |||||||||||||||
| Foreign | ( | ( | ( | ||||||||||||||
| ( | ( | ||||||||||||||||
| $ | $ | $ | |||||||||||||||
Income tax expense, as a percentage of earnings before income taxes, differs from the statutory federal income tax rate as follows:
| Year Ended December 31 | |||||||||||||||||
| 2020 | 2019 | 2018 | |||||||||||||||
| Statutory federal income tax rate | % | % | % | ||||||||||||||
| Increases (decreases) in rate resulting from: | |||||||||||||||||
| State taxes, net of federal benefit | |||||||||||||||||
| Tax effect of foreign operations | ( | ( | ( | ||||||||||||||
| Global intangible low-taxed income | ( | ||||||||||||||||
| Current and deferred foreign withholding taxes | |||||||||||||||||
| Stock-based compensation | ( | ( | ( | ||||||||||||||
| Change in valuation allowance | ( | ||||||||||||||||
| Change in uncertain tax positions, net | ( | ( | |||||||||||||||
| Goodwill impairment | |||||||||||||||||
| Other permanent differences, net | ( | ( | ( | ||||||||||||||
| Other, net | ( | ( | ( | ||||||||||||||
| Effective tax rate | % | % | % | ||||||||||||||
For all periods presented, the tax rate benefited from income earned in various foreign jurisdictions at rates lower than the U.S. federal statutory rate, primarily related to China, Croatia, and Luxembourg.
In 2020, we recognized tax expense of $13.0 , related to foreign withholding taxes of $8.9 , a non-deductible goodwill impairment associated with our Hydraulic Cylinders reporting unit of $5.3 , and a Korean audit settlement of $3.2 . These expenses were partially offset by prior year tax benefits totaling $3.9 from the Global Intangible Low-Taxed Income (GILTI) high-tax exception final regulations issued in 2020, and other net benefits of $.5 .
119
In 2019, we recognized tax expense of $12.9 , primarily related to GILTI of $9.3 and other net tax expenses of $3.6 .
In 2018, our rate benefited by $2.3 , primarily related to the net reduction of valuation allowances of $7.8 and other net benefits totaling $9.1 , including measurement period adjustments. These benefits were offset by tax expenses recorded in 2018 totaling $14.6 related to current and deferred foreign withholding taxes.
We file tax returns in each jurisdiction where we are required to do so. In these jurisdictions, a statute of limitations period exists. After a statute period expires, the tax authorities can no longer assess additional income tax for the expired period. In addition, once the statute expires we are no longer eligible to file claims for refund for any tax that we may have overpaid.
Unrecognized Tax Benefits
The total amount of our gross unrecognized tax benefits at December 31, 2020 was $6.9 , of which $5.3 would impact our effective tax rate, if recognized. A reconciliation of the beginning and ending balance of our gross unrecognized tax benefits for the periods presented is as follows:
| 2020 | 2019 | 2018 | |||||||||||||||
| Gross unrecognized tax benefits, January 1 | $ | $ | $ | ||||||||||||||
Gross increases—tax positions in prior periods 1 | |||||||||||||||||
| Gross decreases—tax positions in prior periods | ( | ( | ( | ||||||||||||||
| Gross increases—current period tax positions | |||||||||||||||||
| Change due to exchange rate fluctuations | ( | ||||||||||||||||
Settlements 1 | ( | ||||||||||||||||
| Lapse of statute of limitations | ( | ( | ( | ||||||||||||||
| Gross unrecognized tax benefits, December 31 | |||||||||||||||||
| Interest | |||||||||||||||||
| Penalties | |||||||||||||||||
| Total gross unrecognized tax benefits, December 31 | $ | $ | $ | ||||||||||||||
We recognize interest and penalties related to unrecognized tax benefits as part of income tax expense in the Consolidated Statements of Operations, which is consistent with prior reporting periods.
We are currently in various stages of audit by certain governmental tax authorities. We have established liabilities for unrecognized tax benefits as appropriate, with such amounts representing a reasonable provision for taxes we ultimately might be required to pay. However, these liabilities could be adjusted over time as more information becomes known and management continues to evaluate the progress of these examinations. We are no longer subject to significant U.S. federal tax examinations for years prior to 2016, or significant U.S. state or foreign income tax examinations for years prior to 2013.
It is reasonably possible that the resolution of certain tax audits could reduce our unrecognized tax benefits within the next 12 months, as certain tax positions may either be sustained on audit or we may agree to certain adjustments, or resulting from the expiration of statutes of limitations in various jurisdictions. It is not expected that any change would have a material impact on our Consolidated Financial Statements.
120
Deferred Income Taxes
Deferred income taxes are provided for the temporary differences between the financial reporting basis and the tax basis of our assets and liabilities. The major temporary differences and their associated deferred tax assets or liabilities are as follows:
| December 31 | |||||||||||||||||||||||
| 2020 | 2019 | ||||||||||||||||||||||
| Assets | Liabilities | Assets | Liabilities | ||||||||||||||||||||
| Property, plant and equipment | $ | $ | ( | $ | $ | ( | |||||||||||||||||
| Inventories | ( | ( | |||||||||||||||||||||
| Accrued expenses | ( | ( | |||||||||||||||||||||
| Net operating losses and other tax carryforwards | |||||||||||||||||||||||
| Pension cost and other post-retirement benefits | ( | ( | |||||||||||||||||||||
| Intangible assets | ( | ( | |||||||||||||||||||||
| Derivative financial instruments | ( | ( | |||||||||||||||||||||
| Tax on undistributed earnings (primarily from Canada and China) | ( | ( | |||||||||||||||||||||
| Uncertain tax positions | |||||||||||||||||||||||
| Other | ( | ( | |||||||||||||||||||||
| Gross deferred tax assets (liabilities) | ( | ( | |||||||||||||||||||||
| Valuation allowance | ( | — | ( | — | |||||||||||||||||||
| Total deferred taxes | $ | $ | ( | $ | $ | ( | |||||||||||||||||
| Net deferred tax liability | $ | ( | $ | ( | |||||||||||||||||||
Deferred tax assets (liabilities) included in the Consolidated Balance Sheets are as follows:
| December 31 | |||||||||||
| 2020 | 2019 | ||||||||||
| Sundry | $ | $ | |||||||||
| Deferred income taxes | ( | ( | |||||||||
| $ | ( | $ | ( | ||||||||
Significant fluctuations in our deferred taxes from 2019 to 2020 relate to the following:
•The increase of $8.2 in our deferred tax asset associated with accrued expenses relates primarily to changes in our bad debt reserve and accrued employee benefits; and
•The decrease of $4.8 in our deferred tax liability associated with intangible assets relates primarily to the amortization of various intangibles, including those related to the acquisition of ECS in 2019.
The valuation allowance recorded primarily relates to net operating loss, tax credit, and capital loss carryforwards for which utilization is uncertain. Cumulative tax losses in certain state and foreign jurisdictions during recent years, limited carryforward periods in certain jurisdictions, future reversals of existing taxable temporary differences, and reasonable tax planning strategies were among the factors considered in determining the valuation allowance. Individually, none of these tax carryforwards presents a material exposure.
Most of our tax carryforwards have expiration dates that vary generally over the next 20 years, with no amount greater than $10.0 expiring in any one year.
Deferred withholding taxes (tax on undistributed earnings) have been provided on the earnings of our foreign subsidiaries to the extent it is anticipated that the earnings will be remitted in the future as dividends. We are not asserting permanent reinvestment on $686.3 of our earnings, and have accrued tax on these undistributed earnings as presented in the table above.
121
O—Other (Income) Expense
The components of other (income) expense were as follows:
| Year Ended December 31 | |||||||||||||||||
| 2020 | 2019 | 2018 | |||||||||||||||
| Gain on sales of assets and businesses | $ | ( | $ | ( | $ | ( | |||||||||||
| Currency loss | |||||||||||||||||
| ( | ( | ||||||||||||||||
COVID-19 government subsidies 1 | ( | ||||||||||||||||
| ( | ( | ||||||||||||||||
| Other income | ( | ( | ( | ||||||||||||||
| $ | ( | $ | ( | $ | |||||||||||||
122
P—Accumulated Other Comprehensive Income (Loss)
The following table sets forth the changes in each component of accumulated other comprehensive income (loss):
Foreign Currency Translation Adjustments | Cash Flow Hedges | Defined Benefit Pension Plans | Accumulated Other Comprehensive Income (Loss) | ||||||||||||||||||||
| Balance at January 1, 2018 | $ | $ | ( | $ | ( | $ | ( | ||||||||||||||||
| Other comprehensive (loss) | ( | ( | ( | ( | |||||||||||||||||||
Reclassifications, pretax 1 | |||||||||||||||||||||||
| Income tax effect | |||||||||||||||||||||||
| Balance at December 31, 2018 | ( | ( | ( | ( | |||||||||||||||||||
| Other comprehensive income (loss) | ( | ( | |||||||||||||||||||||
Reclassifications, pretax 2 | |||||||||||||||||||||||
| Income tax effect | ( | ||||||||||||||||||||||
| Balance at December 31, 2019 | ( | ( | ( | ( | |||||||||||||||||||
| Other comprehensive income (loss) | ( | ||||||||||||||||||||||
Reclassifications, pretax 3 | |||||||||||||||||||||||
| Income tax effect | ( | ||||||||||||||||||||||
| Attributable to noncontrolling interest | |||||||||||||||||||||||
| Balance at December 31, 2020 | $ | $ | $ | ( | $ | ( | |||||||||||||||||
1 2018 pretax reclassifications are comprised of: | |||||||||||||||||||||||
| Net trade sales | $ | $ | ( | $ | $ | ( | |||||||||||||||||
| Cost of goods sold; selling and administrative expenses | |||||||||||||||||||||||
| Interest expense | |||||||||||||||||||||||
| Other (income) expense, net | |||||||||||||||||||||||
| Total 2018 reclassifications, pretax | $ | $ | $ | $ | |||||||||||||||||||
2 2019 pretax reclassifications are comprised of: | |||||||||||||||||||||||
| Net trade sales | $ | $ | $ | $ | |||||||||||||||||||
| Cost of goods sold; selling and administrative expenses | ( | ( | |||||||||||||||||||||
| Interest expense | |||||||||||||||||||||||
| Other (income) expense, net | |||||||||||||||||||||||
| Total 2019 reclassifications, pretax | $ | $ | $ | $ | |||||||||||||||||||
3 2020 pretax reclassifications are comprised of: | |||||||||||||||||||||||
| Net trade sales | $ | $ | ( | $ | $ | ( | |||||||||||||||||
| Cost of goods sold; selling and administrative expenses | ( | ( | |||||||||||||||||||||
| Interest expense | |||||||||||||||||||||||
| Other (income) expense, net | |||||||||||||||||||||||
| Total 2020 reclassifications, pretax | $ | $ | $ | $ | |||||||||||||||||||
123
Q—Fair Value
We utilize fair value measures for both financial and non-financial assets and liabilities.
Items measured at fair value on a recurring basis
Fair value measurements are established using a three-level valuation hierarchy that prioritizes the inputs to valuation techniques used to measure fair value into the following categories:
•Level 1: Quoted prices for identical assets or liabilities in active markets.
•Level 2: Inputs, other than quoted prices included in Level 1, that are observable for the asset or liability either directly or indirectly. Short-term investments in this category are valued using discounted cash flow techniques with all significant inputs derived from or corroborated by observable market data. Derivative assets and liabilities in this category are valued using models that consider various assumptions and information from market-corroborated sources. The models used are primarily industry-standard models that consider items such as quoted prices, market interest rate curves applicable to the instruments being valued as of the end of each period, discounted cash flows, volatility factors, current market, and contractual prices for the underlying instruments, as well as other relevant economic measures. Substantially all of these assumptions are observable in the marketplace, can be derived from observable data, or are supported by observable levels at which transactions are executed in the marketplace.
•Level 3: Unobservable inputs that are not corroborated by market data.
The areas in which we utilize fair value measures of financial assets and liabilities are presented in the table below:
| As of December 31, 2020 | |||||||||||||||||||||||
| Level 1 | Level 2 | Level 3 | Total | ||||||||||||||||||||
| Assets: | |||||||||||||||||||||||
| Cash equivalents: | |||||||||||||||||||||||
| Bank time deposits with original maturities of three months or less | $ | $ | $ | $ | |||||||||||||||||||
| Total assets | $ | $ | $ | $ | |||||||||||||||||||
| Liabilities: | |||||||||||||||||||||||
| $ | $ | $ | $ | ||||||||||||||||||||
| Total liabilities | $ | $ | $ | $ | |||||||||||||||||||
| As of December 31, 2019 | |||||||||||||||||||||||
| Level 1 | Level 2 | Level 3 | Total | ||||||||||||||||||||
| Assets: | |||||||||||||||||||||||
| Cash equivalents: | |||||||||||||||||||||||
| Bank time deposits with original maturities of three months or less | $ | $ | $ | $ | |||||||||||||||||||
| Total assets | $ | $ | $ | $ | |||||||||||||||||||
| Liabilities: | |||||||||||||||||||||||
| $ | $ | $ | $ | ||||||||||||||||||||
| Total liabilities | $ | $ | $ | $ | |||||||||||||||||||
1 Includes both current and long-term amounts.
124
There were no transfers between Level 1 and Level 2 for any of the periods presented.
The fair value for fixed rate debt (Level 1) was approximately $170.0 greater than carrying value of $1,587.6 at December 31, 2020 and was approximately $100.0 greater than carrying value of $1,585.6 at December 31, 2019.
Items measured at fair value on a non-recurring basis
The primary areas in which we utilize fair value measures of non-financial assets and liabilities are allocating purchase price to the assets and liabilities of acquired companies (Note R) and evaluating long-term assets (including goodwill) for potential impairment (Note C). Determining fair values for these items requires significant judgment and includes a variety of methods and models that utilize significant Level 3 inputs (Note A).
R—Acquisitions
The following table contains the estimated fair values of the assets acquired and liabilities assumed at the date of acquisition for all acquisitions during the periods presented (using inputs discussed in Note A). Of the goodwill included in the table below, approximately $135.0 is expected to be deductible for tax purposes.
| 2019 | 2018 | |||||||||||||
| Accounts receivable | $ | $ | ||||||||||||
| Inventory | ||||||||||||||
| Property, plant and equipment | ||||||||||||||
Customer relationships ( | ||||||||||||||
Technology ( | ||||||||||||||
Trademarks and trade names ( | ||||||||||||||
Non-compete agreements and other ( | ||||||||||||||
| Other current and long-term assets | ||||||||||||||
| Current liabilities | ( | ( | ||||||||||||
| Deferred income taxes | ( | ( | ||||||||||||
| Long-term liabilities | ( | ( | ||||||||||||
| Net cash consideration | $ | $ | ||||||||||||
The following table summarizes acquisitions for the periods presented.
| Year Ended | Number of Acquisitions | Segment | Product/Service | |||||||||||||||||
| December 31, 2020 | ||||||||||||||||||||
| December 31, 2019 | Bedding Products Furniture, Flooring & Textile Products | A leader in proprietary specialized foam technology, primarily for the bedding and furniture industries; Manufacturer and distributor of geosynthetic and mine ventilation products | ||||||||||||||||||
| December 31, 2018 | Furniture, Flooring & Textile Products; Specialized Products | Manufacturer and distributor of home and garden products; Manufacturer and distributor of silt fence; Engineered hydraulic cylinders | ||||||||||||||||||
Certain of our prior years' acquisition agreements provide for additional consideration to be paid in cash at a later date and are recorded as a liability at the acquisition date. At December 31, 2020, we have no liability for future payments. At December 31, 2019, our liability for these future payments was $9.2 . Additional consideration, including interest, paid on prior year acquisitions was $8.4 , $1.1 , and $9.3 for the years ended 2020, 2019, and 2018, respectively.
125
A brief description of our acquisition activity by year is included below.
2020
2019
We acquired two businesses:
•ECS, a leader in proprietary specialized foam technology, primarily for the bedding and furniture industries. Through this acquisition, we gained critical capabilities in proprietary foam technology, along with scale in the production of private label finished mattresses. The acquisition date was January 16. The purchase price was $1,244.3 and, upon finalization of the purchase price allocation, added $559.3 of goodwill. The most significant other intangibles added were customer relationships and technology, whose finalized values were $372.3 and $173.3 , respectively. There was no contingent consideration associated with this acquisition.
•A manufacturer and distributor of geosynthetic and mine ventilation products, expanding the geographic scope and capabilities of our Geo Components business unit. The acquisition date was December 9. The purchase price was $20.6 and added $7.6 of goodwill.
2018
We acquired three businesses:
•A manufacturer and distributor of innovative home and garden products found at most major retailers for $19.1 . This acquisition provides a solid foundation on which to continue growing our retail market presence in our Geo Components business unit.
•A manufacturer and distributor of silt fence, a core product for our Geo Components business unit, for $2.6 .
•Precision Hydraulic Cylinders (PHC), a leading global manufacturer of engineered hydraulic cylinders primarily for the materials handling market. The purchase price was $87.4 and added $26.9 of goodwill. PHC serves a market of mainly large OEM customers utilizing highly engineered components with long product life-cycles that represent a small part of the end product’s cost. PHC operates within the Specialized Products segment. As discussed in Note C, we began seeing some market softness in the industries served by this reporting unit in 2019. In the second quarter of 2020, anticipated longer-term economic impacts of COVID-19 lowered expectations of future revenue and profitability causing its fair value to fall below its carrying value, and its goodwill was fully impaired.
126
Pro forma Results
The following table summarizes, on an unaudited pro forma basis, our combined results of operations, including ECS, as though the acquisition had occurred as of January 1, 2018. We have not provided pro forma results of operations related to other acquisitions, as these results were not material.
The unaudited proforma financial information below is not necessarily indicative of the results of operations that would have been realized had the ECS acquisition occurred as of January 1, 2018, nor is it meant to be indicative of any future results of operations. It does not include benefits expected from revenue or product mix enhancements, operating synergies or cost savings that may be realized, or any estimated future costs that may be incurred to integrate the ECS business.
| Year Ended December 31 | |||||||||||
| 2019 | 2018 | ||||||||||
| Net trade sales | $ | $ | |||||||||
| Net earnings | |||||||||||
| EPS basic | |||||||||||
| EPS diluted | |||||||||||
The information above reflects pro forma adjustments based on available information and certain assumptions that we believe are reasonable, including:
•Amortization and depreciation adjustments relating to fair value estimates of intangible and tangible assets;
•Incremental interest expense on debt incurred in connection with the ECS acquisition;
•Amortization of the fair value adjustment to inventory as though the transaction occurred on January 1, 2018;
•Recognition of transaction costs as though the transaction occurred on January 1, 2018; and
•Estimated tax impacts of the pro forma adjustments.
S—Derivative Financial Instruments
Cash Flow Hedges
Derivative financial instruments that we use to hedge forecasted transactions and anticipated cash flows are as follows:
Currency Cash Flow Hedges—The foreign currency hedges manage risk associated with exchange rate volatility of various currencies.
Interest Rate Cash Flow Hedges—We have also occasionally used interest rate cash flow hedges to manage interest rate risks.
The effective changes in fair value of unexpired contracts are recorded in accumulated other comprehensive income and reclassified to income or expense in the period in which earnings are impacted. Cash flows from settled contracts are presented in the category consistent with the nature of the item being hedged. (Settlements associated with the sale or production of product are presented in operating cash flows, and settlements associated with debt issuance are presented in financing cash flows.)
Fair Value Hedges and Derivatives not Designated as Hedging Instruments
These derivatives typically manage foreign currency risk associated with subsidiaries’ assets and liabilities, and gains or losses are recognized currently in earnings. Cash flows from settled contracts are presented in the category consistent with the nature of the item being hedged.
127
The following table presents assets and liabilities representing the fair value of our most significant derivative financial instruments. The fair values of the derivatives reflect the change in the market value of the derivative from the date of the trade execution and do not consider the offsetting underlying hedged item.
| Expiring at various dates through: | Total USD Equivalent Notional Amount | As of December 31, 2020 | ||||||||||||||||||||||||||||||||||||
| Derivatives Designated as Hedging Instruments | Assets | Liabilities | ||||||||||||||||||||||||||||||||||||
| Other Current Assets | Sundry | Other Current Liabilities | Other Long-Term Liabilities | |||||||||||||||||||||||||||||||||||
| Cash flow hedges: | ||||||||||||||||||||||||||||||||||||||
| Currency hedges: | ||||||||||||||||||||||||||||||||||||||
| Future USD sales/purchases of Canadian, Chinese, European, South Korean, Swiss and UK subsidiaries | Jun 2022 | $ | $ | $ | $ | $ | ||||||||||||||||||||||||||||||||
| Future MXN purchases of a USD subsidiary | Jun 2022 | |||||||||||||||||||||||||||||||||||||
| Future DKK sales of Polish subsidiary | Jun 2022 | |||||||||||||||||||||||||||||||||||||
| Future EUR sales of Chinese and UK subsidiaries | Jun 2022 | |||||||||||||||||||||||||||||||||||||
| Total cash flow hedges | ||||||||||||||||||||||||||||||||||||||
| Fair value hedges: | ||||||||||||||||||||||||||||||||||||||
| Intercompany and third party receivables and payables exposed to multiple currencies (DKK, EUR, MXN, USD and ZAR) in various countries (CAD, CNY, GBP, PLN and USD) | Jun 2021 | |||||||||||||||||||||||||||||||||||||
| Total fair value hedges | ||||||||||||||||||||||||||||||||||||||
| Derivatives not designated as hedging instruments | ||||||||||||||||||||||||||||||||||||||
| Non-deliverable hedges (EUR and USD) exposed to the CNY | Dec 2021 | |||||||||||||||||||||||||||||||||||||
| Hedge of USD receivable on CAD subsidiary | Jan 2021 | |||||||||||||||||||||||||||||||||||||
| Total derivatives not designated as hedging instruments | ||||||||||||||||||||||||||||||||||||||
| Total derivatives | $ | $ | $ | $ | ||||||||||||||||||||||||||||||||||
128
| Expiring at various dates through: | Total USD Equivalent Notional Amount | As of December 31, 2019 | ||||||||||||||||||||||||||||||
| Derivatives Designated as Hedging Instruments | Assets | Liabilities | ||||||||||||||||||||||||||||||
| Other Current Assets | Sundry | Other Current Liabilities | ||||||||||||||||||||||||||||||
| Cash flow hedges: | ||||||||||||||||||||||||||||||||
| Currency hedges: | ||||||||||||||||||||||||||||||||
| Future USD sales/purchases of Canadian, Chinese, European, South Korean, Swiss and UK subsidiaries | Sep 2021 | $ | $ | $ | $ | |||||||||||||||||||||||||||
| Future MXN purchases of a USD subsidiary | Jun 2021 | |||||||||||||||||||||||||||||||
| Future DKK sales of Polish subsidiary | Jun 2021 | |||||||||||||||||||||||||||||||
| Future EUR sales of Chinese and UK subsidiaries | Jun 2021 | |||||||||||||||||||||||||||||||
| Total cash flow hedges | ||||||||||||||||||||||||||||||||
| Fair value hedges: | ||||||||||||||||||||||||||||||||
| Intercompany and third party receivables and payables exposed to multiple currencies (DKK, EUR, MXN, USD and ZAR) in various countries (CAD, CHF, CNY, GBP, PLN and USD) | May 2020 | |||||||||||||||||||||||||||||||
| Total fair value hedges | ||||||||||||||||||||||||||||||||
| Derivatives not designated as hedging instruments | ||||||||||||||||||||||||||||||||
| Non-deliverable hedges (EUR and USD) exposed to the CNY | Dec 2020 | |||||||||||||||||||||||||||||||
| Hedge of USD receivable on CAD subsidiary | Jan 2020 | |||||||||||||||||||||||||||||||
| Total derivatives not designated as hedging instruments | ||||||||||||||||||||||||||||||||
| Total derivatives | $ | $ | $ | |||||||||||||||||||||||||||||
The following table sets forth the pretax (gains) losses for our hedging activities for the years presented. This schedule includes reclassifications from accumulated other comprehensive income as well as derivative settlements recorded directly to income or expense.
| Income Statement Caption | Amount of (Gain) Loss Recorded in Income for the Year Ended December 31 | |||||||||||||||||||||||||
| Derivatives Designated as Hedging Instruments | 2020 | 2019 | 2018 | |||||||||||||||||||||||
| Interest rate cash flow hedges | Interest expense | $ | $ | $ | ||||||||||||||||||||||
| Currency cash flow hedges | Net trade sales | ( | ||||||||||||||||||||||||
| Currency cash flow hedges | Cost of goods sold | ( | ( | |||||||||||||||||||||||
| Currency cash flow hedges | Other (income) expense, net | |||||||||||||||||||||||||
| Total cash flow hedges | ||||||||||||||||||||||||||
| Fair value hedges | Other (income) expense, net | ( | ||||||||||||||||||||||||
| Derivatives Not Designated as Hedging Instruments | Other (income) expense, net | ( | ||||||||||||||||||||||||
| Total derivative instruments | $ | $ | $ | |||||||||||||||||||||||
129
T—Contingencies
We are a party to various proceedings and matters involving employment, intellectual property, environmental, taxation, vehicle-related personal injury, antitrust, and other laws. When it is probable, in management's judgment, that we may incur monetary damages or other costs resulting from these proceedings or other claims, and we can reasonably estimate the amounts, we record appropriate accruals in the financial statements and make charges against earnings. For all periods presented, we have recorded no material charges against earnings. Also, when it is reasonably possible that we may incur additional loss in excess of recorded accruals, and we can reasonably estimate the additional losses or range of losses, we disclose such additional reasonably possible losses in these notes.
Brazilian Value-Added Tax Matters
All dollar amounts presented in this section reflect the U.S. Dollar (USD) equivalent of Brazilian Real (BRL).
We deny all allegations in the below Brazilian tax actions. We believe that we have valid bases to contest such actions and are vigorously defending ourselves. However, these contingencies are subject to uncertainties, and based on current known facts, we believe that it is reasonably possible (but not probable) that we may incur losses of approximately $10.7 , including interest and attorney fees, with respect to all of these assessments, except for the March 27, 2014 assessment of the $.5 from the State of São Paulo, Brazil (SSP), which has been fully accrued and is discussed below. Therefore, because it is not probable we will incur a loss, no accrual has been recorded for Brazilian value-added tax (VAT) matters (except for the aforementioned March 27, 2014 SSP assessment). As of the date of this filing, we have $8.2 on deposit with the Brazilian government to partially mitigate interest and penalties that may accrue, while we work through these matters. If we are successful in our defense of these assessments, the deposits are refundable with interest. These deposits are recorded as a long-term asset on our balance sheet.
Brazilian Federal Cases. On December 22 and December 29, 2011, and December 17, 2012, the Brazilian Finance Ministry, Federal Revenue Office (Finance Ministry) issued notices of violation against our wholly-owned subsidiary, Leggett & Platt do Brasil Ltda. (L&P Brazil) in the amount of $1.5 ($2.3 with updated interest), $.1 , and $2.7 ($3.2 with updated interest), respectively. The Finance Ministry claimed that for November 2006 and continuing through 2011, L&P Brazil used an incorrect tariff code for the collection and payment of VAT primarily on the sale of mattress innerspring units in Brazil (VAT Rate Dispute). L&P Brazil denied the violations. On December 4, 2015 and October 18, 2018, we filed actions related to the $3.2 assessment and the $2.3 assessment, respectively, in Sorocaba Federal Court. On August 17, 2020, the Sorocaba Federal Court ruled in our favor and annulled the $3.2 assessment. On October 9, 2020, the Federal Treasury filed an appeal which is pending. The $.1 assessment remains pending at the second administrative level. The action seeking to annul the $2.3 assessment also remains pending.
In addition, L&P Brazil received assessments on December 22, 2011, and June 26, July 2, and November 5, 2012, September 13, 2013, and September 4, 2014 from the Finance Ministry where it challenged L&P Brazil’s use of tax credits in years 2005 through 2012. Such credits are generated based upon the VAT rate used by L&P Brazil on the sale of mattress innersprings. L&P Brazil filed its defenses denying the assessments. L&P Brazil received aggregate assessments totaling $1.9 updated with interest on these denials of tax credit matters.
On February 1, 2013, the Finance Ministry filed a Tax Collection action against L&P Brazil in the Camanducaia Judicial District Court, and also, on June 26, 2014, issued a notice of violation, alleging, in the aggregate, the untimely payment of $.6 of social security and social assistance payments from September to October 2010, 2011, and 2012. L&P Brazil argued the payments were not required because of the application of tax credits generated by L&P Brazil's use of a correct VAT rate on the sale of mattress innersprings. These cases remain pending.
We also received a small number of other assessments from the Finance Ministry on the same or related subject matter that are immaterial individually and in the aggregate.
State of São Paulo, Brazil Cases. SSP, on October 4, 2012, issued a Tax Assessment against L&P Brazil in the amount of $.9 for the tax years 2009 through 2011 regarding the same VAT Rate Dispute but as applicable to the sale of mattress innerspring units in the SSP (SSP VAT Rate Dispute). On June 21, 2013, the SSP converted the Tax Assessment to a tax collection action against L&P Brazil in the amount of $1.2 ($1.5 with updated interest) in Sorocaba Judicial District Court. L&P Brazil denied all allegations. This case remains pending.
L&P Brazil also received a Notice of Tax Assessment from the SSP dated March 27, 2014, in the amount of $.5 for tax years January 2011 through August 2012 regarding the SSP VAT Rate Dispute. L&P Brazil filed its response denying the allegations, but the tax assessment was maintained at the administrative level. On June 9, 2016, L&P Brazil filed an
130
action in Sorocaba State Court to annul the entire assessment. The Court ruled against L&P Brazil and the Court of Appeals upheld the unfavorable ruling. The High Court denied our appeal, and L&P Brazil filed an interlocutory appeal. On November 5, 2019, SSP announced an amnesty program that provides discounts on penalties and interest on SSP assessments. We decided to move forward with the amnesty program as it relates to the $.5 assessment. We expect to pay $.5 to resolve this matter using a portion of our $.6 cash deposit. On October 6, 2020, the Court began the process of releasing part of L&P Brazil's cash deposit to pay the $.5 . We expect the return of approximately $.1 consisting of cash deposit and accrued interest in the second quarter of 2021.
State of Minas Gerais, Brazil Cases. On December 18, 2012, the State of Minas Gerais, Brazil issued a tax assessment to L&P Brazil relating to the same VAT Rate Dispute but as applicable to the sale of mattress innerspring units in Minas Gerais from March 2008 through August 2012 in the amount of $.3 . L&P Brazil filed its response denying any violation. The Minas Gerais Taxpayer's Council ruled against us, and L&P Brazil filed a Motion to Stay the Execution of Judgment in Camanducaia Judicial District Court, which remains pending.
Accruals and Reasonably Possible Losses in Excess of Accruals
Accruals for Probable Losses
Although we deny liability in all currently threatened or pending litigation proceedings in which we are or may be a party, and believe that we have valid bases to contest all claims threatened or made against us, we recorded a litigation contingency accrual for our reasonable estimate of probable loss for pending and threatened litigation proceedings, in aggregate, as follows:
| Year Ended December 31 | |||||||||||||||||
| 2020 | 2019 | 2018 | |||||||||||||||
| Litigation contingency accrual - Beginning of period | $ | $ | $ | ||||||||||||||
| Adjustment to accruals - expense | |||||||||||||||||
| Currency | ( | ||||||||||||||||
| Cash payments | ( | ( | ( | ||||||||||||||
| Litigation contingency accrual - End of period | $ | $ | $ | ||||||||||||||
The above litigation contingency accruals do not include accrued expenses related to workers' compensation, vehicle-related personal injury, product and general liability claims, taxation issues, and environmental matters, some of which may contain a portion of litigation expense. However, any litigation expense associated with these categories is not anticipated to have a material effect on our financial condition, results of operations or cash flows. For more information regarding accrued expenses, see Note I under "Accrued expenses" on page 102.
Reasonably Possible Losses in Excess of Accruals
Although there are a number of uncertainties and potential outcomes associated with all of our pending or threatened litigation proceedings, we believe, based on current known facts, that additional losses, if any, are not expected to materially affect our consolidated financial position, results of operations, or cash flows. However, based upon current known facts, as of December 31, 2020, aggregate reasonably possible (but not probable, and therefore not accrued) losses in excess of the accruals noted above are estimated to be $11.5 , including $10.7 for Brazilian VAT matters disclosed above and $.8 for other matters. If our assumptions or analyses regarding these contingencies are incorrect, or if facts change, we could realize losses in excess of the recorded accruals (and in excess of the $11.5 referenced above), which could have a material negative impact on our financial condition, results of operations, and cash flows.
131
U—Risks and Uncertainties
Because of the COVID-19 pandemic, various governments in Asia, Europe, North America, and elsewhere have instituted, and may reinstitute, quarantines, shelter-in-place or stay-at-home orders, or restrictions on public gatherings as well as limitations on social interactions. These restrictions and limitations have had, and could further have, an adverse effect on the economies and financial markets of the countries where our products, or our customers’ products, are sold. The resulting economic downturn has had, and could further have, an effect on the demand for our products and our customers’ products, growth rates in the industries in which we participate, and opportunities in these industries.
We have manufacturing facilities in the United States and 16 other countries. All of these countries have been affected by the COVID-19 pandemic. All of our facilities are open and running at this time. From time to time we have some capacity restrictions on our plants due to governmental orders in various parts of the world. We have been and could be further negatively affected by governmental action in any one or more of the countries in which we operate by the imposition, or re-imposition, of restrictive measures concerning shelter-in-place or stay-at-home orders, public gatherings and human interactions, mandatory closures of retail establishments that sell our products or our customers’ products, travel restrictions, and restrictions on the import or export of products.
The U.S. and other governments have ordered that certain nonwoven fabrics used to produce ComfortCore® innersprings be prioritized to produce medical supplies, resulting in shortages of fabrics used for non-medical applications. These shortages and strong bedding demand have caused the Company temporarily to be unable to supply full industry demand for ComfortCore®. We are engaging with customers in an effort to work through these issues. The shortages have resulted in higher pricing for nonwoven fabrics. If we are unable to obtain the fabrics, cannot pass the cost along to our customers, are required to modify existing contracts to accommodate customers, or pay damage claims to customers, our results of operations may be negatively impacted. As demand has improved, we also have experienced some temporary labor shortages. We are in the process of hiring additional employees and adding equipment, particularly in our U.S. Spring business, to meet this demand.
Because of the shift of production by semiconductor microchip manufacturers to consumer electronics, such as laptops and tablets for home-schooling and home-offices, and away from automotive applications during the COVID-19 related automotive industry shutdowns in 2020, currently there is a shortage of microchips in the automotive industry. Our Automotive Group uses the microchips in seat comfort products, and to a lesser extent in motors and actuators. Although, to date, our Automotive Group has been able to obtain an adequate supply of microchips, we are dependent on our suppliers to deliver these microchips in accordance with our production schedule, and a shortage of the microchips can disrupt our operations and our ability to deliver products to our customers. Also, because of the industry shortage, automotive OEMs and other suppliers have not been able to secure an adequate supply of microchips, and as a result have reduced their production of automobiles or parts, which in turn has recently reduced, and may continue to reduce our sale of products. If we cannot secure an adequate supply of microchips in our supply chain, and the microchips cannot be sourced from a different supplier, or the automotive OEMs and other suppliers continue to reduce their production as a result of such shortage, this may negatively impact our sales, earnings and financial condition.
Depending on the length and severity of the COVID-19 pandemic, and the timing and effectiveness of any vaccines, our ability to keep our manufacturing operations open or fully operational, build and maintain appropriate labor levels, obtain necessary raw materials and parts, and ship finished products to customers may be partially or completely disrupted, either on a temporary or prolonged basis. The continued realization of these risks to our manufacturing operations, labor force, and supply chain could also increase labor, commodity, and energy costs.
Although not directly related to the pandemic, chemical shortages are ongoing and are expected to continue at least through mid-2021. These shortages have resulted in higher pricing for chemicals. If we are unable to obtain the chemicals or pass the cost along to our customers, our results of operations may be negatively impacted. Also, some facilities have experienced problems delivering products to customers because of travel restrictions and disruption in logistics necessary to import, export, or transfer products across borders. Currently, our supply chains have also been hampered by congested ports.
132
Leggett & Platt, Incorporated
Quarterly Summary of Earnings
(Unaudited)
Year ended December 31, (Amounts in millions, except per share data) | First 1,4 | Second 2 | Third 3,5 | Fourth 6 | Total | ||||||||||||||||||||||||
| 2020 | |||||||||||||||||||||||||||||
| Net trade sales | $ | $ | $ | $ | $ | ||||||||||||||||||||||||
| Gross profit | |||||||||||||||||||||||||||||
| Earnings before income taxes | |||||||||||||||||||||||||||||
| Net earnings (loss) | ( | ||||||||||||||||||||||||||||
| (Earnings) attributable to noncontrolling interest, net of tax | ( | ( | |||||||||||||||||||||||||||
| Net earnings (loss) attributable to Leggett & Platt, Inc. common shareholders | $ | $ | ( | $ | $ | $ | |||||||||||||||||||||||
| Net earnings (loss) per share attributable to Leggett & Platt, Inc. common shareholders | |||||||||||||||||||||||||||||
| Basic | $ | $ | ( | $ | $ | $ | |||||||||||||||||||||||
| Diluted | $ | $ | ( | $ | $ | $ | |||||||||||||||||||||||
| 2019 | |||||||||||||||||||||||||||||
| Net trade sales | $ | $ | $ | $ | $ | ||||||||||||||||||||||||
| Gross profit | |||||||||||||||||||||||||||||
| Earnings before income taxes | |||||||||||||||||||||||||||||
| Net earnings | |||||||||||||||||||||||||||||
| Loss (earnings) attributable to noncontrolling interest, net of tax | ( | ( | ( | ||||||||||||||||||||||||||
| Net earnings attributable to Leggett & Platt, Inc. common shareholders | $ | $ | $ | $ | $ | ||||||||||||||||||||||||
| Net earnings per share attributable to Leggett & Platt, Inc. common shareholders | |||||||||||||||||||||||||||||
| Basic | $ | $ | $ | $ | $ | ||||||||||||||||||||||||
| Diluted | $ | $ | $ | $ | $ | ||||||||||||||||||||||||
All items below are shown pretax.
1First quarter 2020 Net earnings include a charge of $8 for note impairment (Note H); $4 charge for stock write-off from a prior year divestiture (Note C)
2Second quarter 2020 Net earnings include a charge of $25 for goodwill impairment (Note C); $3 charge for restructuring (Note E); decreases from the impact of lower sales primarily from pandemic-related economic declines across most of our businesses (Note U).
133
LEGGETT & PLATT, INCORPORATED
SCHEDULE II—VALUATION AND QUALIFYING ACCOUNTS AND RESERVES
(Amounts in millions)
| Column A | Column B | Column C | Column D | Column E | |||||||||||||||||||
| Description | Balance at Beginning of Period | Additions (Credited) to Cost and Expenses | Deductions | Balance at End of Period | |||||||||||||||||||
| Year ended December 31, 2020 | |||||||||||||||||||||||
| Allowance for doubtful receivables | $ | 1 | $ | $ | 2 | $ | |||||||||||||||||
| Tax valuation allowance | $ | $ | $ | $ | |||||||||||||||||||
| Year ended December 31, 2019 | |||||||||||||||||||||||
| Allowance for doubtful receivables | $ | $ | $ | ( | 2 | $ | |||||||||||||||||
| Tax valuation allowance | $ | $ | $ | ( | $ | ||||||||||||||||||
| Year ended December 31, 2018 | |||||||||||||||||||||||
| Allowance for doubtful receivables | $ | $ | $ | 2 | $ | ||||||||||||||||||
| Tax valuation allowance | $ | $ | ( | $ | $ | ||||||||||||||||||
1Beginning balance adjusted for implementation of ASU 2016-13 "Financial Instruments-Credit Losses" (Topic 326).
2Uncollectible accounts charged off, net of recoveries.
134
EXHIBIT INDEX
| Exhibit No. | Document Description | |||||||
| 2.1**** | ||||||||
| 3.1 | ||||||||
| 3.2 | ||||||||
| 4.1 | ||||||||
| 4.2 | ||||||||
| 4.2.1 | ||||||||
| 4.3 | ||||||||
| 4.4 | ||||||||
| 4.5 | ||||||||
| 4.6 | ||||||||
| 4.7** | ||||||||
135
| Exhibit No. | Document Description | |||||||
| 10.1* | ||||||||
| 10.2* | ||||||||
| 10.3* | ||||||||
| 10.4* | ||||||||
| 10.5* | ||||||||
| 10.6*,** | ||||||||
| 10.7* | ||||||||
| 10.8* | ||||||||
| 10.9* | ||||||||
| 10.10* | ||||||||
| 10.11* | ||||||||
| 10.12* | ||||||||
| 10.13* | ||||||||
| 10.13.1* | ||||||||
136
| Exhibit No. | Document Description | |||||||
| 10.13.2* | ||||||||
| 10.13.3* | ||||||||
| 10.13.4* | ||||||||
| 10.13.5* | ||||||||
| 10.13.6* | ||||||||
| 10.13.7* | ||||||||
| 10.13.8* | ||||||||
| 10.13.9* | ||||||||
| 10.13.10* | ||||||||
| 10.13.11* | ||||||||
| 10.13.12* | ||||||||
| 10.13.13*,** | ||||||||
| 10.13.14*,** | ||||||||
137
| Exhibit No. | Document Description | |||||||
| 10.13.15* | ||||||||
| 10.13.16* | ||||||||
| 10.14* | ||||||||
| 10.14.1* | ||||||||
| 10.14.2* | ||||||||
| 10.15* | ||||||||
| 10.16* | ||||||||
| 10.17* | ||||||||
| 10.18* | ||||||||
| 10.19* | ||||||||
| 10.20* | ||||||||
| 10.21* | ||||||||
| 10.22 | ||||||||
138
| Exhibit No. | Document Description | |||||||
| 10.22.1 | ||||||||
| 10.23 | ||||||||
| 10.24 | ||||||||
| 21** | ||||||||
| 23** | ||||||||
| 24** | ||||||||
| 31.1** | ||||||||
| 31.2** | ||||||||
| 32.1** | ||||||||
| 32.2** | ||||||||
| 101.INS*** | Inline XBRL Instance Document - the instance document does not appear in the Interactive Data File because its XBRL tags are embedded within the Inline XBRL document. | |||||||
| 101.SCH*** | Inline XBRL Taxonomy Extension Schema. | |||||||
| 101.CAL*** | Inline XBRL Taxonomy Extension Calculation Linkbase. | |||||||
| 101.DEF*** | Inline XBRL Taxonomy Extension Definition Linkbase. | |||||||
| 101.LAB*** | Inline XBRL Taxonomy Extension Label Linkbase. | |||||||
| 101.PRE*** | Inline XBRL Taxonomy Extension Presentation Linkbase. | |||||||
| 104 | Cover Page Interactive Data File - the cover page interactive data file does not appear in the Interactive Data File because its XBRL tags are embedded within the Inline XBRL document. | |||||||
______________________________
* Denotes management contract or compensatory plan or arrangement.
** Denotes filed or furnished herewith.
139
*** Filed as Exhibit 101 to this report are the following formatted in Inline XBRL (eXtensible Business Reporting Language): (i) Consolidated Statements of Operations for each year in the three year period ended December 31, 2020; (ii) Consolidated Statements of Comprehensive Income (Loss) for each year in the three year period ended December 31, 2020; (iii) Consolidated Balance Sheets at December 31, 2020 and December 31, 2019; (iv) Consolidated Statements of Cash Flows for each year in the three year period ended December 31, 2020; (v) Consolidated Statements of Changes in Equity for each year in the three year period ended December 31, 2020; and (vi) Notes to Consolidated Financial Statements.
**** The assertions embodied in the representations and warranties made in the Stock Purchase Agreement are solely for the benefit of the parties to the Stock Purchase Agreement, and are qualified by information in confidential disclosure schedules that we have exchanged in connection with signing the Stock Purchase Agreement. While Leggett does not believe the schedules contain information required to be publicly disclosed, the schedules do contain information that modifies, qualifies, and creates exceptions to the representations and warranties in the Stock Purchase Agreement. You are not a third party beneficiary to the Stock Purchase Agreement and should not rely on the representations and warranties as characterizations of the actual state of facts, since (i) they are modified in part by the disclosure schedules, (ii) they may have changed since the date of the Stock Purchase Agreement, (iii) they may represent only the parties’ risk allocation in this particular transaction, and (iv) they may be qualified by materiality standards that differ from what may be viewed as material for securities law purposes. The Stock Purchase Agreement has been included to provide you with information regarding its terms. It is not intended to provide any other factual information about Leggett or ECS. Such information about Leggett can be found in other public filings we make with the SEC.
140
Item 16. Form 10-K Summary.
None.
141
SIGNATURES
Pursuant to the requirements of Section 13 or 15(d) of the Securities Exchange Act of 1934, the registrant has duly caused this report to be signed on its behalf by the undersigned, thereunto duly authorized.
| LEGGETT & PLATT, INCORPORATED | ||||||||
| By: | /s/ KARL G. GLASSMAN | |||||||
| Karl G. Glassman | ||||||||
| Chairman and Chief Executive Officer | ||||||||
Date: February 24, 2021
Pursuant to the requirements of the Securities Exchange Act of 1934, this report has been signed below by the following persons on behalf of the registrant and in the capacities and on the dates indicated.
| Signature | Title | Date | ||||||||||||
| (a) Principal Executive Officer: | ||||||||||||||
/s/ KARL G. GLASSMAN | Chairman and Chief Executive Officer (Director) | February 24, 2021 | ||||||||||||
| Karl G. Glassman | ||||||||||||||
| (b) Principal Financial Officer: | ||||||||||||||
/s/ JEFFREY L. TATE | Executive Vice President and Chief Financial Officer | February 24, 2021 | ||||||||||||
| Jeffrey L. Tate | ||||||||||||||
| (c) Principal Accounting Officer: | ||||||||||||||
/s/ TAMMY M. TRENT | Senior Vice President and Chief Accounting Officer | February 24, 2021 | ||||||||||||
| Tammy M. Trent | ||||||||||||||
| (d) Directors: | ||||||||||||||
MARK A. BLINN* | Director | |||||||||||||
| Mark A. Blinn | ||||||||||||||
ROBERT E. BRUNNER* | Director | |||||||||||||
| Robert E. Brunner | ||||||||||||||
MARY CAMPBELL* | Director | |||||||||||||
| Mary Campbell | ||||||||||||||
J. MITCHELL DOLLOFF* | Director | |||||||||||||
| J. Mitchell Dolloff | ||||||||||||||
142
| Signature | Title | Date | ||||||||||||
MANUEL A. FERNANDEZ* | Director | |||||||||||||
| Manuel A. Fernandez | ||||||||||||||
JOSEPH W. MCCLANATHAN* | Director | |||||||||||||
Joseph W. McClanathan | ||||||||||||||
JUDY C. ODOM* | Director | |||||||||||||
| Judy C. Odom | ||||||||||||||
SRIKANTH PADMANABHAN* | Director | |||||||||||||
| Srikanth Padmanabhan | ||||||||||||||
JAI SHAH* | Director | |||||||||||||
| Jai Shah | ||||||||||||||
PHOEBE A. WOOD* | Director | |||||||||||||
| Phoebe A. Wood | ||||||||||||||
| *By: | /s/ SCOTT S. DOUGLAS | ||||||||||
| Scott S. Douglas | February 24, 2021 | ||||||||||
| Attorney-in-Fact Under Power-of-Attorney dated | |||||||||||
| February 23, 2021 | |||||||||||
143
Exhibit 4.7
DESCRIPTION OF THE REGISTRANT’S SECURITIES
REGISTERED PURSUANT TO SECTION 12 OF THE
SECURITIES EXCHANGE ACT OF 1934
Description of Capital Stock
The following is a summary of the general terms of the capital stock of Leggett & Platt, Incorporated (the “Company” or “Leggett”). This description is a summary, and it does not describe every aspect of our capital stock. This summary is subject to and qualified in its entirety by reference to our Restated Articles of Incorporation, our Bylaws, as amended, and the provisions of the Missouri General and Business Corporation Law, which we refer to as Missouri law, and which may be amended from time to time. Since the terms of our Articles of Incorporation and Bylaws may differ from the general information we are providing, you should only rely on the actual provisions of our Articles of Incorporation and Bylaws, which are listed as Exhibits 3.1 and 3.2, respectively, to this Form 10-K and are incorporated into this Exhibit by reference. For additional information, please read the Company’s Articles of Incorporation and Bylaws and the applicable provisions of Missouri law.
As used herein, unless otherwise specified or the context requires otherwise, we use the terms “we,” us” and “our” to refer to the Company.
General
Our authorized capital stock consists of 600,000,000 shares of common stock, par value $0.01 per share, and 100,000,000 shares of preferred stock without par value. As of February 5, 2021, there were 132,977,441 shares of common stock and no shares of preferred stock outstanding. Under our Restated Articles of Incorporation, as amended, which we refer to as our “Articles of Incorporation,” without action by our shareholders, we may issue shares of common or preferred stock from time to time for any consideration which is not less than the applicable par value as determined by our Board of Directors (the “Board”) and all of those shares will be deemed fully paid and non-assessable after payment or delivery of the consideration for those shares.
Common Stock
Subject to the prior and superior rights of the holders of our preferred stock, if any, holders of common stock are entitled to receive dividends as and when declared by our Board out of legally available funds, and, if we liquidate, dissolve, or wind up, to share ratably in all remaining assets after we pay liabilities. Except as otherwise required by law, each holder of common stock is entitled to one vote for each share held of record on all matters presented to a vote of shareholders, including the election of directors, and all of our shares, including shares of preferred stock, will be voted as one class, except as set forth in any certificate of designation for our preferred stock or where specifically required by law to vote separately. Except as otherwise required by law, our Articles of Incorporation or our Bylaws, the holders of a majority of the shares entitled to vote at any shareholder meeting, present in person or by proxy, constitute a quorum and the act of the majority of that quorum is deemed the act of the shareholders. Holders of common stock have no cumulative voting rights or preemptive rights to purchase or subscribe for any of our stock or other securities, and there are no conversion rights. There are no sinking fund provisions for the common stock.
We may issue additional shares of authorized common stock without shareholder approval, subject to our Articles of Incorporation and Bylaws, Missouri law and applicable rules of the New York Stock Exchange (“NYSE”). EQ Shareowner Services is the registrar and transfer agent for our common stock. Our common stock is listed on the NYSE under the symbol “LEG”. We are entitled to treat the person in whose name any share, right or option is registered as the owner thereof and are not bound to recognize any equitable or other claim, except as otherwise required by law.
1
Redemption of Common Stock
Holders of shares of our common stock are entitled to have those shares redeemed under certain circumstances relating to a tender offer by a person who is or becomes a beneficial owner of more than 50% of our common stock. In general, our shares will be subject to redemption if any person (including any individual, entity or group acting together):
| • | becomes the beneficial owner (as defined in our Articles of Incorporation), directly or indirectly, of more than 50% of the shares of our common stock outstanding and any such shares were acquired pursuant to a tender offer opposed by our Board; or | |||||||
| • | beneficially owns, directly or indirectly, more than 50% of the outstanding shares of our common stock and becomes the beneficial owner (as defined in our Articles of Incorporation), directly or indirectly, of any additional shares of our common stock pursuant to a tender offer opposed by our Board. | |||||||
Each such beneficial owner described in these two bullets is referred to as an “Acquiring Person.”
Not later than 20 days following the date on which we receive reasonable notice that any person has become an Acquiring Person (the “Record Date”), we will give written notice to each holder of record of shares of our common stock (or securities or other rights convertible into or exercisable for shares of our common stock immediately or within 45 days following the Record Date), and will advise all such holders of the right to have their shares of common stock redeemed and the procedure for such redemption. If we fail to give the required notice, any holder entitled to such notice may, within 60 days thereafter, serve written demand upon us to require us to give such notice.
If the redemption right applies, each holder of our common stock as of the Record Date (and each holder of securities or other rights convertible into or exercisable for our common stock within 45 days following the Record Date) will have 45 days following the date the notice is mailed to have us redeem the shares of common stock, including any common stock into which securities or other rights would convert. The redemption rights do not apply to the Acquiring Person or any transferee of the Acquiring Person.
The redemption price generally will be the higher of:
| • | the highest price paid by the Acquiring Person, including the value of any non-cash consideration as determined by our Board, and any commissions paid to brokers or dealers for solicitation or other services, for any shares of common stock pursuant to a tender offer that was made by the Acquiring Person and opposed by our Board; or | |||||||
| • | the highest market price per common share on the Record Date. For this purpose, the price on such date will be the highest sale price per common share traded on the NYSE or other national securities exchange or, if our common shares are not then traded on a national securities exchange, the mean of the highest bid and highest asked prices per common share quoted in the National Association of Securities Dealers Automated Quotation System on that date. | |||||||
Shares must be redeemed pursuant to our redemption procedure, which requires depositing the shares for redemption with a redemption agent. We will redeem all shares entitled to redemption allowable under Missouri law on a pro rata basis, except that no fractional shares will be redeemed. Our redemption agent will pay out cash, on a
2
pro rata basis, for the shares redeemed. If sufficient cash is not available to pay for all the deposited shares within 30 days of the last day to deposit shares, then each holder who did not receive the full redemption price will be entitled to receive interest at the rate of 18% per annum or the highest rate allowed by law, whichever is less, from the date 30 days after the last day to deposit the shares until the redemption price is paid in full.
Preferred Stock
Our Articles of Incorporation vest our Board with authority to issue up to 100,000,000 shares of preferred stock, no par value per share, from time to time in one or more classes and one or more series, with such voting powers, full or limited, or no voting powers, and such designations, preferences and relative, participating, optional or other special rights, and qualifications, limitations or restrictions thereof, as may be stated in the resolutions providing for the issuance of such stock adopted by our Board. Our Board is authorized to fix or determine:
| • | the specific designation of the shares of the series; | |||||||
| • | the consideration for which the shares of the series are to be issued; | |||||||
| • | the voting rights appertaining to shares of preferred stock; | |||||||
| • | the rate and conditions, if any, under which dividends will be payable on shares of that series, and the status of those dividends as cumulative or non-cumulative; | |||||||
| • | the price, times, terms and conditions, if any, upon which the shares of the series may be redeemed; | |||||||
| • | the rights, if any, which the holders of shares of the series have in the event of our liquidation, dissolution or winding up of our affairs; | |||||||
| • | the rights, if any, of holders of a series of preferred stock to convert or exchange such shares for shares of any other class or series of our capital stock or any other corporation, including the determination of the price or the rate applicable to such right to convert or exchange and the adjustment thereof, the time during which the rights to convert or exchange will be applicable and the time during which a particular price or rate will be applicable; and | |||||||
| • | any other preferences, rights, privileges, qualifications, limitations and restrictions applicable to the series as may be permitted by law. | |||||||
Before we issue any shares of preferred stock of any class or series, a certificate setting forth a copy of the resolutions of our Board, fixing the voting power, designations, preferences, the relative, participating, optional or other rights, if any, and the qualifications, limitations and restrictions, if any, appertaining to the shares of preferred stock of such class or series, and the number of shares of preferred stock of such class or series, authorized by our Board to be issued will be made and filed in accordance with applicable law.
3
Preemptive Rights
Our Articles of Incorporation provide that no holder of any of our stock will have any rights to purchase or subscribe for any part of our stock, or any bonds, certificates of indebtedness, debentures or other securities convertible into our stock. Any authorized stock or any additional authorized issuance of new stock or of securities convertible into stock may be issued and disposed of by our Board to such persons for such consideration and upon such terms and in such manner as our Board may in its discretion determine without offering on the same terms or on any terms to the shareholders then of record or to any class of shareholders.
Certain Effects of Authorized but Unissued Stock
We may issue additional shares of common stock or preferred stock without shareholder approval, subject to our Articles of Incorporation and Bylaws, Missouri law and NYSE rules, for a variety of corporate purposes, including raising additional capital, corporate acquisitions, and employee benefit plans. This could have the effect of diluting stock ownership by existing shareholders. We could also use additional shares to dilute the stock ownership of persons seeking to obtain control of the Company. See also “Certain Charter and Bylaw Provisions” below.
In addition, the existence of unissued and unreserved common and preferred stock may enable us to issue shares to persons who are friendly to current management, which could discourage an attempt to obtain control of us through a merger, tender offer, proxy contest, or otherwise, and protect the continuity of management and possibly deprive existing shareholders of opportunities to sell their shares at prices higher than the prevailing market prices.
Certain Charter and Bylaw Provisions
The rights of the holders of the Company’s capital stock are affected by certain provisions of our Articles of Incorporation and Bylaws such as those which:
| • | limit the right of shareholders to remove directors or change the size of our Board; | |||||||
| • | limit the right of shareholders to fill vacancies on our Board; | |||||||
| • | limit the right of shareholders to call a special meeting of shareholders or propose other actions; | |||||||
| • | require unanimity for shareholders to act by written consent, in accordance with Missouri law; | |||||||
| • | require a higher percentage vote of shareholders than would otherwise be required under Missouri law to enter into certain transactions and to amend, alter, change, or repeal certain provisions of our Articles of Incorporation; | |||||||
| • | provide that the Bylaws may be amended by our Board; and | |||||||
| • | authorize the issuance of preferred stock with such voting powers, designations, preferences and relative, participating, optional or other special rights, and qualifications, limitations or restrictions of such rights as may be specified by our Board, without shareholder approval. | |||||||
Our Articles of Incorporation restrict the ability of our shareholders to amend our Bylaws in certain circumstances. These provisions may discourage certain types of transactions that involve an actual or threatened change of control of us.
4
Size of Board. Our Articles of Incorporation provide that the number of directors to constitute the Board will be fixed by, or in the manner provided in, our Bylaws, but establishes the minimum number of directors at three. Our Bylaws provide for a board of at least three directors but not more than fifteen directors and permit our Board to increase or decrease the number of directors within these limits. The directors are elected at the annual meeting of shareholders, except as otherwise provided in our Bylaws.
Election of Directors. Our Bylaws do not permit cumulative voting in the election of directors. Accordingly, the holders of a majority of the outstanding shares of common stock entitled to vote, present in person or by proxy, can elect all the directors nominated at that meeting of shareholders. In order for our shareholders to nominate a candidate for director, our Bylaws require that, among other things, such shareholder give timely notice to us in advance of the meeting. Ordinarily, the shareholder must give written notice at least 90 days but not more than 120 days prior to the first anniversary of the prior year’s annual meeting, but if no annual meeting was held in the previous year or if the date of the annual meeting is moved by more than 30 days from such anniversary date, notice must be received not later than the later of the 90th day prior to such annual meeting or the tenth day following the public announcement of such meeting. For special meetings where our Board has determined that directors will be elected, the shareholder must give written notice by the later of the 90th day prior to such meeting or the tenth day following the public announcement of such meeting. The notice must provide certain information regarding the nominee and the shareholder (and the beneficial owner, if any, on whose behalf such nomination is made), including but not limited to, any Disclosable Interests, as defined in the Bylaws, and the name, age, business and residential addresses, and the principal occupation or employment of the proposed nominee.
Proxy Access. The Bylaws permit a qualifying shareholder, or a group of up to 20 such shareholders, owning at least three percent of our outstanding stock continuously for at least three years to nominate, and include in our annual meeting proxy materials, qualifying director nominees constituting up to the greater of two directors or 20% of the Board, provided that the shareholders and nominees satisfy the eligibility, procedural and other requirements specified in the Bylaws.
Removal of Directors. Missouri law provides that, unless a corporation’s articles of incorporation or bylaws provide otherwise, the holders of a majority of the corporation’s voting stock entitled to vote at an election of directors may remove, with or without cause, any director from office. Our Bylaws provide that shareholders may remove a director only “for cause” and with the approval of the holders of a majority of the shares entitled to vote at the election of directors represented in person or by proxy at a shareholder meeting called for the purpose of removing any director or directors.
Filling Vacancies. Missouri law further provides that, unless a corporation’s articles of incorporation or bylaws provide otherwise, all vacancies on a corporation’s board of directors, including any vacancies resulting from an increase in the number of directors, may be filled by the vote of a majority of the remaining directors even if that number is less than a quorum, or by a sole remaining director, until the next election of directors by the shareholders. Our Bylaws also include this provision.
Limitations on Shareholder Action by Written Consent. Missouri law provides that any action by written consent of shareholders in lieu of a meeting must be unanimous. Our Bylaws also include this provision.
Limitations on Proposals of Other Business. In order for a shareholder to bring a proposal before our annual shareholder meeting, our Bylaws require, among other things, that the shareholder give timely notice to us in advance of the meeting. Ordinarily, the shareholder must give notice at least 90 days but not more than 120 days prior to the first anniversary of the prior year’s annual meeting, but if no annual meeting was held in the previous year or if the date of the annual meeting is moved by more than 30 days from such anniversary date, notice must be
5
received not later than the later of the 90th day prior to such annual meeting or the tenth day following the public announcement of such meeting. The notice must include (i) a brief description of the business proposed, the text of the proposal, and the reasons for the proposal and any material interest of such shareholder; (ii) a description of all agreements, arrangements and understandings between such shareholders and beneficial owners, if any, and any other person (or persons) in connection with the proposal of such business by such shareholders; and (iii) the name and address of such shareholders (and the beneficial owners, if any, on whose behalf such proposal is made), and other required information, including but not limited to, any Disclosable Interests, as defined in the Bylaws, of such shareholders and beneficial owners, if any. We may reject any proposals that have not followed these procedures or that are not a proper subject for shareholder action in accordance with the provisions of applicable law.
Limitations on Calling Shareholder Meetings. Under our Bylaws, special meetings of the shareholders may be called only by the Board Chair, the Chief Executive Officer, the President or a majority of the Board of Directors. In addition, shareholders holding not less than two-thirds of all issued and outstanding shares entitled to vote for the election of directors may call a special meeting of shareholders by providing notice to our Secretary signed by the requisite holders which sets forth the information required above relating to proposals of other business. Our Secretary will call a special meeting not later than 90 days after receipt of that shareholder notice. Business transacted at any special meeting shall be confined to the purposes stated in the notice thereof.
Shareholder Voting Requirements for Mergers and Certain Other Transactions. Under our Articles of Incorporation, the affirmative vote of the holders of at least two-thirds of our outstanding shares entitled to vote is required for the approval of:
| • | any merger or consolidation of us with or into any other corporation or entity; | |||||||
| • | any sale, lease, exchange or other disposition (other than by mortgage, deed of trust or pledge), of all, or substantially all, our property and assets, with or without the goodwill, if not made in the usual and regular course of our business; or | |||||||
| • | any plan or agreement relating to any transaction or agreement described above. | |||||||
Restrictions in Our Articles of Incorporation on Certain Business Combinations. Our Articles of Incorporation contain a restriction on transactions defined as “business combinations.” No business combination may be consummated without first being approved by the affirmative vote of 95% of our then outstanding voting stock, voting together as one class, except as described below. This approval requirement is in addition to any other affirmative vote required by law, our Articles of Incorporation and our Bylaws. The 95% vote requirement does not apply to a business combination that:
| • | has been approved by a majority of our continuing directors, which generally include our directors as of May 9, 1984 and any successors of such members whose nomination or election was approved by the affirmative vote of a majority of our then continuing directors; or | |||||||
| • | satisfies certain detailed fairness and procedural requirements, including the amount and type of consideration to be paid. | |||||||
6
Our Articles of Incorporation generally define a “business combination” as:
| • | any merger or consolidation of us or any subsidiary of us with any interested shareholder (as described below) or any affiliate of an interested shareholder; | |||||||
| • | any sale, lease, exchange, mortgage, pledge, transfer or other disposition (in one transaction or a series of transactions) to or with any interested shareholder or any affiliate of any interested shareholder of any assets of ours or any subsidiary of ours generally having an aggregate fair market value of $5 million or more; | |||||||
| • | any issuance or transfer by us or any subsidiary of us (in one transaction or a series of transactions) of any securities of us or any subsidiary of us to any interested shareholder or any affiliate of any interested shareholder in exchange for cash, securities or other property (or a combination thereof) generally having an aggregate fair market value of $5 million or more; | |||||||
| • | the adoption of any plan or proposal for our liquidation or dissolution at any time during which there exists an interested shareholder; or | |||||||
| • | any reclassification of securities (including any reverse stock split), or recapitalization of us, or any merger or consolidation of us with any of our subsidiaries or any other transaction (whether or not with or into or otherwise involving an interested shareholder) which has the effect, directly or indirectly, of increasing the proportionate share of the outstanding shares of any class of our voting stock which are beneficially owned by any interested shareholder or any affiliate of any interested shareholder. | |||||||
Our Articles of Incorporation generally define an “interested shareholder” as any person which is the beneficial owner (as defined in our Articles of Incorporation) of 10% or more of any class of our voting stock, excluding us, our subsidiaries and any fiduciary or trustee for the employees of us or our subsidiaries acting pursuant to any benefit plan or arrangement established by us.
Amendment to Certain Provisions of our Articles and Bylaws. Missouri law generally provides that the power to make, alter, amend or repeal bylaws is vested in the shareholders, unless and to the extent that such power is vested in the board of directors by a corporation’s articles of incorporation. Our Bylaws provide that they may be amended by our Board. Generally, amendments to our Articles of Incorporation must be approved by the affirmative vote of a majority of our outstanding shares entitled to vote, unless any class of shares is entitled to vote as a class, in which event the proposed amendment must be adopted by the affirmative vote of a majority of the outstanding shares of each class of shares entitled to vote as a class and of the total shares entitled to vote.
7
Amendments to certain provisions of our Articles of Incorporation are subject to additional restrictions as follows:
| • | amendments to the provisions of our Articles of Incorporation relating to the redemption of our common stock in certain circumstances require the affirmative vote of the holders of at least 85% of our outstanding common stock; | |||||||
| • | amendments to the provisions of our Articles of Incorporation relating to mergers and certain other transactions require the affirmative vote of the holders of at least two-thirds of the shares entitled to vote on such amendment; and | |||||||
| • | amendments to the provisions of our Articles of Incorporation relating to certain business combinations require the affirmative vote of the holders of 95% of our shares of voting stock, voting together as a single class; provided, that if no interested shareholder exists, the affirmative vote of 60% of the outstanding shares of our voting stock, voting together as a single class, shall be required to amend such provision. | |||||||
In addition, our Articles of Incorporation provide protections for certain specific provisions of our Bylaws, called “Protected Bylaws.” Regardless of any other lesser percentage that may otherwise be required, no Protected Bylaw may be amended or repealed and no provision of our Bylaws or Articles of Incorporation inconsistent with a Protected Bylaw may be adopted at any time there exists a “substantial shareholder” without first obtaining the approval of either:
| • | 80% or more of our then outstanding voting stock voting together as a single class; or | |||||||
| • | a majority of all of our continuing directors, which generally include our directors as of the close of business on May 7, 1986 and any successors of such members whose nomination or election was approved by the affirmative vote of a majority of our then continuing directors. | |||||||
Our Articles of Incorporation generally define a “substantial shareholder” as any person which is the beneficial owner (as defined in our Articles of Incorporation) of 20% or more of any class of our voting stock, excluding us, our subsidiaries, any fiduciary or trustee for our employees or our subsidiaries acting pursuant to any benefit plan or arrangement established by us or any of our subsidiaries and any such plan.
8
A Protected Bylaw is any bylaw that is designated as such by a resolution adopted by our Board. Bylaws relating to the following matters are considered “Protected Bylaws”:
| • | annual and special shareholder meetings and related procedural matters, including our quorum requirement and the prohibition on cumulative voting (Sections 1.1, 1.2, 1.3, 1.4, 1.6 and 1.7 of our Bylaws); | |||||||
| • | the number and election of directors, qualifications of directors, removal of directors, procedures relating to shareholder nominations of directors, procedures relating to the calling of directors’ meeting and rules regarding Board committees (Sections 2.1, 2.2, 2.3, 2.4 and 2.6 of our Bylaws); | |||||||
| • | indemnification of directors, officers, employees and agents, including the advancement of expenses (Article 5 of our Bylaws); and | |||||||
| • | amendments of our Bylaws by our Board (Section 6.6 of our Bylaws). | |||||||
To amend, repeal or adopt any provisions inconsistent with our Articles of Incorporation which provide the additional restrictions relating to “Protected Bylaws” requires the affirmative vote of 80% of our voting stock voting together as a single class; provided, that if no substantial shareholder exists, the affirmative vote of 60% of the outstanding shares of our voting stock, voting together as a single class, shall be required to amend, repeal or adopt any such provision.
Anti-Takeover Effects of Provisions
The inability to vote shares cumulatively, the advance notice requirements for nominations, and the provisions in our Articles of Incorporation that limit the ability of shareholders to increase the size of our Board or to remove directors and that permit the remaining directors to fill any vacancies on our Board make it more difficult for shareholders to change the composition of our Board.
The provisions of Missouri law and our Bylaws which require unanimity for shareholder action by written consent gives all our shareholders entitled to vote on a proposed action the opportunity to participate in the action and prevents the holders of a majority of the voting power of the Company from using the written consent procedure to take shareholder action. The Bylaw provision requiring advance notice of other proposals may make it more difficult for shareholders to take action opposed by our Board. Moreover, shareholders are required to follow certain procedures to force shareholder consideration of a proposal over the opposition of our Board in order to call a special meeting of shareholders. These provisions make it more difficult and time-consuming to obtain majority control of our Board or otherwise bring a matter before our shareholders without the consent of our Board, and thus reduce our vulnerability to an unsolicited takeover proposal.
Our supermajority vote requirements to approve some transactions or to amend some provisions of our Articles of Incorporation or Bylaws may discourage some types of transactions that involve an actual or threatened change in control. We believe these provisions enable us to develop our business in a manner that will foster its long-term growth, by reducing the threat of a takeover that is not in the best interests of us and our shareholders and the potential disruption entailed by the threat. On the other hand, these provisions may adversely affect the ability of shareholders to influence our governance and the possibility that shareholders would receive a premium above market price for their securities from a potential acquirer who is unfriendly to management.
9
Missouri Statutory Provisions
Missouri law contains certain provisions which may have an anti-takeover effect and otherwise discourage third parties from effecting transactions with us, including control share acquisition and business combination statutes. The following description does not purport to be complete and you should refer to the actual provisions of Missouri law for more information.
Business Combination Statute. Missouri law contains a “business combination statute” which generally restricts certain “business combinations” between us and an “interested shareholder,” or affiliates or associates of the interested shareholder. Under this statute a “business combination” generally means:
| • | any merger or consolidation of us or any subsidiary of us with any interested shareholder or any affiliate or associate of any interested shareholder; | |||||||
| • | specified sales, leases, exchanges, mortgages, pledges, transfers or other dispositions (in one transaction or a series of transactions) to or with any interested shareholder or any affiliate or associate of any interested shareholder of any assets of ours or any subsidiary of ours; | |||||||
| • | specified issuances or transfers by us or any subsidiary of us (in one transaction or a series of transactions) of any stock of us or any subsidiary of us to any interested shareholder or any affiliate or associate of any interested shareholder; | |||||||
| • | the adoption of any plan or proposal for our liquidation or dissolution proposed by, or pursuant to any agreement, arrangement or understanding with any interested shareholder or any affiliate or associate of any interested shareholder; | |||||||
| • | specified reclassifications of securities or recapitalizations of us, or specified mergers or consolidations of us with any of our subsidiaries or any other transaction (whether or not with or into or otherwise involving an interested shareholder) which have the effect, directly or indirectly, of increasing the proportionate share of the outstanding shares of any class of our voting stock which are directly or indirectly owned by any interested shareholder or any affiliate or associate of any interested shareholder; or | |||||||
| • | any receipt by any interested shareholder or any affiliate or associate of any interested shareholder of the benefit, directly or indirectly, except proportionately as a shareholder of us, of any loans, advances, guarantees, pledges or other financial assistance or any tax credits or other tax advantages provided by or through us. | |||||||
An “interested shareholder” is generally any person which is the beneficial owner of 20% or more of the outstanding shares of our common stock, or is one of our affiliates or associates who, within the past five years, beneficially owned 20% or more of our common stock.
The statute prohibits business combinations between us and an interested shareholder for a period of five years after the date of the transaction in which the person becomes an interested shareholder, unless either the business combination or such transaction is approved by our Board on or before the date the interested shareholder obtains such status.
10
The statute also provides that, after the expiration of the five-year period, business combinations are prohibited unless:
| • | the business combination or the transaction in which the person becomes an interested shareholder is approved by our Board on or before the date the interested shareholder obtains such status; | |||||||
| • | the holders of a majority of the outstanding voting stock, other than the stock beneficially owned by the interested shareholder, or any affiliate or associate of such interested shareholder, approve the business combination at a meeting no earlier than five years after such interested shareholder’s stock acquisition date; or | |||||||
| • | the business combination satisfies certain detailed fairness and procedural requirements. | |||||||
A Missouri corporation may opt out of coverage by the business combination statute by including a provision to that effect in its governing corporate documents. We have not done so. The business combination statute may make it more difficult for a 20% beneficial owner to effect other transactions with us and may encourage persons that seek to acquire us to negotiate with our Board prior to acquiring a 20% interest. It is possible that such a provision could make it more difficult to accomplish a transaction which the shareholders may otherwise deem to be in their best interest.
Control Share Acquisition Statute. Missouri also has a “control share acquisition statute” that can limit the rights of a shareholder to vote some or all of his or her shares. Generally, a shareholder whose acquisition of shares results in that shareholder having the power to exercise or direct the exercise of voting power in the election of directors more than a specified percentage of our outstanding stock (beginning at 20%), will lose the right to vote some or all of his or her shares in excess of such percentage.
The limitation on voting the shares in excess of the threshold percentage may be waived with shareholder approval. First, the acquiring shareholder must meet certain disclosure requirements specified in the statute. Second, a majority of the outstanding shares entitled to vote, by class if so required, must approve the acquisition of such shares. Third, a majority of the outstanding shares entitled to vote, by class if so required (but excluding all interested shares such as shares held by the acquiring shareholder or by certain employees, directors and officers of the company), must approve the acquisition.
11
Not all acquisitions of shares constitute control share acquisitions. Examples include:
| • | transfers in accordance with wills or the laws of descent and distribution or by gift where such gift is made in good faith and not for the purpose of circumventing the statute; | |||||||
| • | purchases made in connection with an issuance by us; | |||||||
| • | purchases by or pursuant to any of our compensation or benefit plans; | |||||||
| • | conversions of our debt securities in accordance with their terms; | |||||||
| • | acquisitions pursuant to a binding contract whereby the holders of shares representing at least two-thirds of our voting power agree to sell their shares to the acquirer, provided that such holders act simultaneously and the transaction is not pursuant to or in connection with a tender offer; | |||||||
| • | acquisitions pursuant to the satisfaction of a pledge or other security interest created in good faith and not for the purpose of circumventing the statute; | |||||||
| • | mergers involving us which satisfy other specified requirements of Missouri law; | |||||||
| • | transactions with a person who owned a majority of our voting power within the prior year; or | |||||||
| • | purchases from a person who previously satisfied the requirements of the control share acquisition statute, so long as the acquiring person does not have voting power after the purchase in a different ownership range (as defined in the statute) than the selling shareholder prior to the sale. | |||||||
A Missouri corporation may opt out of coverage under the control share acquisition statute by including a provision to that effect in its governing corporate documents. We have not opted out of coverage of the statute.
Takeover Bid Disclosure Act. Missouri’s Takeover Bid Disclosure Act requires that, under some circumstances, before making a tender offer that would result in the offeror acquiring control of us, the offeror must file specified disclosure materials with the Missouri Commissioner of Securities.
12
Exhibit 10.6
Severance Benefit Agreement
This Severance Benefit Agreement (the “Agreement”) is made as of September 18, 2017 between Leggett & Platt, Incorporated, 1 Leggett Road, Carthage, Missouri 64836 (the “Company”) and Steven K. Henderson (the “Executive”), residing at [ ].
RECITALS
The Executive functions as Automotive Group President of the Company on the date hereof and is one of the key employees of the Company.
The Company considers the maintenance of sound and vital management essential to protecting and enhancing the best interests of the Company and its shareholders. In this connection, the Company recognizes that in today’s business environment the possibility of a change in control of the Company may exist in the future. The Company further recognizes that such possibility, and the uncertainty which it may raise among key executives, could result in the departure or distraction of key executives to the detriment of the Company and its shareholders.
Accordingly, the Company has determined that appropriate steps should be taken (i) to further induce the Executive to remain with the Company and (ii) to reinforce and encourage the continued attention and dedication of the Executive to his assigned duties without distraction in the face of potentially disturbing circumstances arising from the possibility of a change in control of the Company.
Now, Therefore, in consideration of the premises and for other good and valuable consideration, the receipt of which are hereby acknowledged, the Company and the Executive agree as follows:
1. Change in Control.
1.1 Change in Control. The Company shall be required to provide certain benefits to the Executive to the extent required under the terms of this Agreement following each and every “Change in Control” of the Company.
1.2 Definition. A “Change in Control” of the Company shall be deemed to have occurred if:
(a) There is any change in control as contemplated by (i) Item 6(e) of Schedule 14A, Regulation 14A, promulgated under the Securities Exchange Act of 1934, as amended (the “Exchange Act”) or (ii) Item 5.01 of Form 8-K promulgated by the Securities and Exchange Commission under the Exchange Act; or
(b) Any “person” (as such term is used in Sections 13(d) and 14(d) of the Exchange Act) is or becomes the “beneficial owner” (as defined in Rule 13d-3 under the Exchange Act), directly or indirectly, of 40% or more of the combined voting power of the Company’s then outstanding voting securities; or
1
(c) Those persons serving as directors of the Company on the date of this Agreement (the “Original Directors”) and/or their Successors do not constitute a majority of the whole Board of Directors of the Company (the term “Successors” shall mean those directors whose election or nomination for election by the Company’s shareholders has been approved by the vote of at least two-thirds of the Original Directors and previously qualified Successors serving as directors of the Company at the time of such election or nomination for election); or
(d) The Company shall be a party to a merger or consolidation with another corporation and as a result of such merger or consolidation, less than 65% of the outstanding voting securities of the surviving or resulting corporation shall be owned in the aggregate by the former shareholders of the Company as the same shall have existed immediately prior to such merger or consolidation; or
(e) The Company liquidates, sells, or otherwise transfers all or substantially all of its assets to a person not controlled by the Company both immediately prior to and immediately after such sale; or
(f) The Company (i) enters into an agreement, including a letter of intent, which contemplates the occurrence of a Change of Control (as described in Subsections 1.2(a)-(e)) or (ii) the Company or any person publicly announces an intention to take actions which, if consummated, would result in a Change in Control (as described in Subsections 1.2(a)-(e)). A Change in Control under this Subsection 1.2(f) will no longer be in effect once the Board adopts a resolution making a good faith determination that a Change in Control under this Subsection 1.2(f) is no longer pending (except that such a resolution shall not be effective against a termination by the Executive under Section 2.4 prior to the Board adopting the resolution).
2. Termination of Employment Following a Change in Control
2.1 General. During the 24 month period immediately following each and every Change in Control (the “Protected Period”), the Executive and the Company shall comply with all provisions of this Section 2 regarding termination of the Executive’s employment. This Agreement shall have no application to any termination of the Executive’s employment outside the Protected Period.
2.2 Termination for Total Disability. The Company may terminate the Executive’s employment during the Protected Period due to the Executive’s Total Disability. “Total Disability” means the Executive’s inability to perform substantially all of his material duties with the Company for a continuous period of six or more months due to illness or injury. During any period prior to his termination of employment that the Executive is unable to substantially perform his duties with the Company as a result of illness or injury, the Company shall continue to pay the Executive his full base salary at the rate then in effect and any bonuses earned by the Executive under Company bonus plans until such time as the Executive’s employment is
2
terminated by the Company for Total Disability. In no event, however, shall such period of continued pay and bonus exceed 29 consecutive months. Following termination of employment under this Section 2.2, the Executive’s benefits shall be determined in accordance with the Company’s long term disability program as in effect on the date hereof, or any successor program then in effect.
2.3 Termination by Company for Cause. The Company may terminate the Executive’s employment during the Protected Period for “Cause,” which shall be limited to the following:
(a)The Executive’s conviction of any crime involving money or other property of the Company or any of its affiliates (including entering any plea bargain admitting criminal guilt), or a conviction of any other crime (whether or not involving the Company or any of its affiliates) that constitutes a felony in the jurisdiction involved; or
(b)The Executive’s willful breach of the Company’s Code of Business Conduct (or any successor policy) which causes significant injury to the Company; or
(c)The Executive’s willful breach of the Company’s Financial Code of Ethics (or any successor policy) which causes significant injury to the Company; or
(d)The Executive’s willful act or omission involving fraud, misappropriation, or dishonesty that (i) causes significant injury to the Company or (ii) results in a material personal enrichment to the Executive at the expense of the Company; or
(e)The Executive’s willful violation of specific written directions of the Board provided that such directions are consistent with this Agreement and the Executive’s duties and do not constitute Company Action as defined in Section 2.4, and provided that such violation continues following the Executive’s receipt of written notice by the Board specifying the specific acts or omissions alleged to constitute such violation and such violation continues after affording the Executive reasonable opportunity to remedy such failure after receipt of such notice; or
(f)The Executive’s continued, repeated, willful failure to substantially perform his duties; provided, however, that no discharge shall be deemed for Cause under this subsection (f) unless the Executive first receives written notice from the Board advising the Executive of specific acts or omissions alleged to constitute a failure to perform his duties, and such failure continues after the Executive has had a reasonable opportunity to correct the acts or omissions so complained of.
No act or failure to act on the Executive’s part shall be considered “willful” unless done, or omitted to be done, by the Executive without reasonable belief that his action or omission was in the best interest of the Company. Moreover, the Executive’s employment shall not be terminated for Cause unless and until there shall have been delivered to the Executive a Notice of Termination duly adopted by the affirmative vote of at least a majority of the directors of the
3
Board at a meeting of the Board (after reasonable notice to the Executive and an opportunity for the Executive, together with his counsel, to be heard before the Board), finding that in the good faith opinion of the Board the Executive was in violation of Section 2.3(a), (b), (c), (d), (e) or (f) and specifying the particulars thereof in detail.
A termination shall not be deemed for Cause if, for example, the termination results from the Company’s determination that the Executive’s position is redundant or unnecessary or that the Executive’s performance is unsatisfactory or if the termination stems from the Executive’s refusal to agree to or accept any Company Action described in Section 2.4.
2.4 Termination by Executive for Good Reason. The Executive may terminate his employment during the Protected Period for “Good Reason” by giving notice of termination to the Company following (i) any Company Action or (ii) receipt of notice from the Company of the Company’s intention to take any such Company Action.
“Company Actions” which may lead to a termination of employment for Good Reason (collectively and severally) are as follows:
(a) A reduction by the Company in the Executive’s base salary as in effect immediately prior to the Change in Control; or
(b) A change in the Executive’s reporting responsibilities, titles or offices as in effect immediately prior to a Change in Control that results in a material diminution within the Company of title, authority or responsibility; or
(c) The assignment to the Executive of any duties or responsibilities that, in any material aspect, are inconsistent with the Executive’s duties and responsibilities with the Company immediately prior to the Change in Control; or
(d) A material reduction in target annual incentive opportunity as in effect immediately prior to the Change in Control, expressed as a percentage of base salary; or
(e) A requirement by the Company that the Executive be based or perform his duties more than 50 miles from his principal work location immediately prior to the Change in Control, except for required travel on the Company’s business to an extent substantially consistent with the Executive’s business travel obligations immediately prior to the Change in Control or, if the Executive consents in writing to any relocation, the failure by the Company to pay (or reimburse the Executive for) all reasonable expenses incurred by him relating to a change of his principal residence in connection with such relocation; or
(f) A material reduction in annual target value of long-term incentive awards as in effect immediately prior to the Change in Control (with the value determined in accordance with generally accepted accounting standards); or
4
(g) A failure by the Company to obtain the assumption agreement to perform this Agreement by any successor as contemplated by Section 6 of this Agreement; or
(h) Any purported termination of the Executive’s employment by the Company for Total Disability or for Cause that is not carried out (i) pursuant to a Notice of Termination which satisfies the requirements of Section 2.5 and (ii) in accordance with Section 2.3, if applicable; and for purposes of this Agreement, no such purported termination shall be effective.
2.5 Notice of Termination. Any purported termination by the Company of the Executive’s employment during the Protected Period shall be communicated by a written “Notice of Termination” delivered to the other party.
(a) A Notice of Termination by the Company under Section 2.2 (Total Disability) or 2.3 (for Cause) shall set forth, in reasonable detail, the facts and circumstances claimed to provide a basis for termination of employment under the applicable Section.
(b) A Notice of Termination by the Executive under Section 2.4 (Good Reason) shall be delivered no later than 90 days from the date of the Company Actions upon which the termination is based and shall set forth, in reasonable detail, the facts and circumstances claimed to provide a basis for termination of employment.
2.6 Date of Termination. The date the Executive’s employment is terminated under Section 2 of this Agreement is the “Date of Termination.” In cases of Total Disability, the Date of Termination shall be 30 days after Notice of Termination is delivered (provided that the Executive shall not have returned to the performance of his duties on a full-time basis during such 30 day period). If the Executive’s employment is terminated for Cause, the Date of Termination shall be the date specified in the Notice of Termination. If the Executive’s employment is terminated for Good Reason, the Date of Termination shall be the date specified in the Notice of Termination, which shall be between 30 and 60 days following delivery of the Notice of Termination; provided, if, within 30 days of receipt of such notice, the Company takes such appropriate actions as are necessary to correct, reverse or cure the Company Actions that the Executive identifies as causing Good Reason, then no Good Reason shall have occurred and the Notice of Termination shall be deemed withdrawn. For any other termination by the Company or the Executive, the Date of Termination shall be 30 days after the Notice of Termination is delivered.
Any dispute by a party hereto regarding a Notice of Termination delivered to such party must be conveyed to the other party within 30 days after the Notice of Termination is given. If the particulars of the dispute are not conveyed within the 30 day period, then the disputing party’s claims regarding the Notice of Termination shall be forever deemed waived.
3. Benefits upon Termination of Employment
5
3.1 General. If, during the Protected Period following each Change in Control, the Executive’s employment is terminated either (i) by the Company (other than for Total Disability or Cause) or (ii) by the Executive for Good Reason, then the Executive shall be entitled to the benefits provided in this Section 3 (collectively and severally “Termination Benefits”). The Company’s obligation to pay the Termination Benefits are subject to Executive’s compliance with Section 5 (Non-Competition) and Section 8.9 (Release).
3.2 Base Salary Through Date of Termination. The Company shall pay the Executive his full base salary through the Date of Termination under the Company’s regular payroll procedures and at the rate in effect at the time notice of termination is given. The Company shall give the Executive credit for any vacation earned but not taken and pay such amount at the time that any bonus is paid under Section 3.3.
3.3 Pro Rata Bonus for Year of Termination. The Company shall pay the Executive a bonus under the Company’s Key Officers Incentive Plan (together with any successor plans, the “Bonus Plan”) for the year in which his employment terminates, which bonus shall be (i) based upon the results achieved for the Company or applicable profit centers under the Bonus Plan for the year and (ii) prorated for the number of days during the year prior to the Date of Termination. Such amount shall be paid when bonuses are required to be paid under the Bonus Plan but not before 6 months after the Executive’s termination of employment, if and to the extent required to avoid a tax under Section 409A of the Internal Revenue Code of 1986 (the “Code”).
3.4 Severance Payments. The Company shall pay the Executive:
(a)aggregate severance payments equal to 200% of his annual base salary in effect at the time of the Change in Control, plus
(b)additional aggregate severance payments equal to 200% of the Executive’s target bonus amount (which is expressed as a percentage of his annual base salary and is currently 65%) in effect at the time of the Change in Control under the Bonus Plan.
The severance payments in subsection (a) and subsection (b) shall each be made in equal, consecutive bi-weekly installments over the course of 24 months following the Date of Termination.
3.5 Welfare Plans and Fringe Benefits.
(a) For purposes of this Section 3.5, welfare plans and fringe benefit programs include health, disability, life, salary continuance prior to disability, automobile usage, and any other fringe benefit or welfare plan arrangement in which the Executive was entitled to participate immediately prior to the Date of Termination.
(b) The Company shall maintain in full force, for the continued benefit of the Executive for 24 months after the Date of Termination, at the same cost to the Executive as is charged to similarly situated active employees, all welfare plans and fringe benefit
6
programs (including health plan, disability insurance, and life insurance, including any applicable spouse and eligible dependent coverage) that the Company is able to provide under the terms of its plans, programs, and applicable policies and that may be provided to the Executive as a former employee on a tax-free basis under the Code and without the Company incurring a tax under Code Section 4980D; provided, however, that the Company may require the Executive to elect coverage pursuant to COBRA as condition to continuing medical plan coverage, if and to the extent the Executive is eligible for COBRA.
(c) To the extent that any welfare plan or fringe benefit program cannot be maintained under Section 3.5(b) on a tax-free basis to the Executive under the applicable provisions of the Code, the Company shall maintain such benefits that the Company is able to provide under the terms of its plans, programs, and applicable policies without the Company incurring a tax under Code Section 4980D, at the same cost to the Executive as is charged to similarly situated active employees, for the period, if any, that is recognized under Code Section 409A as not resulting in a deferral of compensation, but in no event beyond 24 months.
(d) To the extent any welfare plan or fringe benefit program cannot be provided for 24 months from the Date of Termination under Sections 3.5(b) and (c), the Executive shall be entitled to bi-weekly cash payments that equal (i) the Company’s cost of coverage in the case of welfare plans and (ii) the premiums, if any, in the case of fringe benefit programs, and (iii) the value of any other benefits that would have been provided during such period. At the close of the 24 month period, any assignable insurance policy owned by the Company and relating solely to the Executive shall be assigned to the Executive.
3.6 Retirement Plans.
(a) The Company shall pay the Executive an “Additional Retirement Benefit” equal to the additional benefit the Executive would have been entitled to under the Company’s Retirement Plans in effect immediately prior to a Change in Control had the Executive accumulated 24 additional months of continuous service (following the Date of Termination) under such Retirement Plans both for purposes of determining eligibility for benefits and for purposes of calculating the Additional Retirement Benefit. If any Retirement Plan requires contributions by participants, the Additional Retirement Benefit shall be reduced to reflect the absence of contributions by the Executive and any matching contribution that would be contingent upon the Executive’s contributions shall be calculated as if the Executive made the maximum contribution allowable under the terms of such Retirement Plan. Where the Executive’s contribution for a given Retirement Plan is calculated by reference to salary and/or bonus, the Additional Retirement Benefit shall be calculated by reference to the Executive’s annual salary in effect on the Date of Termination and the bonus payout percentage achieved for the year of service preceding the Date of Termination, without adjustment for any future year increases that may have occurred absent the termination.
7
(b) For purposes of this Section 3.6, “Retirement Plans” are (i) any savings or retirement plan sponsored by the Company that is intended to be tax-qualified under Code section 401(a), and any arrangements that make up benefits that are not provided under such tax-qualified plans because of compensation or benefit limits under the terms of such plans or the Code, (ii) the Executive Stock Unit Program, and (iii) any deferred compensation program in which the Executive participates that is adopted after the effective date of this agreement that is intended to provide for retirement savings. For any Retirement Plan that is a defined benefit pension plan, the Additional Retirement Benefit shall be determined using the same interest rate and mortality factor that apply for determining actuarial equivalence in the applicable plans.
3.7 Termination Which Does Not Require Payment of Termination Benefits. No Termination Benefits shall be provided by the Company to the Executive under this Section 3 if the Executive’s employment is terminated:
(a) By his death; or
(b) By the Executive other than for Good Reason; or
(c) By the Company for Total Disability or for Cause under this Agreement.
3.8 Modified Cutback. If the Executive is entitled to Termination Benefits under this Agreement and other payments and/or benefits in connection with a change of ownership or effective control of the Company covered by §280G of the Code, as amended (collectively the “Company Payments”), and if such Company Payments would otherwise equal or exceed 300% of the Executive’s base amount as defined in §280G(b)(3) of the Code (the “Threshold Amount”), then the amount of the Company Payments will be reduced to an amount that is less than such Threshold Amount, but only if and to the extent such reduction will also result in, after taking into account all taxes, including any income taxes (together with any interest or penalties thereon) and any excise tax pursuant to Code §4999, a greater after-tax benefit to the Executive than the after-tax benefit to the Executive of the Company Payments computed without regard to any such reduction. If Company Payments must be reduced, the order of reduction shall be in accordance with Code Section 409A and unless otherwise required to satisfy Code Section 409A, (a) the amount of severance payable to the Executive under Section 3.4 of this Agreement shall be subject to reduction first, followed by payments under Section 3.5 of this Agreement, followed by cash payments under Section 3.6 of this Agreement, followed by any other cash payments that are not attributable to accelerated vesting or payment of Company stock, stock units or stock options, followed by payments under this Agreement that are not subject to Section 409A, followed by payments that are attributable to accelerated vesting or payment of Company stock, stock units or stock options, and (b) subject to the order of reductions specified in Subsection (a), the payments that would otherwise be made latest in time shall be reduced first and payments that would be otherwise be made at the same time shall be reduced pro rata.
8
To the extent requested by the Executive, the Company shall cooperate with the Executive in valuing services provided by the Executive (including, without limitation, the Executive refraining from performing services pursuant to a covenant not compete) before, on or after a change in ownership or control of the Company (within the meaning of §280G of the Code), such that payments in respect of such services may be considered reasonable compensation and/or exempt from the definition of “parachute payment” within §280G of the Code.
4. No Obligation to Mitigate
The Termination Benefits provided under Section 3 shall not be treated as damages, but rather shall be treated as severance compensation to which the Executive is entitled. The Executive shall not be required to mitigate the amount of any Termination Benefit provided under Section 3 by seeking other employment or otherwise; provided, however, any health welfare and fringe benefits that the Executive may receive from full time employment by a third person shall be applied against and reduce any such benefits thereafter to be made available to the Executive under Section 3.5.
5. Non-Competition
For two years after the Termination Date, the Executive shall not directly or indirectly (i) engage in any Competitive Activity, (ii) solicit orders from or seek or propose to do business with any customer of the Company or its subsidiaries or affiliates (collectively, the “Companies”) relating to any Competitive Activity, or (iii) influence or attempt to influence any employee, representative or advisor of the Companies to terminate his or her employment or relationship with the Companies. “Competitive Activity” means any manufacture, sale, distribution, engineering, design, promotion or other activity that competes with any business of the Companies in which the Executive was involved as an employee, consultant or agent.
If the Executive violates the preceding paragraph, then the Company’s sole remedy shall be to cease payment of any further Termination Benefits after the date of such violation. If any restriction in this Section is deemed unenforceable, then the parties contemplate that the appropriate court will reduce the scope or other provisions and enforce the restrictions set out in this section in their reduced form.
The restrictive covenants in this Section are in addition to any other restrictive covenants of the Executive, and are not in lieu of or modifications to such other restrictive covenants.
6. Timing of Payments
The taxable payments and taxable benefits in Sections 3.4 and 3.5 shall commence 6 months after the Date of Termination, at which date he shall receive a lump sum of installments and benefits which accrued from the Date of Termination through the date of such lump sum payment. Additional Retirement Benefits under Section 3.6 shall be paid in a lump sum 6 months after the Date of Termination; provided, however, that in the case of a Retirement Plan that is not
9
a tax-qualified plan, payment shall be made at such later date or event that is specified in such plan if the payment time or event is one described in Code Section 409A(a)(2)(A). Any coverage and benefits pursuant to Section 3.5 that are not taxable to the Executive shall commence within 60 days following the Date of Termination and the coverage or benefits shall be retroactive to the Date of Termination.
7. Successor; Binding Agreement
The Company will require any successor (whether direct or indirect, by purchase, merger, consolidation or otherwise) to all or substantially all of the business and/or assets of the Company to expressly assume and agree to perform this Agreement in the same manner and to the same extent that the Company would be required to perform it if no such succession had taken place. The assumption shall be by agreement in form and substance satisfactory to the Executive. Failure of the Company to obtain such agreement prior to the effectiveness of any such succession shall entitle the Executive to terminate his employment for Good Reason as provided in Section 2.4(g). As used in the Agreement “Company” means the Company as previously defined and any successor to its business and/or assets which executes and delivers the agreement provided for in this Section 7 or which otherwise becomes bound by all the terms and provisions of this Agreement by operation of law.
This Agreement shall inure to the benefit of and be enforceable by the Executive’s personal or legal representatives, executors, administrators, successors, heirs, distributes, devisees and legatees, but the Executive may not assign this Agreement. If the Executive should die while any amount would still be payable to him hereunder if he had continued to live, all such amounts, unless otherwise provided herein, shall be paid in accordance with the terms of this Agreement to his devisee, legatee or other designee or, if there be no such designee, to his estate.
8. Miscellaneous
8.1 Notice. All notices, elections, waivers and all other communications provided for in this Agreement shall be in writing and shall be deemed to have been duly given when delivered or mailed by United States certified mail, return receipt requested, postage prepaid, addressed to the respective addresses set forth on the first page of this Agreement, or to such other address as either party may have furnished to the other in writing in accordance herewith, except that notices of change of address shall be effective only upon receipt.
8.2 No Waiver. No provisions of this Agreement may be modified, waived or discharged unless such waiver, modification or discharge is agreed to in writing, signed by the Executive and an officer of the Company. No waiver by either party at any time of any breach by the other party of, or compliance with, any condition or provision of this Agreement to be performed by such other party shall be deemed a waiver of similar or dissimilar provisions or conditions at the same or at any prior or subsequent time. No agreements or representations, oral or otherwise, express or implied, with respect to the subject matter hereof have been made by either party which are not set forth expressly in this Agreement.
10
8.3 Enforceability. The invalidity or unenforceability of any provisions of this Agreement shall not affect the validity or enforceability of any other provision of this Agreement, which shall remain in full force and effect.
8.4 Governing Law. This Agreement shall be governed by and construed in accordance with the internal laws of the State of Missouri.
8.5 Disputes. Any dispute or controversy arising under or in connection with this Agreement shall be settled by arbitration in accordance with the Commercial Arbitration Rules procedures of the American Arbitration Association. If, at any time after 90 days from the Date of Termination, the Executive and the Company have not resolved any dispute or controversy arising under or in connection with this Agreement, either the Executive or the Company may notify the other of an intent to seek arbitration. Arbitration shall occur before a single arbitrator in the State of Missouri; provided, however, that if the parties cannot agree on the selection of such arbitrator within 30 days after the matter is referred to arbitration, each party shall select one arbitrator and those arbitrators shall jointly designate a third arbitrator to comprise a panel of three arbitrators. The decision of the arbitrator shall be rendered in writing, shall be final, and may be entered as a judgment in any court in the State of Missouri. The Company and the Executive each irrevocably consent to the jurisdiction of the federal and state courts located in the State of Missouri for this purpose. The Company shall pay, within 30 days of receipt of the arbitrator’s decision, all costs and expenses in connection with any arbitration under this Section 8.5, including without limitation all reasonable legal fees incurred by Executive in connection with such arbitration; provided, however, the Company shall not be obligated to pay unless the Executive prevails on the majority of the dollar amount at issue in the dispute.
8.6 Sections; Captions. All references in this Agreement to Sections refer to the applicable Sections of this Agreement. References in this Agreement to a given Section (e.g., Section 3) shall, unless the context requires otherwise, refer to all parts of such Section. The captions have been placed in this Agreement for ease of reference only. They shall not be used in the interpretation of this Agreement.
8.7 Term of Agreement. This Agreement shall continue in force so long as the Executive remains employed by the Company or any successor and shall apply to any Change in Control that occurs while the Executive remains so employed; provided, however, (i) the Agreement may be modified by the mutual agreement of the parties from time to time, including modifications to take into account changes in law, and (ii) three years after the date of this agreement, the Company or the Executive shall have the right to unilaterally terminate this Agreement upon 1 year written notice to the other party, so long as a Protected Period is not in effect.
8.8 Limited Right of Offset. Effective upon a Change in Control, the Company waives, and will not assert, any right to set off the amount of any claims, liabilities, damages or losses the Company may have against the Executive under this Agreement or otherwise if (i) the
11
Executive’s employment is terminated by the Company without Cause, or (ii) the Executive terminates his employment for Good Reason.
8.9. Release. Notwithstanding any other provision of this Agreement, the Executive shall receive payments and benefits under this Agreement only if the Executive timely executes, returns to the Company, and does not revoke a release and covenant not to sue agreement, in a form reasonably acceptable to the Executive and the Company’s legal counsel. The Company shall provide such agreement to the Executive in sufficient time so that if the Executive executes and returns the agreement to the Company within the time period permitted by the Company, the revocation period provided in the agreement will expire before the payments and benefits under this Agreement are required to commence pursuant to Section 6.
8.10 Successive Changes in Control. A separate Change in Control shall be deemed to have occurred with each occurrence of any event described in subsections (a) through (f) of Section 1.2. This Agreement pertains to each and every Change in Control, including successive Changes in Control involving the same controlling person(s).
8.11 Interpretation of Agreement and Application of Code Section 409A. This Agreement is intended to conform to the requirements of Code Section 409A and shall be interpreted accordingly. For such purposes, any stream of payments due under this Agreement shall be treated as a series of separate payments. The Executive shall be deemed to have terminated employment for purposes of this Agreement only if he has incurred a termination of employment that constitutes a “separation for service” within the meaning of Code Section 409A.
8.12 Withholding. The Company may withhold all federal, state, and local income and employment taxes relating to Termination Benefits as required under applicable laws and regulations.
8.13 Entire Agreement. This Agreement constitutes the entire agreement between the parties with respect to the subject matter hereof.
IN WITNESS WHEREOF, this Agreement has been signed as of the day and year first above written.
| EXECUTIVE: | Leggett & Platt, Incorporated | |||||||
| /s/ Steven K. Henderson | By: /s/ Karl G. Glassman | |||||||
| Steven K. Henderson | Karl G. Glassman | |||||||
| President and Chief Executive Officer | ||||||||
12
Exhibit 10.13.13
FORM OF RESTRICTED STOCK UNIT AWARD
Steven Kirk Henderson
(2018 and 2019 Grants)
On [July 31, 2018] [February 8, 2019] (the “Grant Date”), Leggett & Platt, Incorporated, (the “Company”) granted you a Restricted Stock Unit Award (“RSUs” or the “Award”), subject to the following terms.
1. Grant. The Company granted you 4,000 Restricted Stock Units on the Grant Date.
2. Vesting and Issuance. Except as provided in Section 4, the Award will vest in one-third increments on the first, second and third anniversaries of the Grant Date (the “Vesting Dates”). On each Vesting Date, you will be issued one share of the Company’s common stock for each vested RSU.
3. Termination of Employment. Except as provided in Section 4, if your employment is terminated before a Vesting Date, your right to any unvested shares under this Award will terminate immediately upon such termination of employment. The employment relationship will be treated as continuing intact while you are on military, sick leave or other bona fide leave of absence if (i) the Company does not terminate the employment relationship or (ii) your right to re-employment is guaranteed by statute or by contract.
4. Early Vesting. If your termination of employment is due to one of the following events, your Award will vest as follows:
(a)Death. If you die before the Award is vested, your Award will vest on the date of your death. The Company will issue shares to the designated beneficiary. If there is no designated beneficiary, the shares will be issued to the administrator, executor or personal representative of your estate.
(b)Disability. “Disability” means the inability to substantially perform your duties and responsibilities by reason of any accident or illness that can be expected to result in death or to last for a continuous period of not less than one year. If your service is terminated due to Disability, your Award will vest on the date of your Disability termination.
(c)Change in Control. If your service is terminated due to a Change in Control of the Company (as defined in the Flexible Stock Plan, the “Plan”), your Award will vest upon the Change in Control.
5. Transferability. The Award may not be transferred, assigned, pledged or otherwise encumbered until the underlying shares have been issued.
6. No Rights as Shareholder. You will not have the rights of a shareholder with respect to this Award until the underlying shares have been issued. You will not have the right to vote the shares or receive any dividends that may be paid on the underlying shares prior to issuance.
1
7. Restrictive Covenants. Due to your leadership role in the Company, you are in a position of trust and confidence and have access to and knowledge of valuable confidential information of the Company, including business processes, techniques, plans, and strategies across the Company, trade secrets, sensitive financial and legal information, terms and arrangements with business partners, customers, and suppliers, trade secrets, and other confidential information that if known outside the Company would cause irreparable harm to the Company.
For two years after each Vesting Date of this Award, you will not directly or indirectly (i) engage in any Competitive Activity, (ii) solicit orders from or seek or propose to do business with any customer or supplier of the Company or its subsidiaries or affiliates (collectively, the “Companies”) relating to any Competitive Activity, or (iii) influence or attempt to influence any employee, representative or advisor of the Companies to terminate his or her employment or relationship with the Companies. “Competitive Activity” means any manufacture, sale, distribution, engineering, design, promotion or other activity that competes with any business of the Companies in which you were involved as an employee, consultant or agent. You agree the covenants in this Section are reasonable in time and scope and justified based on your position and receipt of the Award. In the event you violate the terms of this Section, the two-year term of the restrictive covenants shall be automatically extended by the period you were violating any term of this Section.
If you violate the preceding paragraph, then you will pay to the Company any Award Gain you realized from this Award. “Award Gain” is equal to (i) the number of shares distributed to you on a Vesting Date of this Award times the fair market value of L&P stock on the such Vesting Date (including the tax withholding), minus (ii) any non-refundable taxes paid by you as a result of the distribution. In addition, the Company shall be entitled to seek a temporary or permanent injunction or other equitable relief against you for any breach or threatened breach of this Section from any court of competent jurisdiction, without the necessity of showing any actual damages or showing money damages would not afford an adequate remedy, and without the necessity of posting any bond or other security. Such equitable relief shall be in addition to, not in lieu of, any legal remedies, monetary damages, or other available forms of relief.
If any restriction in this Section is deemed unenforceable, then you and the Company contemplate that the appropriate court will reduce the scope or other provisions and enforce the restrictions set out in this section in their reduced form. The covenants in this Section are in addition to any similar covenants under any other agreement between the Company and you.
8. Withholding. You will recognize taxable income equal to the fair market value of the shares on each Vesting Date. This amount is subject to ordinary income tax and payroll tax. The Company may withhold from the shares issued any amount required to satisfy applicable tax laws (at the Company’s required withholding rate).
The income and tax withholding generated by the issuance of shares to you will be reported on your W-2. If your personal income tax rate is higher than the Company’s minimum required withholding rate, you will owe additional tax on the issuance. After payment of the ordinary income tax, your shares will have a tax basis equal to the closing price of L&P stock on the Vesting Date.
9. Award Not Benefit Eligible. This Award will be considered special incentive compensation and will not be included as earnings, wages, salary or compensation in any pension, retirement, welfare, life insurance or other employee benefit plan or arrangement of the Company.
2
10. Section 409A. The Company believes this Award constitutes a short-term deferral within the meaning of Section 409A of the Internal Revenue Code and the regulations thereunder. Notwithstanding anything contained in these terms and conditions, it is intended that the Award will at all times meet the requirements of Section 409A and any regulations or other guidance issued thereunder, and that the provisions of the Award will be interpreted to meet such requirements.
To the extent permitted by Section 409A, the Committee retains the right to delay a distribution of this Award if the distribution would violate securities laws or otherwise result in material harm to the Company.
11. Plan Controls; Committee. This Award is subject to all terms, provisions and definitions of the Plan, which is incorporated by reference. In the event of any conflict, the Plan will control over this Award. Upon request, a copy of the Plan will be furnished to you. The Plan is administered by a committee of non-employee directors or their designees (the “Committee”). The Committee’s decisions and interpretations with regard to this Award will be binding and conclusive.
12. Data Privacy. You acknowledge and agree that the Company may collect and use your personal information to implement and administer the Award. This personal information may include, without limitation, your: employee identification number; first and last names; home and other physical address; email addresses; telephone and fax numbers; organization name, job title, and department name; reporting hierarchy; work history; performance ratings; and payroll information. You further acknowledge and agree that the Company may disclose such information to non-agent third parties assisting the Company in administering Award.
Additional information concerning the Company’s collection and use of your personal information is available in the Privacy Policy located on the Company’s intranet site.
13. Governing Law. This Award is entered into and accepted in Carthage, Missouri. The Award will be governed by Missouri law, excluding any conflicts or choice of law provision that might otherwise refer construction or interpretation of the Award to the substantive law of another jurisdiction.
Any action or proceeding arising from or related to this Award is subject to the exclusive venue and subject matter jurisdiction of the Circuit Court for Jasper County, Missouri or the United States District Court for the Western District of Missouri, and the parties agree to submit to the jurisdiction of such Courts. The parties also waive the defense of an inconvenient forum and agree not to seek any change of venue from such Courts.
3
Exhibit 10.13.14
RESTRICTED STOCK UNIT AWARD
Steve Henderson
On September 18, 2017, (the “Grant Date”), Leggett & Platt, Incorporated, (the “Company”) granted you a Restricted Stock Unit Award (“RSUs” or the “Award”), subject to the following terms.
1. Grant. The Company granted you 6,000 Restricted Stock Units on the Grant Date.
2. Vesting and Issuance. Except as provided in Section 4, the Award will vest in one-third increments on the first, second and third anniversaries of the Grant Date (the “Vesting Dates”). On each Vesting Date, you will be issued one share of the Company’s common stock for each vested RSU.
3 Termination of Employment. Except as provided in Section 4, if your employment is terminated before a Vesting Date, your right to any unvested shares under this Award will terminate immediately upon such termination of employment. The employment relationship will be treated as continuing intact while you are on military, sick leave or other bona fide leave of absence if (i) the Company does not terminate the employment relationship or (ii) your right to re-employment is guaranteed by statute or by contract.
4. Early Vesting. If your termination of employment is due to one of the following events, your Award will vest as follows:
(a)Death. If you die before the Award is vested, your Award will vest on the date of your death. The Company will issue shares to the designated beneficiary. If there is no designated beneficiary, the shares will be issued to the administrator, executor or personal representative of your estate.
(b)Disability. “Disability” means the inability to substantially perform your duties and responsibilities by reason of any accident or illness that can be expected to result in death or to last for a continuous period of not less than one year. If your service is terminated due to Disability, your Award will vest on the date of your Disability termination.
(c)Change in Control. If your service is terminated due to a Change in Control of the Company (as defined in the Flexible Stock Plan), your Award will vest upon the Change in Control.
5. Transferability. The Award may not be transferred, assigned, pledged or otherwise encumbered until the underlying shares have been issued.
6. No Rights as Shareholder. You will not have the rights of a shareholder with respect to this Award until the underlying shares have been issued. You will not have the right to
1
vote the shares or receive any dividends that may be paid on the underlying shares prior to issuance.
7. Noncompetition. For two years after each Vesting Date of this Award, you will not directly or indirectly (i) engage in any Competitive Activity, (ii) solicit orders from or seek or propose to do business with any customer of the Company or its subsidiaries or affiliates (collectively, the “Companies”) relating to any Competitive Activity, or (iii) influence or attempt to influence any employee, representative or advisor of the Companies to terminate his or her employment or relationship with the Companies. “Competitive Activity” means any manufacture, sale, distribution, engineering, design, promotion or other activity that competes with any business of the Companies in which you were involved as an employee, consultant or agent.
If you violate the preceding paragraph, then you will pay to the Company any Award Gain you realized from this Award. “Award Gain” is equal to (i) the number of shares distributed to you on a Vesting Date of this Award times the fair market value of L&P stock on the such Vesting Date (including the tax withholding), minus (ii) any non-refundable taxes paid by you as a result of the distribution.
If any restriction in this Section is deemed unenforceable, then you and the Company contemplate that the appropriate court will reduce the scope or other provisions and enforce the restrictions set out in this section in their reduced form. The covenants in this Section are in addition to any similar covenants under any other agreement between the Company and you.
8. Withholding. You will recognize taxable income equal to the fair market value of the shares on each Vesting Date. This amount is subject to ordinary income tax and payroll tax. The Company may withhold from the shares issued any amount required to satisfy applicable tax laws (at the Company’s required withholding rate). The Company, at its discretion, may allow you to pay the taxes in cash if you make suitable arrangements with the Company prior to each Vesting Date.
The income and tax withholding generated by the issuance of shares to you will be reported on your W-2. If your personal income tax rate is higher than the Company’s minimum required withholding rate, you will owe additional tax on the issuance. After payment of the ordinary income tax, your shares will have a tax basis equal to the closing price of L&P stock on the Vesting Date.
9. Award Not Benefit Eligible. This Award will be considered special incentive compensation and will not be included as earnings, wages, salary or compensation in any pension, retirement, welfare, life insurance or other employee benefit plan or arrangement of the Company.
10. Section 409A. The Company believes this Award constitutes a short-term deferral within the meaning of Section 409A of the Internal Revenue Code and the regulations thereunder. Notwithstanding anything contained in the these terms and conditions, it is intended that the Award will at all times meet the requirements of Section 409A and any regulations or other guidance issued thereunder, and that the provisions of the Award will be interpreted to meet such requirements.
2
To the extent permitted by Section 409A, the Committee retains the right to delay a distribution of this Award if the distribution would violate securities laws or otherwise result in material harm to the Company.
11. Plan Controls; Committee. This Award is subject to all terms, provisions and definitions of the Flexible Stock Plan (the “Plan”), which is incorporated by reference. In the event of any conflict, the Plan will control over this Award. Upon request, a copy of the Plan will be furnished to you. The Plan is administered by a committee of non-employee directors or their designees (the “Committee”). The Committee’s decisions and interpretations with regard to this Award will be binding and conclusive.
12. Governing Law. This Award is entered into and accepted in Carthage, Missouri. The Award will be governed by Missouri law, excluding any conflicts or choice of law provision that might otherwise refer construction or interpretation of the Award to the substantive law of another jurisdiction.
3
Exhibit 21
Schedule of Subsidiaries of the Company
| Name | Doing Business As | % of Ownership | Place of Incorporation or Organization | ||||||||
| Administradora Soal S.A. de C.V. | 100% | Mexico | |||||||||
| Atlas Spring Manufacturing Corp. | 100% | California | |||||||||
| Buffalo Batt & Felt, LLC | 100% | Delaware | |||||||||
| Changshu L&V Automobile Motion Co. Ltd. | 100% | China | |||||||||
| Chieng Yeng Ent. Co., Ltd. | 100% | British Virgin Islands | |||||||||
| Church Corporate Park Owner’s Association, LLC | 62% | Delaware | |||||||||
| Crest-Foam Corp. | Edison Foam Processing Corp. | 100% | New Jersey | ||||||||
| Industrial Components Group | |||||||||||
| L&P Carpet Cushion | |||||||||||
| L&P Flooring Products | |||||||||||
| Leggett & Platt Carpet Cushion | |||||||||||
| Leggett & Platt Carpet Cushion Division | |||||||||||
| Leggett & Platt Flooring Products | |||||||||||
| S.C.S. | |||||||||||
| Sleep Comfort Systems by Leggett & Platt | |||||||||||
| David Hart Aerospace Pipes Limited | 100% | United Kingdom | |||||||||
| David Hart Aerospace Pipes (Machining Division) Ltd | 100% | United Kingdom | |||||||||
| De Todo en Alambre de Aguascalientes, S. de R.L. de C.V. | 100% | Mexico | |||||||||
| DHAP Corporate Trustee Limited | 100% | United Kingdom | |||||||||
| DHAP Ltd | 100% | United Kingdom | |||||||||
| Dresher, Inc. | Harris-Hub Company, Inc. | 100% | Delaware | ||||||||
| Eagan Products, LLC | 100% | Delaware | |||||||||
| Elite Comfort Solutions LLC | 100% | Delaware | |||||||||
| Elite Comfort Solutions, Inc. | 100% | Delaware | |||||||||
| Fides s.r.l. | 100% | Italy | |||||||||
| Flex-O-Lators, Incorporated | 100% | Missouri | |||||||||
| Fo Shan City Nan Hai Chieng Yeng Plastic & Hardware Product Co., Ltd. | 100% | China | |||||||||
| Guangdong Zhaoqing L&V Co. Ltd. | 100% | China | |||||||||
| Hanes CNC Services Co. | 100% | North Carolina | |||||||||
| Hanes Companies - New Jersey, LLC | Hanes | 100% | Delaware | ||||||||
| Hanes Companies | |||||||||||
| Hanes Converting Company | |||||||||||
| Hanes Engineered Materials | |||||||||||
| Name | Doing Business As | % of Ownership | Place of Incorporation or Organization | ||||||||
| Hanes Fabrics Company | |||||||||||
| Hanes Geo Components | |||||||||||
| Hanes Trading Company | |||||||||||
| Hanes Companies Foundation | 100% | North Carolina | |||||||||
| Hanes Companies, Inc. | Attila Environmental Products | 100% | North Carolina | ||||||||
| Civ-Con | |||||||||||
| Civ-Con Products & Solutions | |||||||||||
| DDD Erosion Control | |||||||||||
| ERO-TEX | |||||||||||
| Geo-Civ Products | |||||||||||
| Geotex Supply | |||||||||||
| Greenscapes Home and Garden Products | |||||||||||
| Hanes | |||||||||||
| Hanes Companies | |||||||||||
| Hanes Companies - New Jersey | |||||||||||
| Hanes Converting Company | |||||||||||
| Hanes Dye & Finishing Division | |||||||||||
| Hanes Engineered Materials | |||||||||||
| Hanes Fabrics Company | |||||||||||
| Hanes Geo Components | |||||||||||
| Hanes Industries Division | |||||||||||
| Hanes Industries Division, Inc. | |||||||||||
| Hanes Industries Engineered Materials | |||||||||||
| Hanes Trading Company | |||||||||||
| Hill Country Culvert | |||||||||||
| Hill Country Culverts | |||||||||||
| Hill Country Site Supply | |||||||||||
| Ikex | |||||||||||
| Interwoven | |||||||||||
| Interwoven Group | |||||||||||
| Jarex | |||||||||||
| JMD Geo Components | |||||||||||
| Lone Star Geo Products | |||||||||||
| North American Textile | |||||||||||
| North American Textiles | |||||||||||
| North American Textile Component | |||||||||||
| North American Textile Components | |||||||||||
| Price & Company | |||||||||||
| VWR Textiles & Supplies | |||||||||||
| Webtec | |||||||||||
2
| Name | Doing Business As | % of Ownership | Place of Incorporation or Organization | ||||||||
| West End Textiles Company | |||||||||||
| Hongkong Veilon Limited | 100% | Hong Kong | |||||||||
| Jiaxing Ellermann Asia Trading Ltd. | 100% | China | |||||||||
| JP&S Holdings Limited | 100% | United Kingdom | |||||||||
| JP&S Unlimited | 100% | United Kingdom | |||||||||
| Kintec-Solution GmbH | 100% | Germany | |||||||||
| L and C Windsor Cables Ltd. | 100% | Canada | |||||||||
| L and G Acquisition Company, LLC | 100% | Delaware | |||||||||
| L and P Mexico, S. de R.L. de C.V. | L and P Mexico, Incorporated | 100% | Mexico | ||||||||
| L and P Springs South Africa (Pty) Ltd. | 100% | S. Africa | |||||||||
| L&C Changsha Cable Industries Ltd. | 100% | China | |||||||||
| L&C Suizhou Cable Industries Ltd. | 100% | China | |||||||||
| L&P Acquisition Company - 58 | 100% | Delaware | |||||||||
| L&P Acquisition Company - 59 | 100% | Delaware | |||||||||
| L&P Acquisition Company - 62 | 100% | Delaware | |||||||||
| L&P Acquisition LLC - 10 | 100% | Delaware | |||||||||
| L&P Acquisition LLC - 21 | 100% | Delaware | |||||||||
| L&P Automotive (Korea) LLC | 100% | South Korea | |||||||||
| L&P Automotive Europe GmbH | 100% | Germany | |||||||||
| L&P Automotive Europe Headquarters GmbH | 100% | Germany | |||||||||
| L&P Automotive France SAS | 100% | France | |||||||||
| L&P Automotive Japan Ltd. | 100% | Japan | |||||||||
| L&P Automotive Luxembourg, S.à r.l. | 100% | Luxembourg | |||||||||
| L&P Denmark ApS | 100% | Denmark | |||||||||
| L&P Electric, Inc. | Leggett & Platt Electric, Inc. | 100% | Delaware | ||||||||
| L&P Europe SCS | 100% | Luxembourg | |||||||||
| L&P Financial Services Co. | Hi Life Products | 100% | Delaware | ||||||||
| Industrial Components Group | |||||||||||
| L&P Carpet Cushion | |||||||||||
| L&P Flooring Products | |||||||||||
| Leggett & Platt Carpet Cushion | |||||||||||
| Leggett & Platt Flooring Products | |||||||||||
| L&P Holdings, Inc. | 100% | Delaware | |||||||||
| L&P Hungary Ltd. | 100% | Hungary | |||||||||
| L&P International Holdings Company | 100% | Delaware | |||||||||
| L&P Materials Manufacturing, Inc. | Adcom Wire | 100% | Delaware | ||||||||
| Adcom Wire Company | |||||||||||
| Consumer Products Group | |||||||||||
3
| Name | Doing Business As | % of Ownership | Place of Incorporation or Organization | ||||||||
| L&P Flooring Products | |||||||||||
| Leggett & Platt Consumer Products Group | |||||||||||
| Leggett & Platt Flooring Products | |||||||||||
| Mary Ann Industries | |||||||||||
| L&P Netherlands Holdings B.V. | 100% | Netherlands | |||||||||
| L&P Property Foremost Industrial Park LLC | 100% | Michigan | |||||||||
| L&P Property Management Company | Consumer Products | 100% | Delaware | ||||||||
| Consumer Products Group | |||||||||||
| IDEA Center | |||||||||||
| L&P PMC, Inc. | |||||||||||
| Leggett & Platt Consumer Products | |||||||||||
| Leggett & Platt West Coast Furniture | |||||||||||
| L&P Real Estate Services, LLC | 100% | Missouri | |||||||||
| L&P Springs Denmark ApS | 100% | Denmark | |||||||||
| L&P Springs Manufacturing, LLC | 100% | Delaware | |||||||||
| L&P Supply Chain Management, LLC | 100% | Delaware | |||||||||
| L&P Swiss Holding GmbH | 100% | Switzerland | |||||||||
| L&P Transportation LLC | L&P Global Supply Chain | 100% | Delaware | ||||||||
| Leggett & Platt Consumer Products Group | |||||||||||
| Leggett & Platt Global Supply Chain | |||||||||||
| Leggett & Platt Transportation, LLC | |||||||||||
| L&P UK Holdings LP | 100% | United Kingdom | |||||||||
| L&P UK-1 Limited | 100% | United Kingdom | |||||||||
| L&P UK-2 Limited | 100% | United Kingdom | |||||||||
| L&P/Chieng Yeng Management Co. Limited | 100% | Hong Kong | |||||||||
| L&V 5 México, S. de R.L. de C.V. | 100% | Mexico | |||||||||
| Landmark Earth Solutions, Inc. | 100% | Nevada | |||||||||
| Leggett & Platt (Guangzhou) Co. Ltd. | 100% | China | |||||||||
| Leggett & Platt (Jiaxing) Co. Ltd. | 100% | China | |||||||||
| Leggett & Platt (Shanghai) Co. Ltd. | 100% | China | |||||||||
| Leggett & Platt (Shanghai) Consulting Co. Ltd. | 100% | China | |||||||||
| Leggett & Platt (Shanghai) Machinery Technology Co., Ltd. | 100% | China | |||||||||
4
| Name | Doing Business As | % of Ownership | Place of Incorporation or Organization | ||||||||
| Leggett & Platt (Taizhou) Co. Ltd. | 100% | China | |||||||||
| Leggett & Platt Administradora, S.A. de C.V. | 100% | Mexico | |||||||||
| Leggett & Platt Aerospace Middletown, LLC | L&P Aerospace | 100% | Delaware | ||||||||
| Leggett & Platt Aerospace | |||||||||||
| Pegasus Manufacturing | |||||||||||
| Leggett & Platt Asia (HT) Limited | 100% | Hong Kong | |||||||||
| Leggett & Platt Asia Limited | L&P Global Supply Chain Solutions | 100% | Hong Kong | ||||||||
| Leggett & Platt Automotive Group - New Jersey, LLC | 100% | Delaware | |||||||||
| Leggett & Platt Automotive Group de Mexico, S. de R.L. de C.V. | 100% | Mexico | |||||||||
| Leggett & Platt Automotive India Private Limited | 100% | India | |||||||||
| Leggett & Platt Canada Co. | 100% | Canada | |||||||||
| Canadian Furniture | |||||||||||
| Crown North America | |||||||||||
| Crown-VMS | |||||||||||
| Design Fabricators | |||||||||||
| Design Fabricators/Fabricants de Design | |||||||||||
| Globe Spring | |||||||||||
| Hanes Engineered Materials | |||||||||||
| Hanes Geo Components | |||||||||||
| Hanes Geo Components/Geocomposites Hanes | |||||||||||
| Hanes Industries | |||||||||||
| L&P Automotive Group | |||||||||||
| L&P Automotive Group London | |||||||||||
| L&P Plastics | |||||||||||
| L&P Plastics/Plastiques L et P | |||||||||||
| L&P Work Furniture | |||||||||||
| Leggett & Platt Automotive Group | |||||||||||
| Leggett & Platt Work Furniture | |||||||||||
| Leggettwood | |||||||||||
| Leggettwood, Roberval | |||||||||||
| Leggettwood, St-Germain | |||||||||||
| Leggettwood, St-Nicolas | |||||||||||
| Lenrod | |||||||||||
| Lenrod - Hanes | |||||||||||
| Lenrod Industries | |||||||||||
5
| Name | Doing Business As | % of Ownership | Place of Incorporation or Organization | ||||||||
| Lenrod Industries, a Division of Leggett & Platt Canada Co. | |||||||||||
| Les Industries Lenrod | |||||||||||
| Les Industries Lenrod, une Division de Societe Leggett & Platt Canada | |||||||||||
| No-Sag Spring Company | |||||||||||
| Northfield Metal Products | |||||||||||
| Paris Spring | |||||||||||
| Rothtex | |||||||||||
| Schukra of North America | |||||||||||
| Spruceland Forest Products | |||||||||||
| Vehicle Management Systems | |||||||||||
| VMS | |||||||||||
| Westex | |||||||||||
| Westex International | |||||||||||
| Wiz Wire and Spring | |||||||||||
| Leggett & Platt Components Company, Inc. | Ark-Ell Springs | 100% | Delaware | ||||||||
| Cameo Fibers | |||||||||||
| Cumulus Fibres | |||||||||||
| Industrial Components Group | |||||||||||
| L&P Carpet Cushion | |||||||||||
| L&P Flooring Products | |||||||||||
| L&P Work Furniture | |||||||||||
| Leggett & Platt Bedding | |||||||||||
| Leggett & Platt Carpet Cushion | |||||||||||
| Leggett & Platt Flooring Products | |||||||||||
| Leggett & Platt Work Furniture | |||||||||||
| Matrex | |||||||||||
| Matrex Furniture Components | |||||||||||
| Moiron | |||||||||||
| Omega Motion | |||||||||||
| Petco Sackner | |||||||||||
| Sackner | |||||||||||
| Sterling & Adams Bentwood | |||||||||||
| Super Sagless Hardware | |||||||||||
| Tupelo Sleeper | |||||||||||
| Leggett & Platt Components Europe Limited | Wellhouse | 100% | United Kingdom | ||||||||
| Wellhouse Wire Products | |||||||||||
| Leggett & Platt de Mexico, S. de R.L. de C.V. | Leggett & Platt de Mexico, Incorporated | 100% | Mexico | ||||||||
| Leggett & Platt do Brasil Ltda. | 100% | Brazil | |||||||||
| Leggett & Platt Eastern Europe LLC | 100% | Russia | |||||||||
6
| Name | Doing Business As | % of Ownership | Place of Incorporation or Organization | ||||||||
| Leggett & Platt Europe Finance SCS | 100% | Luxembourg | |||||||||
| Leggett & Platt France | 100% | France | |||||||||
| Leggett & Platt International Service Corporation | 100% | Delaware | |||||||||
| Leggett & Platt International Trade (Shanghai) Co., Ltd. | 100% | China | |||||||||
| Leggett & Platt Luxembourg Holdings S.à r.l. | Leggett & Platt Luxembourg Holdings, S.a r.l., Incorporated – US Branch | 100% | Luxembourg | ||||||||
| Leggett & Platt Luxembourg S.à r.l. | 100% | Luxembourg | |||||||||
| Leggett & Platt Middle East, Incorporated | 100% | Delaware | |||||||||
| Leggett & Platt Office Components, LLC | L&P Work Furniture | 100% | Delaware | ||||||||
| Leggett & Platt Work Furniture | |||||||||||
| LP Cincro | |||||||||||
| Leggett & Platt Office Components International S.r.l. | 100% | Italy | |||||||||
| Leggett & Platt Residencial, S. de R.L. de C.V. | 100% | Mexico | |||||||||
| Leggett & Platt Servicios Comerciales, S.A. de C.V. | 100% | Mexico | |||||||||
| Leggett & Platt Servicios de Manufactura, S.A. de C.V. | 100% | Mexico | |||||||||
| Leggett & Platt Servicios Ejecutivos, S. de R.L. de C.V. | 100% | Mexico | |||||||||
| Leggett & Platt Tax Partnership | 100% | Missouri | |||||||||
| Leggett & Platt Texas Properties, LLC | 100% | Texas | |||||||||
| Leggett & Platt U.K. Limited | 100% | United Kingdom | |||||||||
| Legplat, S. de R.L. de C.V. | 100% | Mexico | |||||||||
| LPI Michigan Realty LLC | 100% | Delaware | |||||||||
| LPT d.o.o. | 100% | Croatia | |||||||||
| Luxco Holdings, LLC | 100% | Delaware | |||||||||
| Nestaway LLC | 100% | Delaware | |||||||||
| ORG PHC Midco, Inc. | 100% | Delaware | |||||||||
| Peterson Chemical Technology, LLC | 100% | Texas | |||||||||
| Portstewart Capital, LLC | 100% | Delaware | |||||||||
| Portstewart Funding, LLC | 100% | Delaware | |||||||||
| Precision Hydraulic Cylinders (UK) Limited | 100% | United Kingdom | |||||||||
| Precision Hydraulic Cylinders, Inc. | PHC | 100% | North Carolina | ||||||||
| Precision Hydraulic | |||||||||||
| Precision Hydraulic Cylinders | |||||||||||
| Precision Hydraulics Private Limited | 100% | India | |||||||||
7
| Name | Doing Business As | % of Ownership | Place of Incorporation or Organization | ||||||||
| Pullmaflex Benelux N.V. | 100% | Belgium | |||||||||
| Pullmaflex International Limited | 100% | United Kingdom | |||||||||
| Pullmaflex Southern Africa (Proprietary) Limited | 49% | South Africa | |||||||||
| Pullmaflex U.K. Limited | 100% | United Kingdom | |||||||||
| Schukra Berndorf Ges.m.b.H. | 100% | Austria | |||||||||
| SCHUKRA Geratebau GmbH | 100% | Austria | |||||||||
| SCI Parent, Inc. | 100% | Delaware | |||||||||
| Specitubes SAS | 100% | France | |||||||||
| Sponge-Cushion, Inc. | 100% | Illinois | |||||||||
| Spuhl GmbH | 100% | Switzerland | |||||||||
| Sterling Steel Company, LLC | 100% | Delaware | |||||||||
| Suncoast Lots 579, LLC | 100% | Florida | |||||||||
| TAG Environmental Inc. | 51% | Canada | |||||||||
| Taizhou Intes-Leggett & Platt Special Textile Co., Ltd. | 50% | China | |||||||||
| Terrafix Environmental Technology Inc. | 100% | Canada | |||||||||
| Terrafix Geosynthetics Inc. | 100% | Canada | |||||||||
| Trio Line Polska sp. z o.o. | 85% | Poland | |||||||||
| Valley Metals, LLC | L&P Aerospace | 100% | California | ||||||||
| Leggett & Platt Aerospace | |||||||||||
| Walk-On Products, Inc. | L&P Flooring Products | 100% | North Carolina | ||||||||
| Leggett & Platt Flooring Products | |||||||||||
| Western Pneumatic Tube Company, LLC | L&P Aerospace | 100% | Washington | ||||||||
| Leggett & Platt Aerospace | |||||||||||
| Western Pneumatic Tube Holding, LLC | 100% | Delaware | |||||||||
| Wuxi Leggett & Platt-Huaguang Automobile Parts Co. Ltd. | 100% | China | |||||||||
8
Exhibit 23
CONSENT OF INDEPENDENT REGISTERED PUBLIC ACCOUNTING FIRM
We hereby consent to the incorporation by reference in the Registration Statements listed below of Leggett & Platt, Incorporated of our report dated February 24, 2021 relating to the consolidated financial statements, financial statement schedule and the effectiveness of internal control over financial reporting, which appears in this Form 10-K.
| 1 | . | Form S-3ASR, Registration No. 333-223621 | ||||||
| 2 | . | Form S-8, Registration No. 333-157536 | ||||||
| 3 | . | Form S-8, Registration No. 333-166960 | ||||||
| 4 | . | Form S-8, Registration No. 333-181432 | ||||||
| 5 | . | Form S-8, Registration No. 333-203992 | ||||||
| 6 | . | Form S-8, Registration No. 333-203995 | ||||||
| 7 | . | Form S-8, Registration No. 333-210077 | ||||||
| 8 | . | Form S-8, Registration No. 333-228189 | ||||||
/s/ PricewaterhouseCoopers LLP
St. Louis, Missouri
February 24, 2021
Exhibit 24
POWER OF ATTORNEY
KNOW ALL MEN BY THESE PRESENTS, that each of the undersigned directors of LEGGETT & PLATT, INCORPORATED, a Missouri corporation (the "Corporation"), does hereby nominate, constitute and appoint Karl G. Glassman, J. Mitchell Dolloff and Scott S. Douglas, or any one of them individually, his or her true and lawful attorneys-in-fact, to sign in the name of and on behalf of the undersigned directors of the Corporation and to file with the Securities and Exchange Commission ("SEC") the Corporation’s Annual Report on Form 10-K for the fiscal year ended December 31, 2020, and any other document or further Amendment to said Annual Report, and to take such other action, all as said attorneys-in-fact, or any one of them individually, deem necessary or advisable to the end that such Annual Report or Amendments thereto in respect of same, shall comply with the Securities Exchange Act of 1934, as amended, and the applicable rules of the SEC thereunder; and does hereby ratify and confirm all that said attorneys-in-fact, and each of them individually, may do by virtue hereof. This Power of Attorney may be signed in multiple counterparts, and all such counterparts, collectively, shall constitute a single document.
IN WITNESS WHEREOF, the undersigned have executed this Power of Attorney or a counterpart hereof as of the 23rd day of February 2021.
/s/ MARK A. BLINN | /s/ JOSEPH W. MCCLANATHAN | |||||||
| Mark A. Blinn | Joseph W. McClanathan | |||||||
/s/ ROBERT E. BRUNNER | /s/ JUDY C. ODOM | |||||||
| Robert E. Brunner | Judy C. Odom | |||||||
/s/ MARY CAMPBELL | /s/ SRIKANTH PADMANABHAN | |||||||
| Mary Campbell | Srikanth Padmanabhan | |||||||
/s/ J. MITCHELL DOLLOFF | /s/ JAI SHAH | |||||||
| J. Mitchell Dolloff | Jai Shah | |||||||
/s/ MANUEL A. FERNANDEZ | /s/ PHOEBE A. WOOD | |||||||
| Manuel A. Fernandez | Phoebe A. Wood | |||||||
/s/ KARL G. GLASSMAN | ||||||||
| Karl G. Glassman | ||||||||
Exhibit 31.1
CERTIFICATION
I, Karl G. Glassman, certify that:
1. I have reviewed this report on Form 10-K of Leggett & Platt, Incorporated;
2. Based on my knowledge, this report does not contain any untrue statement of a material fact or omit to state a material fact necessary to make the statements made, in light of the circumstances under which such statements were made, not misleading with respect to the period covered by this report;
3. Based on my knowledge, the financial statements, and other financial information included in this report, fairly present in all material respects the financial condition, results of operations, and cash flows of the registrant as of, and for, the periods presented in this report;
4. The registrant's other certifying officer(s) and I are responsible for establishing and maintaining disclosure controls and procedures (as defined in Exchange Act Rules 13a-15(e) and 15d-15(e)) and internal control over financial reporting (as defined in Exchange Act Rules 13a-15(f) and 15d-15(f)) for the registrant and have:
a) Designed such disclosure controls and procedures, or caused such disclosure controls and procedures to be designed under our supervision, to ensure that material information relating to the registrant, including its consolidated subsidiaries, is made known to us by others within those entities, particularly during the period in which this report is being prepared;
b) Designed such internal control over financial reporting, or caused such internal control over financial reporting to be designed under our supervision, to provide reasonable assurance regarding the reliability of financial reporting and the preparation of financial statements for external purposes in accordance with generally accepted accounting principles;
c) Evaluated the effectiveness of the registrant's disclosure controls and procedures and presented in this report our conclusions about the effectiveness of the disclosure controls and procedures, as of the end of the period covered by this report based on such evaluation; and
d) Disclosed in this report any change in the registrant's internal control over financial reporting that occurred during the registrant's most recent fiscal quarter (the registrant's fourth fiscal quarter in the case of an annual report) that has materially affected, or is reasonably likely to materially affect, the registrant's internal control over financial reporting; and
5. The registrant's other certifying officer(s) and I have disclosed, based on our most recent evaluation of internal control over financial reporting, to the registrant's auditors and the audit committee of the registrant's board of directors (or persons performing the equivalent functions):
a) All significant deficiencies and material weaknesses in the design or operation of internal control over financial reporting which are reasonably likely to adversely affect the registrant's ability to record, process, summarize, and report financial information; and
b) Any fraud, whether or not material, that involves management or other employees who have a significant role in the registrant's internal control over financial reporting.
| Date: | February 24, 2021 | /s/ KARL G. GLASSMAN | ||||||
| Karl G. Glassman | ||||||||
| Chairman and Chief Executive Officer | ||||||||
| Leggett & Platt, Incorporated | ||||||||
Exhibit 31.2
CERTIFICATION
I, Jeffrey L. Tate, certify that:
1. I have reviewed this report on Form 10-K of Leggett & Platt, Incorporated;
2. Based on my knowledge, this report does not contain any untrue statement of a material fact or omit to state a material fact necessary to make the statements made, in light of the circumstances under which such statements were made, not misleading with respect to the period covered by this report;
3. Based on my knowledge, the financial statements, and other financial information included in this report, fairly present in all material respects the financial condition, results of operations, and cash flows of the registrant as of, and for, the periods presented in this report;
4. The registrant's other certifying officer(s) and I are responsible for establishing and maintaining disclosure controls and procedures (as defined in Exchange Act Rules 13a-15(e) and 15d-15(e)) and internal control over financial reporting (as defined in Exchange Act Rules 13a-15(f) and 15d-15(f)) for the registrant and have:
a) Designed such disclosure controls and procedures, or caused such disclosure controls and procedures to be designed under our supervision, to ensure that material information relating to the registrant, including its consolidated subsidiaries, is made known to us by others within those entities, particularly during the period in which this report is being prepared;
b) Designed such internal control over financial reporting, or caused such internal control over financial reporting to be designed under our supervision, to provide reasonable assurance regarding the reliability of financial reporting and the preparation of financial statements for external purposes in accordance with generally accepted accounting principles;
c) Evaluated the effectiveness of the registrant's disclosure controls and procedures and presented in this report our conclusions about the effectiveness of the disclosure controls and procedures, as of the end of the period covered by this report based on such evaluation; and
d) Disclosed in this report any change in the registrant's internal control over financial reporting that occurred during the registrant's most recent fiscal quarter (the registrant's fourth fiscal quarter in the case of an annual report) that has materially affected, or is reasonably likely to materially affect, the registrant's internal control over financial reporting; and
5. The registrant's other certifying officer(s) and I have disclosed, based on our most recent evaluation of internal control over financial reporting, to the registrant's auditors and the audit committee of the registrant's board of directors (or persons performing the equivalent functions):
a) All significant deficiencies and material weaknesses in the design or operation of internal control over financial reporting which are reasonably likely to adversely affect the registrant's ability to record, process, summarize, and report financial information; and
b) Any fraud, whether or not material, that involves management or other employees who have a significant role in the registrant's internal control over financial reporting.
| Date: | February 24, 2021 | /s/ JEFFREY L. TATE | ||||||
| Jeffrey L. Tate | ||||||||
| Executive Vice President and Chief Financial Officer | ||||||||
| Leggett & Platt, Incorporated | ||||||||
Exhibit 32.1
CERTIFICATION PURSUANT TO
18 U.S.C. SECTION 1350
AS ADOPTED PURSUANT TO
SECTION 906 OF THE SARBANES-OXLEY ACT OF 2002
In connection with the Annual Report of Leggett & Platt, Incorporated (the “Company”) on Form 10-K for the period ended December 31, 2020, as filed with the Securities and Exchange Commission on the date hereof (the “Report”), I, Karl G. Glassman, certify, pursuant to 18 U.S.C. § 1350, as adopted pursuant to § 906 of the Sarbanes-Oxley Act of 2002, that:
(1) The Report fully complies with the requirements of section 13(a) or 15(d) of the Securities Exchange Act of 1934; and
(2) The information contained in the Report fairly presents, in all material respects, the financial condition and results of operations of the Company.
/s/ KARL G. GLASSMAN | ||
| Karl G. Glassman | ||
| Chairman and Chief Executive Officer | ||
February 24, 2021
Exhibit 32.2
CERTIFICATION PURSUANT TO
18 U.S.C. SECTION 1350
AS ADOPTED PURSUANT TO
SECTION 906 OF THE SARBANES-OXLEY ACT OF 2002
In connection with the Annual Report of Leggett & Platt, Incorporated (the “Company”) on Form 10-K for the period ended December 31, 2020, as filed with the Securities and Exchange Commission on the date hereof (the “Report”), I, Jeffrey L. Tate, certify, pursuant to 18 U.S.C. § 1350, as adopted pursuant to § 906 of the Sarbanes-Oxley Act of 2002, that:
(1) The Report fully complies with the requirements of section 13(a) or 15(d) of the Securities Exchange Act of 1934; and
(2) The information contained in the Report fairly presents, in all material respects, the financial condition and results of operations of the Company.
/s/ JEFFREY L. TATE | ||
| Jeffrey L. Tate | ||
| Executive Vice President and Chief Financial Officer | ||
February 24, 2021