00000584922022FYfalsehttp://fasb.org/us-gaap/2022#AccountingStandardsUpdate201613Memberhttp://fasb.org/us-gaap/2022#OtherAssetsNoncurrenthttp://fasb.org/us-gaap/2022#OtherAssetsNoncurrenthttp://www.leggett.com/20221231#LongTermDebtAndFinanceLeaseObligationsCurrenthttp://www.leggett.com/20221231#LongTermDebtAndFinanceLeaseObligationsCurrenthttp://fasb.org/us-gaap/2022#LongTermDebtAndCapitalLeaseObligationshttp://fasb.org/us-gaap/2022#LongTermDebtAndCapitalLeaseObligations6633http://www.leggett.com/20221231#OtherIncomeExpenseNethttp://fasb.org/us-gaap/2022#AssetsCurrent http://fasb.org/us-gaap/2022#OtherAssetsNoncurrenthttp://fasb.org/us-gaap/2022#AssetsCurrent http://fasb.org/us-gaap/2022#OtherAssetsNoncurrenthttp://fasb.org/us-gaap/2022#LiabilitiesNoncurrent http://fasb.org/us-gaap/2022#OtherLiabilitiesCurrenthttp://fasb.org/us-gaap/2022#LiabilitiesNoncurrent http://fasb.org/us-gaap/2022#OtherLiabilitiesCurrenthttp://fasb.org/us-gaap/2022#AssetsCurrenthttp://fasb.org/us-gaap/2022#AssetsCurrenthttp://fasb.org/us-gaap/2022#CostOfGoodsAndServicesSold http://fasb.org/us-gaap/2022#InterestExpense http://fasb.org/us-gaap/2022#RevenueFromContractWithCustomerExcludingAssessedTax http://www.leggett.com/20221231#OtherIncomeExpenseNet00000584922022-01-012022-12-3100000584922022-06-30iso4217:USD00000584922023-02-13xbrli:shares00000584922021-01-012021-12-3100000584922020-01-012020-12-31iso4217:USDxbrli:shares00000584922022-12-3100000584922021-12-3100000584922020-12-3100000584922019-12-310000058492us-gaap:CommonStockMember2019-12-310000058492us-gaap:AdditionalPaidInCapitalMember2019-12-310000058492us-gaap:RetainedEarningsMember2019-12-310000058492us-gaap:AccumulatedOtherComprehensiveIncomeMember2019-12-310000058492us-gaap:TreasuryStockCommonMember2019-12-310000058492us-gaap:NoncontrollingInterestMember2019-12-3100000584922019-01-012019-12-310000058492us-gaap:RetainedEarningsMembersrt:CumulativeEffectPeriodOfAdoptionAdjustmentMember2019-12-310000058492srt:CumulativeEffectPeriodOfAdoptionAdjustmentMember2019-12-310000058492us-gaap:CommonStockMembersrt:CumulativeEffectPeriodOfAdoptionAdjustedBalanceMember2019-12-310000058492us-gaap:AdditionalPaidInCapitalMembersrt:CumulativeEffectPeriodOfAdoptionAdjustedBalanceMember2019-12-310000058492us-gaap:RetainedEarningsMembersrt:CumulativeEffectPeriodOfAdoptionAdjustedBalanceMember2019-12-310000058492us-gaap:AccumulatedOtherComprehensiveIncomeMembersrt:CumulativeEffectPeriodOfAdoptionAdjustedBalanceMember2019-12-310000058492us-gaap:TreasuryStockCommonMembersrt:CumulativeEffectPeriodOfAdoptionAdjustedBalanceMember2019-12-310000058492us-gaap:NoncontrollingInterestMembersrt:CumulativeEffectPeriodOfAdoptionAdjustedBalanceMember2019-12-310000058492srt:CumulativeEffectPeriodOfAdoptionAdjustedBalanceMember2019-12-310000058492us-gaap:RetainedEarningsMember2020-01-012020-12-310000058492us-gaap:NoncontrollingInterestMember2020-01-012020-12-310000058492us-gaap:AdditionalPaidInCapitalMember2020-01-012020-12-310000058492us-gaap:TreasuryStockCommonMember2020-01-012020-12-310000058492us-gaap:AccumulatedOtherComprehensiveIncomeMember2020-01-012020-12-310000058492us-gaap:CommonStockMember2020-12-310000058492us-gaap:AdditionalPaidInCapitalMember2020-12-310000058492us-gaap:RetainedEarningsMember2020-12-310000058492us-gaap:AccumulatedOtherComprehensiveIncomeMember2020-12-310000058492us-gaap:TreasuryStockCommonMember2020-12-310000058492us-gaap:NoncontrollingInterestMember2020-12-310000058492us-gaap:RetainedEarningsMember2021-01-012021-12-310000058492us-gaap:NoncontrollingInterestMember2021-01-012021-12-310000058492us-gaap:AdditionalPaidInCapitalMember2021-01-012021-12-310000058492us-gaap:TreasuryStockCommonMember2021-01-012021-12-310000058492us-gaap:AccumulatedOtherComprehensiveIncomeMember2021-01-012021-12-310000058492us-gaap:CommonStockMember2021-12-310000058492us-gaap:AdditionalPaidInCapitalMember2021-12-310000058492us-gaap:RetainedEarningsMember2021-12-310000058492us-gaap:AccumulatedOtherComprehensiveIncomeMember2021-12-310000058492us-gaap:TreasuryStockCommonMember2021-12-310000058492us-gaap:NoncontrollingInterestMember2021-12-310000058492us-gaap:RetainedEarningsMember2022-01-012022-12-310000058492us-gaap:NoncontrollingInterestMember2022-01-012022-12-310000058492us-gaap:AdditionalPaidInCapitalMember2022-01-012022-12-310000058492us-gaap:TreasuryStockCommonMember2022-01-012022-12-310000058492us-gaap:AccumulatedOtherComprehensiveIncomeMember2022-01-012022-12-310000058492us-gaap:CommonStockMember2022-12-310000058492us-gaap:AdditionalPaidInCapitalMember2022-12-310000058492us-gaap:RetainedEarningsMember2022-12-310000058492us-gaap:AccumulatedOtherComprehensiveIncomeMember2022-12-310000058492us-gaap:TreasuryStockCommonMember2022-12-310000058492us-gaap:NoncontrollingInterestMember2022-12-31xbrli:pure0000058492us-gaap:AccountingStandardsUpdate201613Member2020-01-010000058492us-gaap:MachineryAndEquipmentMembersrt:MinimumMember2022-01-012022-12-310000058492us-gaap:MachineryAndEquipmentMembersrt:MaximumMember2022-01-012022-12-310000058492us-gaap:MachineryAndEquipmentMember2022-01-012022-12-310000058492us-gaap:BuildingMembersrt:MinimumMember2022-01-012022-12-310000058492srt:MaximumMemberus-gaap:BuildingMember2022-01-012022-12-310000058492us-gaap:BuildingMember2022-01-012022-12-310000058492us-gaap:OtherCapitalizedPropertyPlantAndEquipmentMembersrt:MinimumMember2022-01-012022-12-310000058492srt:MaximumMemberus-gaap:OtherCapitalizedPropertyPlantAndEquipmentMember2022-01-012022-12-310000058492us-gaap:OtherCapitalizedPropertyPlantAndEquipmentMember2022-01-012022-12-31leg:reporting_unit0000058492us-gaap:OtherIntangibleAssetsMembersrt:MinimumMember2022-01-012022-12-310000058492srt:MaximumMemberus-gaap:OtherIntangibleAssetsMember2022-01-012022-12-310000058492us-gaap:OtherIntangibleAssetsMember2022-01-012022-12-310000058492leg:BeddingProductsMemberleg:BeddingGroupMember2022-01-012022-12-310000058492leg:BeddingProductsMemberleg:BeddingGroupMember2021-01-012021-12-310000058492leg:BeddingProductsMemberleg:BeddingGroupMember2020-01-012020-12-310000058492leg:BeddingProductsMember2022-01-012022-12-310000058492leg:BeddingProductsMember2021-01-012021-12-310000058492leg:BeddingProductsMember2020-01-012020-12-310000058492leg:AutomotiveGroupMemberleg:SpecializedProductsMember2022-01-012022-12-310000058492leg:AutomotiveGroupMemberleg:SpecializedProductsMember2021-01-012021-12-310000058492leg:AutomotiveGroupMemberleg:SpecializedProductsMember2020-01-012020-12-310000058492leg:AerospaceProductsGroupMemberleg:SpecializedProductsMember2022-01-012022-12-310000058492leg:AerospaceProductsGroupMemberleg:SpecializedProductsMember2021-01-012021-12-310000058492leg:AerospaceProductsGroupMemberleg:SpecializedProductsMember2020-01-012020-12-310000058492leg:HydraulicCylindersMemberleg:SpecializedProductsMember2022-01-012022-12-310000058492leg:HydraulicCylindersMemberleg:SpecializedProductsMember2021-01-012021-12-310000058492leg:HydraulicCylindersMemberleg:SpecializedProductsMember2020-01-012020-12-310000058492leg:SpecializedProductsMember2022-01-012022-12-310000058492leg:SpecializedProductsMember2021-01-012021-12-310000058492leg:SpecializedProductsMember2020-01-012020-12-310000058492leg:FurnitureFlooringAndTextileProductsMemberleg:HomeFurnitureGroupMember2022-01-012022-12-310000058492leg:FurnitureFlooringAndTextileProductsMemberleg:HomeFurnitureGroupMember2021-01-012021-12-310000058492leg:FurnitureFlooringAndTextileProductsMemberleg:HomeFurnitureGroupMember2020-01-012020-12-310000058492leg:FurnitureFlooringAndTextileProductsMemberleg:WorkFurnitureGroupMember2022-01-012022-12-310000058492leg:FurnitureFlooringAndTextileProductsMemberleg:WorkFurnitureGroupMember2021-01-012021-12-310000058492leg:FurnitureFlooringAndTextileProductsMemberleg:WorkFurnitureGroupMember2020-01-012020-12-310000058492leg:FurnitureFlooringAndTextileProductsMemberleg:FlooringAndTextileProductsGroupMember2022-01-012022-12-310000058492leg:FurnitureFlooringAndTextileProductsMemberleg:FlooringAndTextileProductsGroupMember2021-01-012021-12-310000058492leg:FurnitureFlooringAndTextileProductsMemberleg:FlooringAndTextileProductsGroupMember2020-01-012020-12-310000058492leg:FurnitureFlooringAndTextileProductsMember2022-01-012022-12-310000058492leg:FurnitureFlooringAndTextileProductsMember2021-01-012021-12-310000058492leg:FurnitureFlooringAndTextileProductsMember2020-01-012020-12-310000058492leg:UnallocatedMember2020-01-012020-12-310000058492leg:HydraulicCylindersMember2020-04-012020-06-300000058492srt:MaximumMemberleg:LessThan50PercentMember2022-01-012022-12-310000058492leg:LessThan50PercentMember2022-12-310000058492leg:LessThan50PercentMembersrt:MinimumMember2022-01-012022-12-310000058492leg:LessThan50PercentMember2022-01-012022-12-310000058492leg:A50to100PercentMembersrt:MinimumMember2022-01-012022-12-310000058492srt:MaximumMemberleg:A50to100PercentMember2022-01-012022-12-310000058492leg:A50to100PercentMember2022-12-310000058492leg:A50to100PercentMember2022-01-012022-12-310000058492leg:A101to300PercentMembersrt:MinimumMember2022-01-012022-12-310000058492srt:MaximumMemberleg:A101to300PercentMember2022-01-012022-12-310000058492leg:A101to300PercentMember2022-12-310000058492leg:MoreThan300PercentMembersrt:MinimumMember2022-01-012022-12-310000058492leg:MoreThan300PercentMember2022-12-310000058492leg:MoreThan300PercentMember2022-01-012022-12-310000058492srt:MinimumMember2022-01-012022-12-310000058492srt:MaximumMember2022-01-012022-12-310000058492srt:MaximumMemberleg:LessThan50PercentMember2021-01-012021-12-310000058492leg:LessThan50PercentMember2021-12-310000058492leg:LessThan50PercentMember2021-01-012021-12-310000058492leg:A50to100PercentMembersrt:MinimumMember2021-01-012021-12-310000058492srt:MaximumMemberleg:A50to100PercentMember2021-01-012021-12-310000058492leg:A50to100PercentMember2021-12-310000058492leg:A50to100PercentMember2021-01-012021-12-310000058492leg:A101to300PercentMembersrt:MinimumMember2021-01-012021-12-310000058492srt:MaximumMemberleg:A101to300PercentMember2021-01-012021-12-310000058492leg:A101to300PercentMember2021-12-310000058492leg:MoreThan300PercentMembersrt:MinimumMember2021-01-012021-12-310000058492leg:MoreThan300PercentMember2021-12-310000058492srt:MaximumMemberleg:MoreThan300PercentMember2021-01-012021-12-310000058492leg:MoreThan300PercentMember2021-01-012021-12-310000058492srt:MinimumMember2021-01-012021-12-310000058492srt:MaximumMember2021-01-012021-12-310000058492leg:AerospaceAndHydraulicCylindersMember2022-01-012022-12-310000058492leg:AerospaceProductsMember2022-06-300000058492leg:AerospaceProductsMember2021-06-300000058492leg:AerospaceProductsMember2022-12-310000058492leg:AerospaceProductsMember2021-12-310000058492leg:HydraulicCylindersMember2022-06-300000058492leg:HydraulicCylindersMember2021-06-300000058492leg:HydraulicCylindersMember2022-12-310000058492leg:WorkFurnitureAndBeddingMember2022-01-012022-12-310000058492leg:WorkFurnitureMember2022-06-300000058492leg:WorkFurnitureMember2021-06-300000058492leg:WorkFurnitureMember2022-12-310000058492leg:WorkFurnitureMember2021-12-310000058492leg:BeddingMember2022-06-300000058492leg:BeddingMember2021-06-300000058492leg:BeddingMember2022-12-310000058492leg:BeddingMember2021-12-310000058492leg:BeddingProductsMember2020-12-310000058492leg:SpecializedProductsMember2020-12-310000058492leg:FurnitureFlooringAndTextileProductsMember2020-12-310000058492leg:BeddingProductsMember2021-12-310000058492leg:SpecializedProductsMember2021-12-310000058492leg:FurnitureFlooringAndTextileProductsMember2021-12-310000058492leg:BeddingProductsMember2022-12-310000058492leg:SpecializedProductsMember2022-12-310000058492leg:FurnitureFlooringAndTextileProductsMember2022-12-310000058492leg:CustomerRelatedMember2022-12-310000058492leg:CustomerRelatedMember2022-01-012022-12-310000058492leg:TechnologyMember2022-12-310000058492leg:TechnologyMember2022-01-012022-12-310000058492leg:PatentsAndTrademarksMember2022-12-310000058492leg:PatentsAndTrademarksMember2022-01-012022-12-310000058492us-gaap:NoncompeteAgreementsMember2022-12-310000058492us-gaap:NoncompeteAgreementsMember2022-01-012022-12-310000058492leg:CustomerRelatedMember2021-12-310000058492leg:CustomerRelatedMember2021-01-012021-12-310000058492leg:TechnologyMember2021-12-310000058492leg:TechnologyMember2021-01-012021-12-310000058492leg:PatentsAndTrademarksMember2021-12-310000058492leg:PatentsAndTrademarksMember2021-01-012021-12-310000058492us-gaap:NoncompeteAgreementsMember2021-12-310000058492us-gaap:NoncompeteAgreementsMember2021-01-012021-12-310000058492leg:COVID19Member2020-01-012020-12-310000058492leg:BeddingProductsMemberus-gaap:DisposalGroupDisposedOfBySaleNotDiscontinuedOperationsMember2022-12-310000058492leg:BeddingProductsMemberus-gaap:DisposalGroupDisposedOfBySaleNotDiscontinuedOperationsMember2021-12-310000058492leg:BeddingProductsMemberus-gaap:DisposalGroupDisposedOfBySaleNotDiscontinuedOperationsMember2020-12-31leg:segment0000058492us-gaap:OperatingSegmentsMemberleg:BeddingProductsMember2022-01-012022-12-310000058492us-gaap:IntersegmentEliminationMemberleg:BeddingProductsMember2022-01-012022-12-310000058492us-gaap:OperatingSegmentsMemberleg:SpecializedProductsMember2022-01-012022-12-310000058492us-gaap:IntersegmentEliminationMemberleg:SpecializedProductsMember2022-01-012022-12-310000058492us-gaap:OperatingSegmentsMemberleg:FurnitureFlooringAndTextileProductsMember2022-01-012022-12-310000058492leg:FurnitureFlooringAndTextileProductsMemberus-gaap:IntersegmentEliminationMember2022-01-012022-12-310000058492us-gaap:IntersegmentEliminationMember2022-01-012022-12-310000058492us-gaap:OperatingSegmentsMember2022-01-012022-12-310000058492us-gaap:OperatingSegmentsMemberleg:BeddingProductsMember2021-01-012021-12-310000058492us-gaap:IntersegmentEliminationMemberleg:BeddingProductsMember2021-01-012021-12-310000058492us-gaap:OperatingSegmentsMemberleg:SpecializedProductsMember2021-01-012021-12-310000058492us-gaap:IntersegmentEliminationMemberleg:SpecializedProductsMember2021-01-012021-12-310000058492us-gaap:OperatingSegmentsMemberleg:FurnitureFlooringAndTextileProductsMember2021-01-012021-12-310000058492leg:FurnitureFlooringAndTextileProductsMemberus-gaap:IntersegmentEliminationMember2021-01-012021-12-310000058492us-gaap:IntersegmentEliminationMember2021-01-012021-12-310000058492us-gaap:OperatingSegmentsMember2021-01-012021-12-310000058492us-gaap:OperatingSegmentsMemberleg:BeddingProductsMember2020-01-012020-12-310000058492us-gaap:IntersegmentEliminationMemberleg:BeddingProductsMember2020-01-012020-12-310000058492us-gaap:OperatingSegmentsMemberleg:SpecializedProductsMember2020-01-012020-12-310000058492us-gaap:IntersegmentEliminationMemberleg:SpecializedProductsMember2020-01-012020-12-310000058492us-gaap:OperatingSegmentsMemberleg:FurnitureFlooringAndTextileProductsMember2020-01-012020-12-310000058492leg:FurnitureFlooringAndTextileProductsMemberus-gaap:IntersegmentEliminationMember2020-01-012020-12-310000058492us-gaap:IntersegmentEliminationMember2020-01-012020-12-310000058492us-gaap:OperatingSegmentsMember2020-01-012020-12-310000058492leg:HydraulicCylindersMember2020-01-012020-12-310000058492us-gaap:OperatingSegmentsMemberleg:BeddingProductsMember2022-12-310000058492us-gaap:OperatingSegmentsMemberleg:SpecializedProductsMember2022-12-310000058492us-gaap:OperatingSegmentsMemberleg:FurnitureFlooringAndTextileProductsMember2022-12-310000058492us-gaap:CorporateNonSegmentMember2022-12-310000058492us-gaap:CorporateNonSegmentMember2022-01-012022-12-310000058492leg:EliminationsAndReconcilingItemsMember2022-12-310000058492leg:EliminationsAndReconcilingItemsMember2022-01-012022-12-310000058492us-gaap:MaterialReconcilingItemsMember2022-12-310000058492us-gaap:MaterialReconcilingItemsMember2022-01-012022-12-310000058492us-gaap:OperatingSegmentsMemberleg:BeddingProductsMember2021-12-310000058492us-gaap:OperatingSegmentsMemberleg:SpecializedProductsMember2021-12-310000058492us-gaap:OperatingSegmentsMemberleg:FurnitureFlooringAndTextileProductsMember2021-12-310000058492us-gaap:CorporateNonSegmentMember2021-12-310000058492us-gaap:CorporateNonSegmentMember2021-01-012021-12-310000058492leg:EliminationsAndReconcilingItemsMember2021-12-310000058492leg:EliminationsAndReconcilingItemsMember2021-01-012021-12-310000058492us-gaap:MaterialReconcilingItemsMember2021-12-310000058492us-gaap:MaterialReconcilingItemsMember2021-01-012021-12-310000058492us-gaap:OperatingSegmentsMemberleg:BeddingProductsMember2020-12-310000058492us-gaap:OperatingSegmentsMemberleg:SpecializedProductsMember2020-12-310000058492us-gaap:OperatingSegmentsMemberleg:FurnitureFlooringAndTextileProductsMember2020-12-310000058492us-gaap:CorporateNonSegmentMember2020-12-310000058492us-gaap:CorporateNonSegmentMember2020-01-012020-12-310000058492leg:EliminationsAndReconcilingItemsMember2020-12-310000058492leg:EliminationsAndReconcilingItemsMember2020-01-012020-12-310000058492us-gaap:MaterialReconcilingItemsMember2020-12-310000058492us-gaap:MaterialReconcilingItemsMember2020-01-012020-12-310000058492srt:EuropeMember2022-01-012022-12-310000058492srt:EuropeMember2021-01-012021-12-310000058492srt:EuropeMember2020-01-012020-12-310000058492country:CN2022-01-012022-12-310000058492country:CN2021-01-012021-12-310000058492country:CN2020-01-012020-12-310000058492country:CA2022-01-012022-12-310000058492country:CA2021-01-012021-12-310000058492country:CA2020-01-012020-12-310000058492country:MX2022-01-012022-12-310000058492country:MX2021-01-012021-12-310000058492country:MX2020-01-012020-12-310000058492leg:OtherCountryMember2022-01-012022-12-310000058492leg:OtherCountryMember2021-01-012021-12-310000058492leg:OtherCountryMember2020-01-012020-12-310000058492us-gaap:NonUsMember2022-01-012022-12-310000058492us-gaap:NonUsMember2021-01-012021-12-310000058492us-gaap:NonUsMember2020-01-012020-12-310000058492country:US2022-01-012022-12-310000058492country:US2021-01-012021-12-310000058492country:US2020-01-012020-12-310000058492srt:EuropeMember2022-12-310000058492srt:EuropeMember2021-12-310000058492srt:EuropeMember2020-12-310000058492country:CN2022-12-310000058492country:CN2021-12-310000058492country:CN2020-12-310000058492country:CA2022-12-310000058492country:CA2021-12-310000058492country:CA2020-12-310000058492country:MX2022-12-310000058492country:MX2021-12-310000058492country:MX2020-12-310000058492leg:OtherCountryMember2022-12-310000058492leg:OtherCountryMember2021-12-310000058492leg:OtherCountryMember2020-12-310000058492us-gaap:NonUsMember2022-12-310000058492us-gaap:NonUsMember2021-12-310000058492us-gaap:NonUsMember2020-12-310000058492country:US2022-12-310000058492country:US2021-12-310000058492country:US2020-12-310000058492us-gaap:NotesReceivableMemberleg:BeddingProductsMember2022-12-310000058492us-gaap:TradeAccountsReceivableMemberleg:BeddingProductsMember2022-12-310000058492us-gaap:NotesReceivableMemberleg:BeddingProductsMember2021-12-310000058492us-gaap:TradeAccountsReceivableMemberleg:BeddingProductsMember2021-12-310000058492leg:TotalTradeReceivablesMember2020-12-310000058492leg:TotalTradeReceivablesMember2021-01-012021-12-310000058492leg:TotalTradeReceivablesMember2021-12-310000058492leg:TotalTradeReceivablesMember2022-01-012022-12-310000058492leg:TotalTradeReceivablesMember2022-12-310000058492leg:OthernotesReceivableMember2020-12-310000058492leg:OthernotesReceivableMember2021-01-012021-12-310000058492leg:OthernotesReceivableMember2021-12-310000058492leg:OthernotesReceivableMember2022-01-012022-12-310000058492leg:OthernotesReceivableMember2022-12-310000058492leg:COVID19Memberus-gaap:AccruedLiabilitiesMember2022-12-310000058492leg:COVID19Memberus-gaap:AccruedLiabilitiesMember2021-12-310000058492us-gaap:OtherNoncurrentLiabilitiesMemberleg:COVID19Member2021-12-310000058492us-gaap:LineOfCreditMemberus-gaap:RevolvingCreditFacilityMember2022-12-310000058492us-gaap:LineOfCreditMember2022-12-310000058492us-gaap:LineOfCreditMemberleg:DebtCovenant2Member2022-12-310000058492us-gaap:MediumTermNotesMemberleg:SeniorNotesDue2051Member2021-11-300000058492us-gaap:MediumTermNotesMemberleg:SeniorNotesDue2022Member2021-11-012021-11-300000058492us-gaap:MediumTermNotesMemberleg:SeniorNotesDue2022Member2021-11-300000058492leg:SeniorNotesDue2022Memberus-gaap:SeniorNotesMember2022-12-310000058492leg:SeniorNotesDue2022Memberus-gaap:SeniorNotesMember2021-12-310000058492us-gaap:SeniorNotesMemberleg:SeniorNotesDue2024Member2022-12-310000058492us-gaap:SeniorNotesMemberleg:SeniorNotesDue2024Member2021-12-310000058492leg:SeniorNotesDue2027Memberus-gaap:SeniorNotesMember2022-12-310000058492leg:SeniorNotesDue2027Memberus-gaap:SeniorNotesMember2021-12-310000058492us-gaap:SeniorNotesMemberleg:SeniorNotesDue2029Member2022-12-310000058492us-gaap:SeniorNotesMemberleg:SeniorNotesDue2029Member2021-12-310000058492leg:SeniorNotesDue2051Memberus-gaap:SeniorNotesMember2022-12-310000058492leg:SeniorNotesDue2051Memberus-gaap:SeniorNotesMember2021-12-310000058492leg:IndustrialDevelopmentBondsPrincipallyVariableInterestRatesMember2022-12-310000058492leg:IndustrialDevelopmentBondsPrincipallyVariableInterestRatesMember2021-12-310000058492us-gaap:CommercialPaperMember2022-12-310000058492us-gaap:CommercialPaperMember2021-12-310000058492us-gaap:SecuredDebtMember2022-12-310000058492us-gaap:SecuredDebtMember2021-12-310000058492us-gaap:SeniorNotesMember2022-01-012022-12-310000058492us-gaap:SeniorNotesMember2022-12-310000058492leg:NetCommercialPaperActivityMember2022-12-310000058492leg:NetCommercialPaperActivityMember2021-12-310000058492us-gaap:RevolvingCreditFacilityMember2021-12-31leg:lender0000058492us-gaap:LetterOfCreditMember2021-12-310000058492us-gaap:LetterOfCreditMember2021-12-310000058492us-gaap:RevolvingCreditFacilityMember2022-12-31leg:type_of_borrowingleg:business_day0000058492leg:FlexibleStockPlanMember2012-05-090000058492leg:FlexibleStockPlanMember2012-05-100000058492us-gaap:EmployeeStockOptionMemberleg:FlexibleStockPlanMember2022-12-310000058492leg:FlexibleStockPlanMemberleg:StockUnitsVestedMember2022-12-310000058492leg:StockUnitsUnvestedMemberleg:FlexibleStockPlanMember2022-12-310000058492leg:FlexibleStockPlanMemberleg:AwardsAvailableForGrantMember2022-12-310000058492leg:FlexibleStockPlanMember2022-12-310000058492leg:StockBasedRetirementPlansContributionsMemberleg:SettledWithStockMember2022-01-012022-12-310000058492leg:StockBasedRetirementPlansContributionsMemberleg:SettledWithCashMember2022-01-012022-12-310000058492leg:StockBasedRetirementPlansContributionsMemberleg:SettledWithStockMember2021-01-012021-12-310000058492leg:StockBasedRetirementPlansContributionsMemberleg:SettledWithCashMember2021-01-012021-12-310000058492leg:StockBasedRetirementPlansContributionsMemberleg:SettledWithStockMember2020-01-012020-12-310000058492leg:StockBasedRetirementPlansContributionsMemberleg:SettledWithCashMember2020-01-012020-12-310000058492leg:DeferredStockCompensationProgramMemberleg:SettledWithStockMember2022-01-012022-12-310000058492leg:DeferredStockCompensationProgramMemberleg:SettledWithCashMember2022-01-012022-12-310000058492leg:DeferredStockCompensationProgramMemberleg:SettledWithStockMember2021-01-012021-12-310000058492leg:DeferredStockCompensationProgramMemberleg:SettledWithCashMember2021-01-012021-12-310000058492leg:DeferredStockCompensationProgramMemberleg:SettledWithStockMember2020-01-012020-12-310000058492leg:DeferredStockCompensationProgramMemberleg:SettledWithCashMember2020-01-012020-12-310000058492leg:SettledWithStockMemberleg:StockBasedRetirementPlansMember2022-01-012022-12-310000058492leg:SettledWithCashMemberleg:StockBasedRetirementPlansMember2022-01-012022-12-310000058492leg:SettledWithStockMemberleg:StockBasedRetirementPlansMember2021-01-012021-12-310000058492leg:SettledWithCashMemberleg:StockBasedRetirementPlansMember2021-01-012021-12-310000058492leg:SettledWithStockMemberleg:StockBasedRetirementPlansMember2020-01-012020-12-310000058492leg:SettledWithCashMemberleg:StockBasedRetirementPlansMember2020-01-012020-12-310000058492leg:DiscountStockPlanMemberleg:SettledWithStockMember2022-01-012022-12-310000058492leg:DiscountStockPlanMemberleg:SettledWithCashMember2022-01-012022-12-310000058492leg:DiscountStockPlanMemberleg:SettledWithStockMember2021-01-012021-12-310000058492leg:DiscountStockPlanMemberleg:SettledWithCashMember2021-01-012021-12-310000058492leg:DiscountStockPlanMemberleg:SettledWithStockMember2020-01-012020-12-310000058492leg:DiscountStockPlanMemberleg:SettledWithCashMember2020-01-012020-12-310000058492leg:SettledWithStockMemberleg:PerformanceStockUnitAwardsTSRBasedMember2022-01-012022-12-310000058492leg:SettledWithCashMemberleg:PerformanceStockUnitAwardsTSRBasedMember2022-01-012022-12-310000058492leg:SettledWithStockMemberleg:PerformanceStockUnitAwardsTSRBasedMember2021-01-012021-12-310000058492leg:SettledWithCashMemberleg:PerformanceStockUnitAwardsTSRBasedMember2021-01-012021-12-310000058492leg:SettledWithStockMemberleg:PerformanceStockUnitAwardsTSRBasedMember2020-01-012020-12-310000058492leg:SettledWithCashMemberleg:PerformanceStockUnitAwardsTSRBasedMember2020-01-012020-12-310000058492leg:SettledWithStockMemberleg:PerformanceStockUnitAwardsEBITCAGRBasedMember2022-01-012022-12-310000058492leg:SettledWithCashMemberleg:PerformanceStockUnitAwardsEBITCAGRBasedMember2022-01-012022-12-310000058492leg:SettledWithStockMemberleg:PerformanceStockUnitAwardsEBITCAGRBasedMember2021-01-012021-12-310000058492leg:SettledWithCashMemberleg:PerformanceStockUnitAwardsEBITCAGRBasedMember2021-01-012021-12-310000058492leg:SettledWithStockMemberleg:PerformanceStockUnitAwardsEBITCAGRBasedMember2020-01-012020-12-310000058492leg:SettledWithCashMemberleg:PerformanceStockUnitAwardsEBITCAGRBasedMember2020-01-012020-12-310000058492leg:RestrictedStockUnitAwardsMemberleg:SettledWithStockMember2022-01-012022-12-310000058492leg:RestrictedStockUnitAwardsMemberleg:SettledWithCashMember2022-01-012022-12-310000058492leg:RestrictedStockUnitAwardsMemberleg:SettledWithStockMember2021-01-012021-12-310000058492leg:RestrictedStockUnitAwardsMemberleg:SettledWithCashMember2021-01-012021-12-310000058492leg:RestrictedStockUnitAwardsMemberleg:SettledWithStockMember2020-01-012020-12-310000058492leg:RestrictedStockUnitAwardsMemberleg:SettledWithCashMember2020-01-012020-12-310000058492leg:OtherPrimarilyNonEmployeeDirectorsRestrictedStockMemberleg:SettledWithStockMember2022-01-012022-12-310000058492leg:OtherPrimarilyNonEmployeeDirectorsRestrictedStockMemberleg:SettledWithCashMember2022-01-012022-12-310000058492leg:OtherPrimarilyNonEmployeeDirectorsRestrictedStockMemberleg:SettledWithStockMember2021-01-012021-12-310000058492leg:OtherPrimarilyNonEmployeeDirectorsRestrictedStockMemberleg:SettledWithCashMember2021-01-012021-12-310000058492leg:OtherPrimarilyNonEmployeeDirectorsRestrictedStockMemberleg:SettledWithStockMember2020-01-012020-12-310000058492leg:OtherPrimarilyNonEmployeeDirectorsRestrictedStockMemberleg:SettledWithCashMember2020-01-012020-12-310000058492leg:SettledWithStockMember2022-01-012022-12-310000058492leg:SettledWithCashMember2022-01-012022-12-310000058492leg:SettledWithStockMember2021-01-012021-12-310000058492leg:SettledWithCashMember2021-01-012021-12-310000058492leg:SettledWithStockMember2020-01-012020-12-310000058492leg:SettledWithCashMember2020-01-012020-12-310000058492us-gaap:AccountingStandardsUpdate201613Memberleg:SettledWithStockMember2022-01-012022-12-310000058492us-gaap:AccountingStandardsUpdate201613Memberleg:SettledWithStockMember2021-01-012021-12-310000058492us-gaap:AccountingStandardsUpdate201613Memberleg:SettledWithStockMember2020-01-012020-12-310000058492leg:ExecutiveStockUnitProgramMember2022-12-310000058492leg:ExecutiveStockUnitProgramMember2021-12-310000058492leg:PerformanceStockUnitAwardsTSRMember2022-12-310000058492leg:PerformanceStockUnitAwardsTSRMember2021-12-310000058492leg:PerformanceStockUnitAwardsEBITMember2022-12-310000058492leg:PerformanceStockUnitAwardsEBITMember2021-12-310000058492leg:StockBasedRetirementPlansMember2022-01-012022-12-310000058492srt:MaximumMemberleg:StockBasedRetirementPlansMember2022-01-012022-12-310000058492leg:ExecutiveStockUnitProgramMember2022-01-012022-12-310000058492leg:DeferredStockCompensationProgramMember2022-01-012022-12-310000058492leg:OptionsMember2022-12-310000058492leg:UnitsMember2022-12-310000058492leg:CashCompensationMember2022-12-310000058492leg:DiscountStockPlanMember2022-01-012022-12-310000058492leg:DiscountStockPlanMember2022-12-310000058492leg:PerformanceStockUnitAwardsTSRMember2022-01-012022-12-31leg:company0000058492leg:PerformanceStockUnitAwardsTSRMembersrt:MinimumMember2022-01-012022-12-310000058492leg:PerformanceStockUnitAwardsTSRMembersrt:MaximumMember2022-01-012022-12-310000058492leg:PerformanceStockUnitAwardsEBITCAGRBasedMember2022-01-012022-12-310000058492leg:PerformanceStockUnitAwardsEBITCAGRBasedMembersrt:MinimumMember2022-01-012022-12-310000058492srt:MaximumMemberleg:PerformanceStockUnitAwardsEBITCAGRBasedMember2022-01-012022-12-310000058492leg:PerformanceStockUnitMemberleg:RelativeTotalShareholderReturnMember2022-01-012022-12-310000058492leg:PerformanceStockUnitMemberleg:RelativeTotalShareholderReturnMember2021-01-012021-12-310000058492leg:PerformanceStockUnitMemberleg:RelativeTotalShareholderReturnMember2020-01-012020-12-310000058492leg:PerformanceStockUnitMemberleg:EarningsBeforeInterestandTaxesAndCompoundAnnualGrowthRateMember2022-01-012022-12-310000058492leg:PerformanceStockUnitMemberleg:EarningsBeforeInterestandTaxesAndCompoundAnnualGrowthRateMember2021-01-012021-12-310000058492leg:PerformanceStockUnitMemberleg:EarningsBeforeInterestandTaxesAndCompoundAnnualGrowthRateMember2020-01-012020-12-310000058492leg:ThreeYearPerformanceCycleAwardYearTwoThousandEighteenMember2021-01-012021-03-310000058492leg:ThreeYearPerformanceCycleAwardYearTwoThousandNineteenMember2022-01-012022-03-310000058492srt:ScenarioForecastMemberleg:ThreeYearPerformanceCycleAwardYearTwoThousandTwentyMember2023-01-012023-03-310000058492leg:ThreeYearPerformanceCycleAwardYearTwoThousandEighteenPSUEBITCAGRMember2021-01-012021-03-310000058492leg:ThreeYearPerformanceCycleAwardYearTwoThousandNineteenPSUEBITCAGRMember2022-01-012022-03-310000058492srt:ScenarioForecastMemberleg:ThreeYearPerformanceCycleAwardYearTwoThousandTwentyPSUEBITCAGRMember2023-01-012023-03-310000058492us-gaap:PerformanceSharesMember2021-01-012021-12-310000058492us-gaap:RestrictedStockUnitsRSUMember2021-01-012021-12-310000058492us-gaap:RestrictedStockUnitsRSUMember2022-01-012022-12-310000058492us-gaap:RestrictedStockUnitsRSUMember2022-12-310000058492leg:DsuMember2021-12-310000058492leg:EsuMember2021-12-310000058492leg:PsuMember2021-12-310000058492us-gaap:RestrictedStockUnitsRSUMember2021-12-310000058492leg:DsuMember2022-01-012022-12-310000058492leg:EsuMember2022-01-012022-12-310000058492leg:PsuMember2022-01-012022-12-310000058492leg:DsuMember2022-12-310000058492leg:EsuMember2022-12-310000058492leg:PsuMember2022-12-31leg:pension_plan0000058492leg:NetLossBeforeTaxMember2021-12-310000058492leg:NetLossBeforeTaxMember2022-01-012022-12-310000058492leg:NetLossBeforeTaxMember2022-12-310000058492leg:DeferredIncomeTaxesMember2021-12-310000058492leg:DeferredIncomeTaxesMember2022-01-012022-12-310000058492leg:DeferredIncomeTaxesMember2022-12-310000058492leg:AccumulatedOtherComprehensiveIncomeNetOfTaxMember2021-12-310000058492leg:AccumulatedOtherComprehensiveIncomeNetOfTaxMember2022-01-012022-12-310000058492leg:AccumulatedOtherComprehensiveIncomeNetOfTaxMember2022-12-310000058492us-gaap:PensionPlansDefinedBenefitMember2022-01-012022-12-310000058492us-gaap:FixedIncomeFundsMemberus-gaap:FairValueInputsLevel1Member2022-12-310000058492us-gaap:FixedIncomeFundsMemberus-gaap:FairValueInputsLevel2Member2022-12-310000058492us-gaap:FairValueInputsLevel3Memberus-gaap:FixedIncomeFundsMember2022-12-310000058492us-gaap:FixedIncomeFundsMember2022-12-310000058492us-gaap:FixedIncomeFundsMemberus-gaap:FairValueInputsLevel1Member2021-12-310000058492us-gaap:FixedIncomeFundsMemberus-gaap:FairValueInputsLevel2Member2021-12-310000058492us-gaap:FairValueInputsLevel3Memberus-gaap:FixedIncomeFundsMember2021-12-310000058492us-gaap:FixedIncomeFundsMember2021-12-310000058492us-gaap:EquityFundsMemberus-gaap:FairValueInputsLevel1Member2022-12-310000058492us-gaap:EquityFundsMemberus-gaap:FairValueInputsLevel2Member2022-12-310000058492us-gaap:FairValueInputsLevel3Memberus-gaap:EquityFundsMember2022-12-310000058492us-gaap:EquityFundsMember2022-12-310000058492us-gaap:EquityFundsMemberus-gaap:FairValueInputsLevel1Member2021-12-310000058492us-gaap:EquityFundsMemberus-gaap:FairValueInputsLevel2Member2021-12-310000058492us-gaap:FairValueInputsLevel3Memberus-gaap:EquityFundsMember2021-12-310000058492us-gaap:EquityFundsMember2021-12-310000058492leg:StableValueFundMemberus-gaap:FairValueInputsLevel1Member2022-12-310000058492leg:StableValueFundMemberus-gaap:FairValueInputsLevel2Member2022-12-310000058492us-gaap:FairValueInputsLevel3Memberleg:StableValueFundMember2022-12-310000058492leg:StableValueFundMember2022-12-310000058492leg:StableValueFundMemberus-gaap:FairValueInputsLevel1Member2021-12-310000058492leg:StableValueFundMemberus-gaap:FairValueInputsLevel2Member2021-12-310000058492us-gaap:FairValueInputsLevel3Memberleg:StableValueFundMember2021-12-310000058492leg:StableValueFundMember2021-12-310000058492us-gaap:DefinedBenefitPlanCashAndCashEquivalentsMemberus-gaap:FairValueInputsLevel1Member2022-12-310000058492us-gaap:DefinedBenefitPlanCashAndCashEquivalentsMemberus-gaap:FairValueInputsLevel2Member2022-12-310000058492us-gaap:FairValueInputsLevel3Memberus-gaap:DefinedBenefitPlanCashAndCashEquivalentsMember2022-12-310000058492us-gaap:DefinedBenefitPlanCashAndCashEquivalentsMemberus-gaap:FairValueMeasuredAtNetAssetValuePerShareMember2022-12-310000058492us-gaap:DefinedBenefitPlanCashAndCashEquivalentsMember2022-12-310000058492us-gaap:DefinedBenefitPlanCashAndCashEquivalentsMemberus-gaap:FairValueInputsLevel1Member2021-12-310000058492us-gaap:DefinedBenefitPlanCashAndCashEquivalentsMemberus-gaap:FairValueInputsLevel2Member2021-12-310000058492us-gaap:FairValueInputsLevel3Memberus-gaap:DefinedBenefitPlanCashAndCashEquivalentsMember2021-12-310000058492us-gaap:DefinedBenefitPlanCashAndCashEquivalentsMemberus-gaap:FairValueMeasuredAtNetAssetValuePerShareMember2021-12-310000058492us-gaap:DefinedBenefitPlanCashAndCashEquivalentsMember2021-12-310000058492us-gaap:FairValueInputsLevel1Member2022-12-310000058492us-gaap:FairValueInputsLevel2Member2022-12-310000058492us-gaap:FairValueInputsLevel3Member2022-12-310000058492us-gaap:FairValueMeasuredAtNetAssetValuePerShareMember2022-12-310000058492us-gaap:FairValueInputsLevel1Member2021-12-310000058492us-gaap:FairValueInputsLevel2Member2021-12-310000058492us-gaap:FairValueInputsLevel3Member2021-12-310000058492us-gaap:FairValueMeasuredAtNetAssetValuePerShareMember2021-12-310000058492us-gaap:DefinedBenefitPlanEquitySecuritiesMember2022-12-310000058492us-gaap:DefinedBenefitPlanEquitySecuritiesMember2021-12-310000058492us-gaap:DefinedBenefitPlanDebtSecurityMember2022-12-310000058492us-gaap:DefinedBenefitPlanDebtSecurityMember2021-12-310000058492leg:StableValueFundMember2022-12-310000058492leg:StableValueFundMember2021-12-310000058492leg:OtherIncludingCashMember2022-12-310000058492leg:OtherIncludingCashMember2021-12-310000058492us-gaap:BondsMemberleg:FrozenPlansMemberus-gaap:OtherPostretirementBenefitPlansDefinedBenefitMember2022-12-310000058492leg:FrozenPlansMemberus-gaap:DefinedBenefitPlanEquitySecuritiesMemberus-gaap:OtherPostretirementBenefitPlansDefinedBenefitMember2022-12-310000058492us-gaap:DefinedBenefitPlanEquitySecuritiesMemberus-gaap:OtherPostretirementBenefitPlansDefinedBenefitMemberleg:ActivePlansMember2022-12-310000058492us-gaap:BondsMemberus-gaap:OtherPostretirementBenefitPlansDefinedBenefitMemberleg:ActivePlansMember2022-12-31leg:investment0000058492us-gaap:MutualFundMember2022-12-310000058492us-gaap:USTreasurySecuritiesMembersrt:MinimumMember2022-01-012022-12-310000058492srt:MaximumMemberus-gaap:USTreasurySecuritiesMember2022-01-012022-12-310000058492leg:HydraulicCylindersReportingUnitMember2020-01-012020-12-310000058492leg:TaxAuthorityKoreaMember2020-01-012020-12-310000058492us-gaap:PropertyPlantAndEquipmentMember2022-12-310000058492us-gaap:PropertyPlantAndEquipmentMember2021-12-310000058492us-gaap:InventoriesMember2022-12-310000058492us-gaap:InventoriesMember2021-12-310000058492us-gaap:AccruedLiabilitiesMember2022-12-310000058492us-gaap:AccruedLiabilitiesMember2021-12-310000058492leg:NetOperatingLossAndTaxCreditCarryforwardsMember2022-12-310000058492leg:NetOperatingLossAndTaxCreditCarryforwardsMember2021-12-310000058492us-gaap:PensionCostsMember2022-12-310000058492us-gaap:PensionCostsMember2021-12-310000058492leg:IntangibleAssetsMember2022-12-310000058492leg:IntangibleAssetsMember2021-12-310000058492us-gaap:DerivativeFinancialInstrumentsAssetsMember2022-12-310000058492us-gaap:DerivativeFinancialInstrumentsAssetsMember2021-12-310000058492leg:TaxonUndistributedEarningsMember2022-12-310000058492leg:TaxonUndistributedEarningsMember2021-12-310000058492leg:UncertainTaxPositionsMember2022-12-310000058492leg:UncertainTaxPositionsMember2021-12-310000058492leg:OtherDeferredTaxAssetsLiabilitiesMember2022-12-310000058492leg:OtherDeferredTaxAssetsLiabilitiesMember2021-12-310000058492leg:COVID19Member2022-01-012022-12-310000058492us-gaap:AccumulatedTranslationAdjustmentMember2019-12-310000058492us-gaap:AccumulatedGainLossNetCashFlowHedgeParentMember2019-12-310000058492us-gaap:AccumulatedDefinedBenefitPlansAdjustmentMember2019-12-310000058492us-gaap:AccumulatedTranslationAdjustmentMember2020-01-012020-12-310000058492us-gaap:AccumulatedGainLossNetCashFlowHedgeParentMember2020-01-012020-12-310000058492us-gaap:AccumulatedDefinedBenefitPlansAdjustmentMember2020-01-012020-12-310000058492us-gaap:AccumulatedTranslationAdjustmentMember2020-12-310000058492us-gaap:AccumulatedGainLossNetCashFlowHedgeParentMember2020-12-310000058492us-gaap:AccumulatedDefinedBenefitPlansAdjustmentMember2020-12-310000058492us-gaap:AccumulatedTranslationAdjustmentMember2021-01-012021-12-310000058492us-gaap:AccumulatedGainLossNetCashFlowHedgeParentMember2021-01-012021-12-310000058492us-gaap:AccumulatedDefinedBenefitPlansAdjustmentMember2021-01-012021-12-310000058492us-gaap:AccumulatedTranslationAdjustmentMember2021-12-310000058492us-gaap:AccumulatedGainLossNetCashFlowHedgeParentMember2021-12-310000058492us-gaap:AccumulatedDefinedBenefitPlansAdjustmentMember2021-12-310000058492us-gaap:AccumulatedTranslationAdjustmentMember2022-01-012022-12-310000058492us-gaap:AccumulatedGainLossNetCashFlowHedgeParentMember2022-01-012022-12-310000058492us-gaap:AccumulatedDefinedBenefitPlansAdjustmentMember2022-01-012022-12-310000058492us-gaap:AccumulatedTranslationAdjustmentMember2022-12-310000058492us-gaap:AccumulatedGainLossNetCashFlowHedgeParentMember2022-12-310000058492us-gaap:AccumulatedDefinedBenefitPlansAdjustmentMember2022-12-310000058492us-gaap:ReclassificationOutOfAccumulatedOtherComprehensiveIncomeMemberus-gaap:AccumulatedTranslationAdjustmentMember2020-01-012020-12-310000058492us-gaap:ReclassificationOutOfAccumulatedOtherComprehensiveIncomeMemberus-gaap:AccumulatedGainLossNetCashFlowHedgeParentMember2020-01-012020-12-310000058492us-gaap:ReclassificationOutOfAccumulatedOtherComprehensiveIncomeMemberus-gaap:AccumulatedDefinedBenefitPlansAdjustmentMember2020-01-012020-12-310000058492us-gaap:ReclassificationOutOfAccumulatedOtherComprehensiveIncomeMemberus-gaap:AccumulatedOtherComprehensiveIncomeMember2020-01-012020-12-310000058492us-gaap:ReclassificationOutOfAccumulatedOtherComprehensiveIncomeMemberus-gaap:AccumulatedTranslationAdjustmentMember2021-01-012021-12-310000058492us-gaap:ReclassificationOutOfAccumulatedOtherComprehensiveIncomeMemberus-gaap:AccumulatedGainLossNetCashFlowHedgeParentMember2021-01-012021-12-310000058492us-gaap:ReclassificationOutOfAccumulatedOtherComprehensiveIncomeMemberus-gaap:AccumulatedDefinedBenefitPlansAdjustmentMember2021-01-012021-12-310000058492us-gaap:ReclassificationOutOfAccumulatedOtherComprehensiveIncomeMemberus-gaap:AccumulatedOtherComprehensiveIncomeMember2021-01-012021-12-310000058492us-gaap:ReclassificationOutOfAccumulatedOtherComprehensiveIncomeMemberus-gaap:AccumulatedTranslationAdjustmentMember2022-01-012022-12-310000058492us-gaap:ReclassificationOutOfAccumulatedOtherComprehensiveIncomeMemberus-gaap:AccumulatedGainLossNetCashFlowHedgeParentMember2022-01-012022-12-310000058492us-gaap:ReclassificationOutOfAccumulatedOtherComprehensiveIncomeMemberus-gaap:AccumulatedDefinedBenefitPlansAdjustmentMember2022-01-012022-12-310000058492us-gaap:ReclassificationOutOfAccumulatedOtherComprehensiveIncomeMemberus-gaap:AccumulatedOtherComprehensiveIncomeMember2022-01-012022-12-310000058492us-gaap:FairValueMeasurementsRecurringMemberus-gaap:BankTimeDepositsMemberus-gaap:FairValueInputsLevel1Member2022-12-310000058492us-gaap:FairValueMeasurementsRecurringMemberus-gaap:BankTimeDepositsMemberus-gaap:FairValueInputsLevel2Member2022-12-310000058492us-gaap:FairValueInputsLevel3Memberus-gaap:FairValueMeasurementsRecurringMemberus-gaap:BankTimeDepositsMember2022-12-310000058492us-gaap:FairValueMeasurementsRecurringMemberus-gaap:BankTimeDepositsMemberus-gaap:EstimateOfFairValueFairValueDisclosureMember2022-12-310000058492us-gaap:FairValueMeasurementsRecurringMemberus-gaap:FairValueInputsLevel1Member2022-12-310000058492us-gaap:FairValueMeasurementsRecurringMemberus-gaap:FairValueInputsLevel2Member2022-12-310000058492us-gaap:FairValueInputsLevel3Memberus-gaap:FairValueMeasurementsRecurringMember2022-12-310000058492us-gaap:FairValueMeasurementsRecurringMemberus-gaap:EstimateOfFairValueFairValueDisclosureMember2022-12-310000058492us-gaap:FairValueMeasurementsRecurringMemberleg:DiversifiedInvestmentsAssociatedWithEsupMemberus-gaap:FairValueInputsLevel1Member2022-12-310000058492us-gaap:FairValueMeasurementsRecurringMemberleg:DiversifiedInvestmentsAssociatedWithEsupMemberus-gaap:FairValueInputsLevel2Member2022-12-310000058492us-gaap:FairValueInputsLevel3Memberus-gaap:FairValueMeasurementsRecurringMemberleg:DiversifiedInvestmentsAssociatedWithEsupMember2022-12-310000058492us-gaap:FairValueMeasurementsRecurringMemberleg:DiversifiedInvestmentsAssociatedWithEsupMemberus-gaap:EstimateOfFairValueFairValueDisclosureMember2022-12-310000058492us-gaap:FairValueMeasurementsRecurringMemberus-gaap:FairValueInputsLevel1Memberleg:LiabilitiesAssociatedWithEsupMember2022-12-310000058492us-gaap:FairValueMeasurementsRecurringMemberus-gaap:FairValueInputsLevel2Memberleg:LiabilitiesAssociatedWithEsupMember2022-12-310000058492us-gaap:FairValueInputsLevel3Memberus-gaap:FairValueMeasurementsRecurringMemberleg:LiabilitiesAssociatedWithEsupMember2022-12-310000058492us-gaap:FairValueMeasurementsRecurringMemberus-gaap:EstimateOfFairValueFairValueDisclosureMemberleg:LiabilitiesAssociatedWithEsupMember2022-12-310000058492us-gaap:FairValueMeasurementsRecurringMemberus-gaap:BankTimeDepositsMemberus-gaap:FairValueInputsLevel1Member2021-12-310000058492us-gaap:FairValueMeasurementsRecurringMemberus-gaap:BankTimeDepositsMemberus-gaap:FairValueInputsLevel2Member2021-12-310000058492us-gaap:FairValueInputsLevel3Memberus-gaap:FairValueMeasurementsRecurringMemberus-gaap:BankTimeDepositsMember2021-12-310000058492us-gaap:FairValueMeasurementsRecurringMemberus-gaap:BankTimeDepositsMemberus-gaap:EstimateOfFairValueFairValueDisclosureMember2021-12-310000058492us-gaap:FairValueMeasurementsRecurringMemberus-gaap:FairValueInputsLevel1Member2021-12-310000058492us-gaap:FairValueMeasurementsRecurringMemberus-gaap:FairValueInputsLevel2Member2021-12-310000058492us-gaap:FairValueInputsLevel3Memberus-gaap:FairValueMeasurementsRecurringMember2021-12-310000058492us-gaap:FairValueMeasurementsRecurringMemberus-gaap:EstimateOfFairValueFairValueDisclosureMember2021-12-310000058492us-gaap:FairValueMeasurementsRecurringMemberleg:DiversifiedInvestmentsAssociatedWithEsupMemberus-gaap:FairValueInputsLevel1Member2021-12-310000058492us-gaap:FairValueMeasurementsRecurringMemberleg:DiversifiedInvestmentsAssociatedWithEsupMemberus-gaap:FairValueInputsLevel2Member2021-12-310000058492us-gaap:FairValueInputsLevel3Memberus-gaap:FairValueMeasurementsRecurringMemberleg:DiversifiedInvestmentsAssociatedWithEsupMember2021-12-310000058492us-gaap:FairValueMeasurementsRecurringMemberleg:DiversifiedInvestmentsAssociatedWithEsupMemberus-gaap:EstimateOfFairValueFairValueDisclosureMember2021-12-310000058492us-gaap:FairValueMeasurementsRecurringMemberus-gaap:FairValueInputsLevel1Memberleg:LiabilitiesAssociatedWithEsupMember2021-12-310000058492us-gaap:FairValueMeasurementsRecurringMemberus-gaap:FairValueInputsLevel2Memberleg:LiabilitiesAssociatedWithEsupMember2021-12-310000058492us-gaap:FairValueInputsLevel3Memberus-gaap:FairValueMeasurementsRecurringMemberleg:LiabilitiesAssociatedWithEsupMember2021-12-310000058492us-gaap:FairValueMeasurementsRecurringMemberus-gaap:EstimateOfFairValueFairValueDisclosureMemberleg:LiabilitiesAssociatedWithEsupMember2021-12-310000058492us-gaap:CarryingReportedAmountFairValueDisclosureMemberus-gaap:FairValueInputsLevel1Member2022-12-310000058492us-gaap:CarryingReportedAmountFairValueDisclosureMemberus-gaap:FairValueInputsLevel1Member2021-12-310000058492us-gaap:SeriesOfIndividuallyImmaterialBusinessAcquisitionsMember2022-12-310000058492us-gaap:SeriesOfIndividuallyImmaterialBusinessAcquisitionsMember2021-12-310000058492us-gaap:CustomerRelationshipsMemberus-gaap:SeriesOfIndividuallyImmaterialBusinessAcquisitionsMember2022-01-012022-12-310000058492us-gaap:CustomerRelationshipsMemberus-gaap:SeriesOfIndividuallyImmaterialBusinessAcquisitionsMember2022-12-310000058492us-gaap:CustomerRelationshipsMemberus-gaap:SeriesOfIndividuallyImmaterialBusinessAcquisitionsMember2021-12-310000058492us-gaap:TechnologyBasedIntangibleAssetsMembersrt:MinimumMemberus-gaap:SeriesOfIndividuallyImmaterialBusinessAcquisitionsMember2022-01-012022-12-310000058492srt:MaximumMemberus-gaap:TechnologyBasedIntangibleAssetsMemberus-gaap:SeriesOfIndividuallyImmaterialBusinessAcquisitionsMember2022-01-012022-12-310000058492us-gaap:TechnologyBasedIntangibleAssetsMemberus-gaap:SeriesOfIndividuallyImmaterialBusinessAcquisitionsMember2022-12-310000058492us-gaap:TechnologyBasedIntangibleAssetsMemberus-gaap:SeriesOfIndividuallyImmaterialBusinessAcquisitionsMember2021-12-310000058492us-gaap:TrademarksAndTradeNamesMembersrt:MinimumMemberus-gaap:SeriesOfIndividuallyImmaterialBusinessAcquisitionsMember2022-01-012022-12-310000058492us-gaap:TrademarksAndTradeNamesMembersrt:MaximumMemberus-gaap:SeriesOfIndividuallyImmaterialBusinessAcquisitionsMember2022-01-012022-12-310000058492us-gaap:TrademarksAndTradeNamesMemberus-gaap:SeriesOfIndividuallyImmaterialBusinessAcquisitionsMember2022-12-310000058492us-gaap:TrademarksAndTradeNamesMemberus-gaap:SeriesOfIndividuallyImmaterialBusinessAcquisitionsMember2021-12-310000058492us-gaap:NoncompeteAgreementsMembersrt:MinimumMemberus-gaap:SeriesOfIndividuallyImmaterialBusinessAcquisitionsMember2022-01-012022-12-310000058492us-gaap:NoncompeteAgreementsMembersrt:MaximumMemberus-gaap:SeriesOfIndividuallyImmaterialBusinessAcquisitionsMember2022-01-012022-12-310000058492us-gaap:NoncompeteAgreementsMemberus-gaap:SeriesOfIndividuallyImmaterialBusinessAcquisitionsMember2022-12-310000058492us-gaap:NoncompeteAgreementsMemberus-gaap:SeriesOfIndividuallyImmaterialBusinessAcquisitionsMember2021-12-310000058492us-gaap:SeriesOfIndividuallyImmaterialBusinessAcquisitionsMember2022-01-012022-12-310000058492us-gaap:SeriesOfIndividuallyImmaterialBusinessAcquisitionsMember2021-01-012021-12-31leg:acquisition0000058492leg:ConverterAndDistributerOfConstructionFabricsMember2022-08-222022-08-220000058492leg:GlobalManufacturerOfHydraulicCylindersMember2022-08-262022-08-260000058492leg:ErosionControlAndGeosyntheticProductsMember2022-10-032022-10-030000058492leg:ErosionControlAndGeosyntheticProductsMember2022-12-162022-12-160000058492leg:UKManufacturerMember2021-01-302021-01-300000058492leg:PolishManufacturerMember2021-05-312021-05-310000058492leg:SpecialtyFoamAndBeddingManufacturerMember2021-06-042021-06-04leg:manufacturingFacility0000058492us-gaap:DesignatedAsHedgingInstrumentMemberus-gaap:CashFlowHedgingMember2022-12-310000058492us-gaap:DesignatedAsHedgingInstrumentMemberus-gaap:FairValueHedgingMember2022-12-310000058492us-gaap:NondesignatedMember2022-12-310000058492us-gaap:DesignatedAsHedgingInstrumentMemberus-gaap:CashFlowHedgingMember2021-12-310000058492us-gaap:DesignatedAsHedgingInstrumentMemberus-gaap:FairValueHedgingMember2021-12-310000058492us-gaap:NondesignatedMember2021-12-310000058492us-gaap:DesignatedAsHedgingInstrumentMemberus-gaap:InterestRateContractMemberus-gaap:CashFlowHedgingMember2022-01-012022-12-310000058492us-gaap:DesignatedAsHedgingInstrumentMemberus-gaap:InterestRateContractMemberus-gaap:CashFlowHedgingMember2021-01-012021-12-310000058492us-gaap:DesignatedAsHedgingInstrumentMemberus-gaap:InterestRateContractMemberus-gaap:CashFlowHedgingMember2020-01-012020-12-310000058492us-gaap:DesignatedAsHedgingInstrumentMemberus-gaap:ForeignExchangeContractMemberus-gaap:CashFlowHedgingMemberus-gaap:SalesMember2022-01-012022-12-310000058492us-gaap:DesignatedAsHedgingInstrumentMemberus-gaap:ForeignExchangeContractMemberus-gaap:CashFlowHedgingMemberus-gaap:SalesMember2021-01-012021-12-310000058492us-gaap:DesignatedAsHedgingInstrumentMemberus-gaap:ForeignExchangeContractMemberus-gaap:CashFlowHedgingMemberus-gaap:SalesMember2020-01-012020-12-310000058492us-gaap:DesignatedAsHedgingInstrumentMemberus-gaap:CostOfSalesMemberus-gaap:ForeignExchangeContractMemberus-gaap:CashFlowHedgingMember2022-01-012022-12-310000058492us-gaap:DesignatedAsHedgingInstrumentMemberus-gaap:CostOfSalesMemberus-gaap:ForeignExchangeContractMemberus-gaap:CashFlowHedgingMember2021-01-012021-12-310000058492us-gaap:DesignatedAsHedgingInstrumentMemberus-gaap:CostOfSalesMemberus-gaap:ForeignExchangeContractMemberus-gaap:CashFlowHedgingMember2020-01-012020-12-310000058492us-gaap:DesignatedAsHedgingInstrumentMemberus-gaap:CashFlowHedgingMember2022-01-012022-12-310000058492us-gaap:DesignatedAsHedgingInstrumentMemberus-gaap:CashFlowHedgingMember2021-01-012021-12-310000058492us-gaap:DesignatedAsHedgingInstrumentMemberus-gaap:CashFlowHedgingMember2020-01-012020-12-310000058492us-gaap:DesignatedAsHedgingInstrumentMemberus-gaap:FairValueHedgingMember2022-01-012022-12-310000058492us-gaap:DesignatedAsHedgingInstrumentMemberus-gaap:FairValueHedgingMember2021-01-012021-12-310000058492us-gaap:DesignatedAsHedgingInstrumentMemberus-gaap:FairValueHedgingMember2020-01-012020-12-310000058492us-gaap:NondesignatedMember2022-01-012022-12-310000058492us-gaap:NondesignatedMember2021-01-012021-12-310000058492us-gaap:NondesignatedMember2020-01-012020-12-310000058492us-gaap:InterestRateContractMemberus-gaap:CashFlowHedgingMember2021-12-310000058492us-gaap:InterestRateContractMemberus-gaap:CashFlowHedgingMember2021-10-012021-12-310000058492leg:ForwardInterestRateSwapMemberus-gaap:CashFlowHedgingMember2022-07-012022-09-300000058492leg:ForwardInterestRateSwapMemberus-gaap:CashFlowHedgingMember2022-09-300000058492leg:SeniorNotesDue2012Memberus-gaap:MediumTermNotesMember2022-09-300000058492us-gaap:AllowanceForCreditLossMember2021-12-310000058492us-gaap:AllowanceForCreditLossMember2022-01-012022-12-310000058492us-gaap:AllowanceForCreditLossMember2022-12-310000058492us-gaap:ValuationAllowanceOfDeferredTaxAssetsMember2021-12-310000058492us-gaap:ValuationAllowanceOfDeferredTaxAssetsMember2022-01-012022-12-310000058492us-gaap:ValuationAllowanceOfDeferredTaxAssetsMember2022-12-310000058492us-gaap:AllowanceForCreditLossMember2020-12-310000058492us-gaap:AllowanceForCreditLossMember2021-01-012021-12-310000058492us-gaap:ValuationAllowanceOfDeferredTaxAssetsMember2020-12-310000058492us-gaap:ValuationAllowanceOfDeferredTaxAssetsMember2021-01-012021-12-310000058492us-gaap:AllowanceForCreditLossMember2019-12-310000058492us-gaap:AllowanceForCreditLossMember2020-01-012020-12-310000058492us-gaap:ValuationAllowanceOfDeferredTaxAssetsMember2019-12-310000058492us-gaap:ValuationAllowanceOfDeferredTaxAssetsMember2020-01-012020-12-31
UNITED STATES
SECURITIES AND EXCHANGE COMMISSION
Washington, D.C. 20549
FORM 10-K
(Mark One) | | | | | |
| ☒ | ANNUAL REPORT PURSUANT TO SECTION 13 OR 15(d) OF THE
SECURITIES EXCHANGE ACT OF 1934 |
For the fiscal year ended December 31, 2022
OR
| | | | | |
| ☐ | TRANSITION REPORT PURSUANT TO SECTION 13 OR 15(d) OF THE
SECURITIES EXCHANGE ACT OF 1934 |
For the transition period from to .
Commission File Number 001-07845
LEGGETT & PLATT, INCORPORATED
(Exact name of registrant as specified in its charter) | | | | | | | | | | | |
| Missouri | | 44-0324630 |
(State or other jurisdiction of
incorporation or organization) | | (I.R.S. Employer
Identification No.) |
| No. 1 Leggett Road | | |
| Carthage, | Missouri | | 64836 |
| (Address of principal executive offices) | | (Zip code) |
Registrant’s telephone number, including area code: (417) 358-8131
SECURITIES REGISTERED PURSUANT TO SECTION 12(b) OF THE ACT: | | | | | | | | |
| Title of Each Class | Trading Symbol | Name of each exchange on which registered |
| Common Stock, $.01 par value | LEG | New York Stock Exchange |
Indicate by check mark if the registrant is a well-known seasoned issuer, as defined in Rule 405 of the Securities Act. Yes ☒ No ☐
Indicate by check mark if the registrant is not required to file reports pursuant to Section 13 or Section 15(d) of the Act. Yes ☐ No ☒
Indicate by check mark whether the registrant (1) has filed all reports required to be filed by Section 13 or 15(d) of the Securities Exchange Act of 1934 during the preceding 12 months (or for such shorter period that the registrant was required to file such reports), and (2) has been subject to such filing requirements for the past 90 days. Yes ☒ No ☐
Indicate by check mark whether the registrant has submitted electronically every Interactive Data File required to be submitted pursuant to Rule 405 of Regulation S-T (§232.405 of this chapter) during the preceding 12 months (or for such shorter period that the registrant was required to submit such files). Yes ☒ No ☐
Indicate by check mark whether the registrant is a large accelerated filer, an accelerated filer, a non-accelerated filer, a smaller reporting company, or an emerging growth company. See the definitions of “large accelerated filer,” “accelerated filer,” “smaller reporting company,” and “emerging growth company” in Rule 12b-2 of the Exchange Act. | | | | | | | | | | | | | | |
| Large accelerated filer | ☒ | | Accelerated filer | ☐ |
| | | |
| Non-accelerated filer | ☐ | | Smaller reporting company | ☐ |
| | | Emerging growth company | ☐ |
If an emerging growth company, indicate by check mark if the registrant has elected not to use the extended transition period for complying with any new or revised financial accounting standards provided pursuant to Section 13(a) of the Exchange Act. ☐
Indicate by check mark whether the registrant has filed a report on and attestation to its management's assessment of the effectiveness of its internal control over financial reporting under Section 404(b) of the Sarbanes-Oxley Act (15 U.S.C. 7262(b)) by the registered public accounting firm that prepared or issued its audit report. ☒
If securities are registered pursuant to Section 12(b) of the Act, indicate by check mark whether the financial statements of the registrant included in the filing reflect the correction of an error to previously issued financial statements. ☐
Indicate by check mark whether any of those error corrections are restatements that required a recovery analysis of incentive-based compensation received by any of the registrant’s executive officers during the relevant recovery period pursuant to §240.10D-1(b). ☐
Indicate by check mark whether the registrant is a shell company (as defined in Rule 12b-2 of the Act). Yes ☐ No ☒
The aggregate market value of the voting stock held by non-affiliates of the registrant (based on the closing price of our common stock on the New York Stock Exchange) on June 30, 2022 was $4,489,629,000.
There were 132,922,445 shares of the registrant’s common stock outstanding as of February 13, 2023.
DOCUMENTS INCORPORATED BY REFERENCE
Part of Item 10, and all of Items 11, 12, 13, and 14 of Part III, are incorporated by reference from the Company’s definitive Proxy Statement for the Annual Meeting of Shareholders to be held on May 4, 2023.
TABLE OF CONTENTS
LEGGETT & PLATT, INCORPORATED—FORM 10-K
FOR THE YEAR ENDED December 31, 2022 | | | | | | | | |
| | Page Number |
| |
| PART I |
| Item 1. | | |
| | |
| Item 1A. | | |
| | |
| Item 1B. | | |
| | |
| Item 2. | | |
| | |
| Item 3. | | |
| | |
| Item 4. | | |
| | |
| Supp. Item. | | |
| PART II |
| Item 5. | | |
| | |
| Item 6. | | |
| | |
| Item 7. | | |
| | |
| Item 7A. | | |
| | |
| Item 8. | | |
| | |
| Item 9. | | |
| | |
| Item 9A. | | |
| | |
| Item 9B. | | |
| | |
| Item 9C. | | |
| PART III |
| Item 10. | | |
| | |
| Item 11. | | |
| | |
| Item 12. | | |
| | |
| Item 13. | | |
| | |
| Item 14. | | |
| PART IV |
| Item 15. | | |
| | |
| | |
| | |
| Item 16. | | |
| |
| |
Forward-Looking Statements
This Annual Report on Form 10-K, as well as the documents, or portion thereof, incorporated by reference herein, may contain “forward-looking” statements within the meaning of Section 27A of the Securities Act and Section 21E of the Exchange Act, including, but not limited to: projections of Company revenue, income, earnings, capital expenditures, dividends, capital structure, cash flows from operations, cash repatriation, restructuring-related costs, tax impacts, effective tax rate, maintenance of indebtedness under the commercial paper program, litigation exposure, acquisitions, industry demand projections, the amount of share repurchases, impact of accounts receivable and payable programs, defined benefit plan contributions, collectability of receivables, cost of property insurance, or other financial items; possible plans, goals, objectives, prospects, strategies or trends concerning future operations; statements concerning future economic performance; possible goodwill or other asset impairment, access to liquidity, compliance with debt covenant requirements, raw material availability and pricing, supply chain disruptions, labor, semiconductor and chemical shortages, inventory levels, customer requirements, climate-related effects, and the underlying assumptions relating to forward-looking statements. These statements are identified either by the context in which they appear or by use of words such as “anticipate,” “believe,” “estimate,” “expect,” “guidance,” “intend,” “may,” “plan,” “project,” “should” or the like. All such forward-looking statements, whether written or oral, and whether made by us or on our behalf, are expressly qualified by the cautionary statements described in this provision.
Any forward-looking statement reflects only the beliefs of Leggett & Platt or its management at the time the statement is made. Because all forward-looking statements deal with the future, they are subject to risks, uncertainties and developments, which might cause actual events or results to differ materially from those envisioned or reflected in any forward-looking statement. Moreover, we do not have, and do not undertake any duty to update or revise any forward-looking statement to reflect events or circumstances after the date on which the statement was made. For all of these reasons, forward-looking statements should not be relied upon as a prediction of actual future events, objectives, strategies, trends or results.
Listed below and discussed elsewhere in further detail in this Annual Report on Form 10-K, including in Item 1A Risk Factors herein, are some important risks, uncertainties and contingencies that could cause actual events or results to differ materially from forward-looking statements. It is not possible to anticipate and list all of the risks, uncertainties and contingencies which may affect our future operations or our performance or common stock price, or which otherwise could cause actual events or results to differ from forward-looking statements. However, some of these risks and uncertainties include the following:
•the adverse impact on our semiconductor, natural gas, titanium, nickel and birch plywood supply chains, energy availability and costs, and global inflationary impacts from the Russian invasion of Ukraine;
•the adverse impact of delays and non-delivery of raw materials, parts, and finished products in our supply chain (including chemicals and semiconductors) from severe weather-related events, natural disaster, fire or explosion, terrorism, pandemics, government action, labor strikes or shutdowns at delivery ports, losses due to tampering, third-party vendor issues with quality, failure by our suppliers to comply with applicable laws and regulations, potential tariffs or other trade restrictions, or other reasons beyond our control;
•the demand for our products and our customers’ products, growth rates in the industries in which we participate, and opportunities in those industries as impacted by macroeconomic factors;
•our manufacturing facilities’ ability to remain fully operational, obtain necessary raw materials and parts, maintain appropriate labor levels, and ship finished products to customers;
•our ability to collect trade and other notes receivables in accordance with their terms due to customer bankruptcy, financial difficulties, or insolvency;
•impairment of goodwill and long-lived assets;
•impacts of the COVID-19 pandemic, including any related lockdown requirements in China;
•our ability to maintain and grow the profitability of acquired companies;
•our ability to borrow under our credit facility, including our ability to comply with the restrictive covenants in our credit facility that may limit our operational flexibility and our ability to timely pay our debt;
•our ability to manage working capital;
•our ability to comply with new climate change laws and regulations, the cost of such laws and regulations, and market, technological and reputational impacts from climate change;
•the direct and indirect physical effects of climate change, including severe weather-related events, natural disasters, and changes in climate patterns, on our markets, operations, supply chains and results;
•increases or decreases in our capital needs, which may vary depending on acquisition or divestiture activity;
•the timing and amount of share repurchases;
•adverse changes in consumer confidence, housing turnover, employment levels, interest rates, trends in capital spending, and the like;
•inflationary and other impacts on raw materials and other costs, including the availability and pricing of steel scrap and rod, chemicals, semiconductors, the availability of, and ability to retain, an adequate labor force, wage rates, and energy costs;
•our ability to pass along raw material cost increases through increased selling prices;
•price and product competition from foreign (particularly Asian and European) and domestic competitors;
•our ability to maintain profit margins if our customers change the quantity and mix of our components in their finished goods;
•our ability to access the commercial paper market;
•adverse changes in political risk and U.S. or foreign laws, regulations, or legal systems (including tax law changes and trade costs);
•cash generation or debt availability sufficient to pay the dividend;
•our ability to realize deferred tax assets on our balance sheet and challenges to our tax positions pursuant to ongoing audits;
•cash repatriation from foreign accounts;
•tariffs imposed by the U.S. government that result in increased costs of imported raw materials and products that we purchase;
•the disruption of the semiconductor industry from conflict between China and Taiwan;
•our ability to maintain the proper functioning of our internal business processes and information systems through technology failures or otherwise;
•our ability to avoid modification or interruption of our information systems and industrial control systems through cybersecurity breaches;
•the loss of business with one or more of our significant customers;
•our ability to comply with environmental, social, and governance responsibilities;
•litigation risks related to various contingencies including antitrust, intellectual property, contract disputes, product liability and warranty, taxation, climate change, environmental, and workers’ compensation expense;
•our borrowing costs and access to liquidity resulting from credit rating changes;
•business disruptions to our steel rod mill, including but not limited to, a lack of adequate supply of steel scrap, severe weather impacts, natural disasters, fire and flooding;
•risks related to operating in foreign countries, including, without limitation, credit risks, ability to enforce intellectual property rights, currency exchange rate fluctuations, industry labor strikes, increased customs and shipping rates, and inconsistent interpretation and enforcement of foreign laws;
•the effectiveness and enforcement of antidumping and countervailing duties on the import of innersprings, steel wire rod, and finished mattresses;
•restructuring and related costs;
•export controls regarding the ability of U.S. companies to export semiconductor chips and equipment to China;
•negotiation of trade agreements as a result of the United Kingdom's withdrawal from the European Union; and
•our ability to comply with privacy and data protection regulations.
PART I
Item 1. Business.
Summary
Leggett & Platt, Incorporated ("Leggett & Platt," "Company," "we," "us," or "our"), a pioneer of the steel coil bedspring, is an international diversified manufacturer that conceives, designs, and produces a wide range of engineered components and products found in many homes and automobiles. As discussed below, our operations are organized into 15 business units, which are divided into seven groups under our three segments: Bedding Products; Specialized Products; and Furniture, Flooring & Textile Products.
Overview of Our Segments
Bedding Products Segment
| | |
| BEDDING GROUP |
| Steel Rod |
| Drawn Wire |
| U.S. Spring |
| Specialty Foam |
| Adjustable Bed |
| International Bedding |
| Machinery |
Our Bedding Products segment has its roots in the Company's founding in 1883 with the manufacture of steel coil bedsprings. Today, we support our customers' needs from raw materials to components to finished mattresses and foundations to distribution and fulfillment. Our innerspring, specialty foam, and finished product development and production capabilities allow us to create value at each point, from raw materials all the way to private label finished goods and delivery to the consumer.
We operate a steel rod mill in the U.S. with historical annual output of approximately 500,000 tons. A substantial majority of that output has been used by our two U.S. wire mills that have supplied virtually all of the wire consumed by our other domestic businesses. We also supply steel rod and wire to trade customers that operate in a broad range of markets.
We are a major supplier of adjustable beds, with domestic manufacturing and distribution, and global sourcing capabilities. We also produce machinery used by bedding manufacturers in the production and assembly of their finished products. Our range of products offers our customers a single source for many of their component and finished product needs.
These innovative proprietary products and our efficient and low-cost vertical integration have made us the largest U.S.-based manufacturer in many of these businesses. We strive to understand what drives consumer purchases in our markets and focus our product development activities on meeting end-consumer needs. We believe we attain a cost advantage from efficient manufacturing methods, internal production of certain raw materials, large-scale production, and purchasing leverage. Sourcing components and finished products from us allows our customers to focus on designing, merchandising, and marketing their products.
PRODUCTS
Bedding Group
| | | | | | | | | | | |
| • | | Steel rod |
| • | | Drawn wire |
| • | | Specialty foam chemicals and additives |
| • | | Innersprings (sets of steel coils, bound together, that form the core of a mattress) |
| • | | Proprietary specialty foam for use primarily in bedding and furniture |
| • | | Private label finished mattresses, often sold compressed and boxed |
| • | | Ready-to-assemble mattress foundations |
| • | | Wire forms for mattress foundations |
| • | | Adjustable beds |
| • | | Machines that we use to produce innersprings; industrial sewing and quilting machines; mattress-packaging and glue-drying equipment |
| | | |
| | | |
CUSTOMERS
| | | | | | | | | | | |
| • | | We used about 60% of our wire output to manufacture our own products in 2022, with the majority going to our U.S. innerspring operations |
| • | | Various industrial users of steel rod and wire |
| • | | Manufacturers of finished bedding (mattresses and foundations) |
| • | | Bedding brands and mattress retailers |
| • | | E-commerce retailers |
| • | | Big box retailers, department stores, and home improvement centers |
Specialized Products Segment
| | |
| AUTOMOTIVE GROUP |
| Automotive |
|
| AEROSPACE PRODUCTS GROUP |
| Aerospace Products |
|
| HYDRAULIC CYLINDERS GROUP |
| Hydraulic Cylinders |
Our Specialized Products segment designs, manufactures, and sells products including automotive comfort and convenience systems, tubing and fabricated assemblies for the aerospace industry, and hydraulic cylinders for the material handling, construction, and transportation industries. In our Automotive business, our technical capability and deep customer engagement allows us to compete on critical functionality, such as comfort, size, weight, and noise. We believe our reliable product development and launch capability, coupled with our global footprint, makes us a trusted partner for our Tier 1 and Original Equipment Manufacturer (OEM) customers.
PRODUCTS
Automotive Group | | | | | | | | | | | |
| • | | Mechanical and pneumatic lumbar support and massage systems for automotive seating |
| • | | Seat suspension systems |
| • | | Motors and actuators, used in a wide variety of vehicle power features |
| • | | Cables |
Aerospace Products Group | | | | | | | | | | | |
| • | | Titanium, nickel, and stainless-steel tubing, formed tube, tube assemblies, and flexible joint components, primarily used in fluid conveyance systems |
Hydraulic Cylinders Group | | | | | | | | | | | |
| • | | Engineered hydraulic cylinders |
CUSTOMERS
| | | | | | | | | | | |
| • | | Automobile OEMs and Tier 1 suppliers |
| • | | Aerospace OEMs and suppliers |
| • | | Mobile equipment OEMs, primarily serving material handling and construction markets |
Furniture, Flooring & Textile Products Segment
| | |
| HOME FURNITURE GROUP |
| Home Furniture |
|
| WORK FURNITURE GROUP |
| Work Furniture |
|
| FLOORING & TEXTILE PRODUCTS GROUP |
| Flooring Products |
| Fabric Converting |
| Geo Components |
In our Furniture, Flooring & Textile Products segment, we design, manufacture, and distribute a wide range of components and finished products for residential and commercial markets, and select markets for structural fabrics and geo components. We supply components used by home and work furniture manufacturers to provide comfort, motion, and style in their finished products, as well as select lines of private label finished furniture. We also produce or distribute carpet cushion and hard surface flooring underlayment, as well as fabrics and geo components used in a variety of applications.
PRODUCTS
Home Furniture Group
| | | | | | | | | | | |
| • | | Steel mechanisms and motion hardware (enabling furniture to recline, tilt, swivel, rock, and elevate) for reclining chairs, sofas, sleeper sofas, and lift chairs |
| • | | Springs and seat suspensions for chairs, sofas, and loveseats |
Work Furniture Group | | | | | | | | | | | |
| • | | Components and private label finished goods for collaborative soft seating |
| • | | Bases, columns, back rests, casters, and frames for office chairs, and control devices that allow chairs to tilt, swivel, and elevate |
Flooring & Textile Products Group | | | | | | | | | | | |
| • | | Carpet cushion and hard surface flooring underlayment (made from bonded scrap foam, fiber, rubber, and prime foam) |
| • | | Structural fabrics for mattresses, residential furniture, and industrial uses |
| • | | Geo components (synthetic fabrics and various other products used in ground stabilization, drainage protection, erosion, and weed control) |
CUSTOMERS
| | | | | | | | | | | |
| • | | Manufacturers of upholstered furniture |
| • | | Office furniture manufacturers |
| • | | Flooring retailers and distributors, including big box retailers and home improvement centers |
| • | | Contractors, landscapers, road construction companies, retailers, and government agencies using or selling geo components |
| • | | Mattress and furniture producers and manufacturers of packaging, filtration, and draperies |
Strategic Priorities
Primary Financial Metric
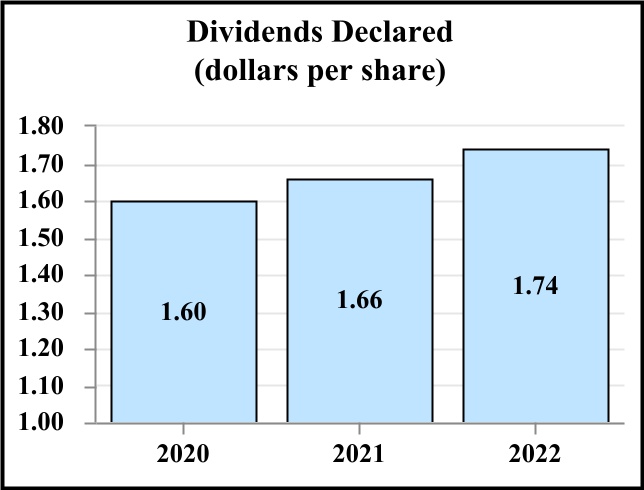
Total Shareholder Return (TSR) is a primary financial measure that we use to assess long-term performance. TSR = (Change in Stock Price + Dividends) / Beginning Stock Price. We target average annual TSR of 11–14% through an approach that employs four TSR sources: revenue growth, margin expansion, dividends, and share repurchases.
During the period this report covers, our incentive programs rewarded return and cash generation, and profitable growth. Senior executives participated in a TSR-based incentive program (based on our performance compared to a group of approximately 300 peers). For information about our TSR targets, see the discussion under Total Shareholder Return in Item 7, Management's Discussion and Analysis of Financial Condition and Results of Operations on page 33. Disciplined Growth
The expected long-term contribution to TSR from revenue growth is 6-9%. From 2020 to 2022, we generated total revenue growth of 3% per year on average as a result of commodity inflation. Combined unit volume declines partially offset by acquisition growth generated revenue declines of (4)% per year on average. We strive to achieve the growth target through a combination of sources, including: (i) increasing content and new programs, particularly in our Bedding Products and Specialized Products segments; (ii) expanding our addressable markets; and (iii) identifying strategic acquisitions that complement our current products or capabilities.
We will continue to make investments to support expansion in current businesses and product lines where sales are growing profitably. We also envision periodic acquisitions that add capabilities in these businesses or provide opportunities to enter more diverse, faster-growing, and higher margin markets. We expect all acquisitions to have a clear strategic rationale, a sustainable competitive advantage, a strong fit with the Company, and be in attractive and growing markets.
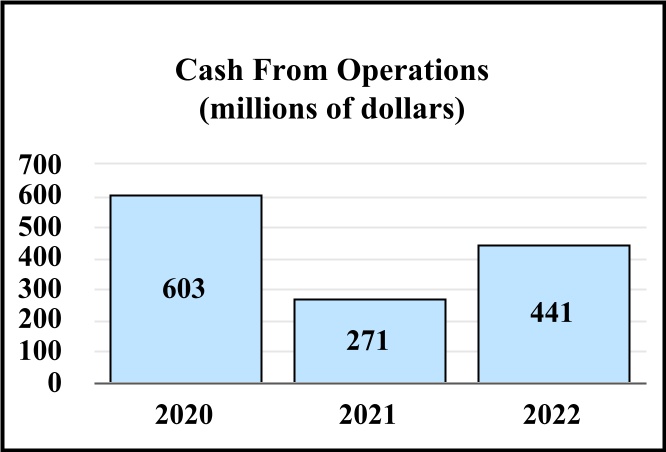
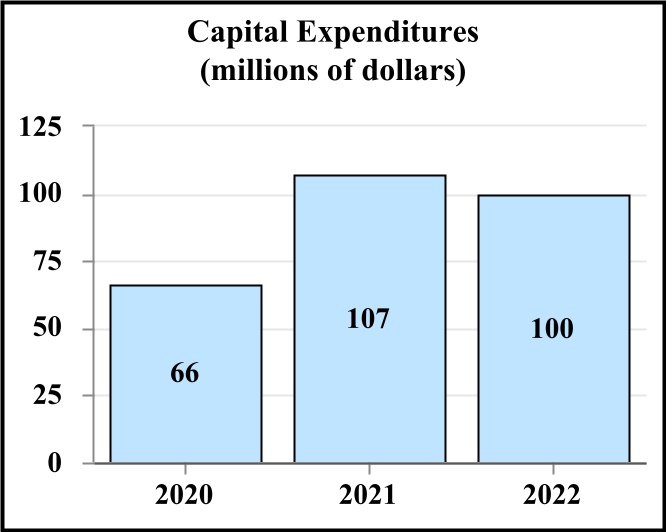
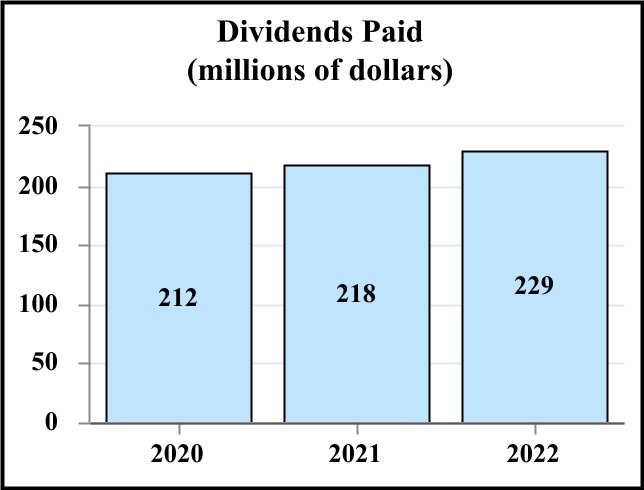
Returning Cash to Shareholders
From 2020 to 2022, we generated $1.32 billion of operating cash, and we returned $740 million of this cash to shareholders in the form of dividends ($659 million) and share repurchases ($81 million). Our long-term priorities for use of cash are: fund organic growth including capital expenditures, pay dividends, fund strategic acquisitions, and repurchase stock with available cash. In 2020 and 2021, we focused on deleveraging by temporarily limiting share repurchases, controlling the pace of acquisition spending, and using operating cash flow to repay debt from a 2019 acquisition. However, in 2022, we repurchased 1.7 million shares (at an average price of $35.94) and issued .9 million shares. We expect 2023 stock repurchases to be less than 2022.
For information about dividends and share repurchases, see the discussion under Dividends on page 47 and Stock Repurchases on page 48 in Item 7, Management's Discussion and Analysis of Financial Condition and Results of Operations. Macroeconomic Challenges
The impact of the COVID-19 pandemic began in early 2020, materially reducing the demand for our products. We responded to the pandemic by, among other things, aligning our variable cost structure to reduced demand levels, significantly reducing fixed costs, and cutting capital expenditures. We ended 2020 with fixed cost savings of approximately $90 million. By mid-second quarter of 2020, we began to see rapid recovery in businesses serving home-related and auto markets which benefited our Bedding, Home Furniture, Flooring & Textile, and Automotive businesses.
As demand recovered in Bedding, we began to face global constraints, including shortages of nonwoven fabrics used in the production of ComfortCore® innersprings and availability of labor. Labor issues were amplified by the rapid change in our production needs. Our operations shifted from a near shutdown in early April 2020 to customer demand in excess of pre-pandemic levels in a matter of weeks across many of our businesses. Chemical shortages also emerged as producers of the chemicals used to make foam were impacted by various weather issues and reported a variety of equipment and production issues.
In 2021, despite continued macroeconomic challenges, including supply chain issues related to semiconductor shortages, foam chemical shortages, labor availability, and transportation challenges, as well as higher costs associated with each of these issues, we recorded record sales and earnings from continuing operations. We made progress on addressing the chemical and labor shortages; however, both of these issues continued throughout 2021.
Macroeconomic issues in 2022, driven primarily by escalating inflation and rising interest rates, resulted in slowing demand in our residential end markets. The majority of the supply chain issues have improved. However, semiconductor shortages are expected to continue through at least 2023.
Acquisitions
2022
In August 2022, we acquired two businesses. First, we acquired a small U.S. textiles business that converts and distributes construction fabrics for the furniture and bedding industries for a cash purchase price of $2 million. This acquisition became part of our Furniture, Flooring & Textile Products segment. Second, we acquired a leading global manufacturer of hydraulic cylinders for heavy construction equipment for a cash purchase price of $61 million (and $29 million of additional contingent consideration to be paid in cash at a later date). This business has manufacturing locations in Germany and China and a distribution facility in the United States. This acquisition builds scale in our hydraulic cylinders growth platform and brings us into an attractive segment of the market that aligns well with trends in automation and autonomous equipment. This business operates within the Specialized Products segment.
In early October and mid-December 2022, we acquired two Canadian distributors of products used for erosion control, stormwater management, and various other applications for a cash purchase price of $7 million and $13 million, respectively. These acquisitions became a part of our Furniture, Flooring & Textile Products segment and expanded the geographic scope of our Geo Components business unit.
2021
In January 2021, we acquired a United Kingdom (UK) manufacturer specializing in metallic ducting systems, flexible joints, and components for space, military, and commercial applications for a cash purchase price of $28 million. This
acquisition expanded the capabilities of our aerospace products business to include flexible joint fabrication and operates within our Specialized Products segment.
In May 2021, we acquired a Polish manufacturer of bent metal tubing for furniture used in office, residential, and other settings. The total cash purchase price was $5 million. This acquisition operates within our Furniture, Flooring & Textile Products segment.
In June 2021, we acquired a specialty foam and finished mattress manufacturer serving the UK and Irish marketplace with two manufacturing facilities in the Dublin area for a cash purchase price of $120 million. This acquisition operates within our Bedding Products segment.
2020
There were no acquisitions of businesses in 2020. However, we paid approximately $8 million of additional consideration associated with a Polish upholstered office furniture business acquired in a prior year.
For more information regarding our acquisitions, please refer to Note R on page 109 of the Notes to Consolidated Financial Statements. Divestitures
2022
In February 2022, we sold our South African bedding innerspring operation for a cash purchase price of approximately $2 million. This business was reported in our Bedding Products segment.
2021
In July 2021, we sold a Mexican specialty wire operation in our Bedding Products segment. The business was sold for a cash purchase price of approximately $7 million.
2020
In 2020, we divested two small businesses in our Bedding Products segment: a specialty wire operation in our Drawn Wire business and the final operation in our exited Fashion Bed business. The businesses were sold for an aggregate selling price of approximately $11 million.
Foreign Operations
The percentages of our trade sales related to products manufactured outside the United States for the last three years were 34%, 36%, and 35% in 2020, 2021, and 2022, respectively. In comparison to our other two segments, our Specialized Products segment has a larger percentage of trade sales manufactured outside the United States which ranged between 84% and 86% over the last three years.
Our international operations are principally located in Europe, China, Canada, and Mexico. Our products in these foreign locations primarily consist of:
Europe
| | | | | |
| • | Innersprings and specialty foam for private label mattresses and mattress applications |
| • | Lumbar and seat suspension systems for automotive seating and actuators for automotive applications |
| • | Seamless and welded tubing and fabricated assemblies for aerospace applications |
| • | Select lines of private label finished furniture |
| • | Hydraulic cylinders for the material handling, heavy construction equipment, and transportation industries |
| • | Machinery and equipment designed to manufacture innersprings for mattresses |
China
| | | | | |
| • | Lumbar and seat suspension systems for automotive seating |
| • | Cables, motors, and actuators for automotive applications |
| • | Recliner mechanisms and bases for upholstered furniture |
| • | Work furniture components, including chair bases and casters |
| • | Innersprings for mattresses |
| • | Hydraulic cylinders for heavy construction equipment |
Canada
| | | | | |
| • | Lumbar and seat suspension systems for automotive seating |
| • | Fabricated wire for the furniture and automotive industries |
| • | Work furniture chair controls and bases |
| • | Geo components |
Mexico
| | | | | |
| • | Lumbar and seat suspension systems for automotive seating |
| • | Motors and actuators for automotive applications |
| • | Adjustable beds |
| • | Innersprings and fabricated wire for the bedding industry |
| • | Select lines of private label finished furniture |
Geographic Areas of Operation
As of December 31, 2022, we had 135 manufacturing facilities in 18 countries; 84 located in the U.S. and 51 located in foreign countries, as shown below. We also had various sales, warehouse, and administrative facilities. However, our manufacturing facilities are our most important properties.
| | | | | | | | | | | |
| Bedding Products | Specialized Products | Furniture, Flooring & Textile Products |
| North America | | | |
| Canada | | n | n |
| Mexico | n | n | n |
| United States | n | n | n |
| Europe | | | |
| Austria | | n | |
| Belgium | | n | |
| Croatia | n | | |
| Denmark | n | | |
| France | | n | |
| Germany | | n | |
| Hungary | | n | |
| Ireland | n | | |
| Poland | | | n |
| Switzerland | n | | |
| United Kingdom | n | n | |
| South America | | | |
| Brazil | n | | |
| Asia | | | |
| China | n | n | n |
| India | | n | |
| South Korea | | n | |
Dependence on Market Demand for Key Product Families
Our business is dependent upon the market demand for, and continued sale of, various product families. The following table shows our approximate percentage of trade sales by product family for the last three years which indicates the degree of dependence upon market demand:
| | | | | | | | | | | | | | | | | | | | | | | | | | |
| Product Families | 2022 | | 2021 | | 2020 |
Bedding Group | 46 | % | | 48 | % | | 48 | % |
| Flooring & Textile Products Group | 18 | | | 18 | | | 19 | |
| Automotive Group | 17 | | | 16 | | | 17 | |
| Home Furniture Group | 8 | | | 8 | | | 7 | |
| Work Furniture Group | 6 | | | 6 | | | 5 | |
| Hydraulic Cylinders Group | 3 | | | 2 | | | 2 | |
| Aerospace Products Group | 2 | | | 2 | | | 2 | |
| | | | | | | | |
The Company does not have a material amount of sales derived from government contracts subject to renegotiation of profits or termination at the election of any government. As such, our business is not materially dependent upon governmental customers.
Distribution of Products
In each of our segments, we sell and distribute our products primarily through our own personnel. However, many of our businesses have relationships and agreements with outside sales representatives and distributors. We do not believe any of these agreements or relationships would, if terminated, have a material adverse effect on the consolidated financial condition, operating cash flows, or results of operations of the Company.
Sources and Availability of Raw Materials
The products we manufacture require a variety of raw materials. We believe that worldwide supply sources are available for all the raw materials we use, except for semiconductors and certain chemicals as explained below. Among the most important raw materials that we use are:
| | | | | |
| • | Various types of steel, including scrap, rod, wire, sheet, and stainless |
| • | Chemicals used in foam production |
| • | Foam scrap |
| • | Woven and nonwoven fabrics |
| • | Titanium and nickel-based alloys and other high strength metals |
| • | Electronic systems (including semiconductors) |
Currently, there is a shortage of semiconductors in the automotive industry. As semiconductor demand elsewhere in the economy has increased over the past few years, automotive OEMs and other suppliers have not been able to secure an adequate supply and as a result have reduced production of some automobile models and/or eliminated certain features (some of which may be added later), which in turn has reduced our sale of products. Consumer demand remains strong, but the semiconductor shortage has caused new vehicle inventories to remain near historically low levels. Our Automotive Group uses the semiconductors in seat comfort products, and to a lesser extent in motors and actuators. Although our Automotive Group has been able to obtain an adequate supply of semiconductors, we are dependent on our suppliers to deliver these semiconductors in accordance with our production schedule. A shortage of the semiconductors, either to us, the automotive OEMs, or our suppliers, can disrupt our operations and our ability to deliver products to our customers. If we, our customers, or our suppliers cannot secure an adequate supply of semiconductors, this may negatively impact our sales, earnings, and financial condition.
We have exposure to the cost of chemicals, including TDI, MDI, and polyol. The cost of these chemicals has fluctuated at times, but we have generally passed the changes through to our customers. In 2021, chemical prices inflated due to robust demand and shortages from severe weather, supplier production disruptions, port delays, and logistics challenges. The supply shortages in 2021 resulted in significant restrictions by producers. Late in 2021, chemical prices leveled off as supply availability improved. In 2022, chemical pricing was relatively stable at historically high levels. If we are unable to obtain the chemicals or pass the cost along to our customers, our results of operations may be negatively impacted.
We supply our own raw materials for many of the products we make. For example, we produce steel rod that we make into steel wire, which we then use to manufacture innersprings and foundations for mattresses. We supply a substantial majority of our domestic steel rod requirements through our own rod mill. Our wire drawing mills supply nearly all of our U.S. requirements for steel wire.
Customer Concentration
We serve thousands of customers worldwide, sustaining many long-term business relationships. In 2022, our largest customer accounted for less than 6% of our consolidated revenues. Our top 10 customers accounted for approximately 31% of these consolidated revenues. The loss of one or more of these customers could have a material adverse effect on the respective segment in which the customer’s sales are reported, including each of our segments.
Patents and Trademarks
As of December 31, 2022, we had 1,239 patents issued, 506 patents in process, 1,131 trademarks registered, and 40 trademarks in process. No single patent or group of patents, or trademark or group of trademarks, is material to our operations as a whole. A significant number of our patents relate to products manufactured in each of our three segments, while over half of our trademarks relate to products manufactured by the Bedding Products segment. We do not have any patent or group of patents, the expiration of which would have a material negative effect on our results of operations or financial condition.
Some of our most significant trademarks include: | | | | | |
| • | ComfortCore®, Mira-Coil®, VertiCoil®, Quantum®, Nanocoil®, Softech®, Lura-Flex®, Superlastic®, and Active Support Technology® (mattress innersprings) |
| • | Energex®, Coolflow®, ThermaGel®, and EcoFlowTM (specialty foam products) |
| • | Semi-Flex® (box spring components and foundations) |
| • | Spuhl® and Fides® (mattress innerspring manufacturing machines) |
| • | Wall Hugger® (recliner chair mechanisms) |
| • | No-Sag® (wire forms used in seating) |
| • | LPSense® (capacitive sensing) |
| • | Hanes® (fabric materials) |
| • | Schukra® (automotive seating products) |
| • | Gribetz® and Porter® (quilting and sewing machines) |
Product Development
One of our strongest performing product categories across the Company is ComfortCore®, our fabric-encased innerspring coils used in hybrid and other mattresses. ComfortCore® represented over 60% of our U.S. innerspring units in 2022. A number of our ComfortCore® innersprings contain a feature we call Quantum® Edge. These are narrow-diameter, fabric-encased coils that form a perimeter around an innerspring set, replacing a rigid foam perimeter in a finished mattress. In 2022, over 40% of our ComfortCore® innersprings in the U.S. had the Quantum® Edge feature. Also, two new products were launched in 2022 called the Quantum Edge® Enhanced Profile with Eco-Base™ and Caliber Edge® Enhanced Profile with Eco-Base™. Developed with a more mindful approach, Quantum Edge and Caliber Edge Enhanced Profile with Eco-Base integrates a robust fabric that replaces base foam. To maintain mattress profile, innerspring coil height is increased by one inch.
Our Specialty Foam business formulates many of the chemicals and additives used in the production of specialty foams for the bedding and furniture industries. These branded, specialty polyols and additives enhance foam performance by reducing heat retention and improving mobility, support, and durability. These innovations enable us to create quality mattresses that can be compressed, and we have a significant amount of intellectual property around these specialty chemical formulations.
Our Automotive business designs and engineers lightweight components that help reduce overall vehicle weight, and improve fuel efficiency (and thus reduce noise and greenhouse gas emissions) while maintaining performance, safety, and functionality. These products help auto manufacturers meet emission standards and their environmental goals.
Many of our other businesses are engaged in product development activities to protect our market position, support ongoing growth, and help our customers achieve their sustainability goals.
Human Capital Management
Our success depends on our ability to attract and retain diverse talent, foster a culture of inclusion, diversity, and equity, provide a safe and healthy work environment, train and develop our employees, and ensure productive succession planning efforts. The Board’s Human Resources and Compensation Committee has oversight of our human resources policies and programs, officer and director compensation, compensation plans, executive succession planning, and senior management leadership development. This oversight is designed to support our business objectives, to attract, retain, and develop high quality leadership, and to link compensation with business performance.
Our Employees
At year-end 2022, we had approximately 19,900 employees, of which 13,400 were engaged in production and 11,200 were international employees. Of these employees, 6,200 were in Bedding Products, 7,800 were in Specialized Products, and 5,000 were in Furniture, Flooring & Textile Products, with the remainder in other roles. Also, at year-end 2022, 11% of our employees were represented by labor unions that collectively bargain for work conditions, wages, or other issues. We did not experience any material work stoppage related to labor contract negotiations during 2022, and we are not aware of circumstances likely to result in a material work stoppage during 2023. At year-end 2021, we had approximately 20,300 employees.
Our Ability to Attract, Recruit, and Retain Employees
We operate in competitive labor markets, and accordingly, we attract, recruit, and retain employees through competitive compensation and benefits, learning and development programs that support career growth, and employee engagement initiatives designed to foster a strong, inclusive culture.
Compensation and Benefits. We offer cash compensation and benefits designed to attract and retain the talent needed to achieve our business objectives. Depending on location, we offer health, dental and vision benefits; flexible spending plans and health savings accounts; retirement savings; disability, life, critical illness, accident and travel insurance; well-being and employee assistance programs; vacation, personal time, and holidays; and discount stock purchase plans. We also provide incentive programs for management employees based on performance. Finally, we offer part-time jobs, flexible hours, and remote and hybrid working, where applicable.
Employee Engagement and Satisfaction. We analyze employee satisfaction to better enhance engagement. At many of our locations, we collect data on employee satisfaction, feedback, and turnover through surveys, employee focus groups, and turnover analysis. From this data, we develop plans designed to improve engagement and reduce turnover. At all locations, we also have a grievance-reporting mechanism where employees can express concerns, confidentially and anonymously, regarding possible violations of ethics, law, or our policies.
Turnover. We rely on a diverse, stable workforce to deliver our operating results. In 2022, our turnover rates in the U.S. were reasonably comparable to average voluntary turnover rates of manufacturers in the industries in which we operate.
Our Culture of Inclusion, Diversity, and Equity
We continue to foster a culture of inclusion, diversity, and equity (ID&E) with equitable opportunities for our employees to contribute, grow, and advance. Our ID&E programs are designed to cultivate inclusive team environments that empower employees to realize their full potential. At year-end 2022, 28% of our U.S. employees identified as female and 38% of our U.S. employees identified with a historically underrepresented race/ethnic group. Our gender diversity is reasonably comparable to the manufacturing industry average of 29%. We believe that it is important to increase representation of women in management and leadership roles. Also, while our race/ethnic diversity is slightly higher than the 2022 Bureau of Labor Statistics, we also see opportunities to increase our race and ethnic representation especially in management and leadership roles.
ID&E Strategies. We are taking strategic actions to foster an inclusive culture, attract and retain diverse talent, build equitable policy frameworks and processes, and create metrics, goals, and accountability with our leaders.
ID&E Plan. We have three cross-functional groups that drive awareness, engagement, and accountability in our ID&E efforts. In early 2023, we established the ID&E Global Executive Council, consisting of executives who champion our efforts to ensure that ID&E is a business imperative. Our ID&E Pillar Action Teams, comprised of a broad group of employees, establish long-term strategies and action plans. These plans are designed to (i) provide a safe and inclusive workplace, (ii) equip our people to attract, develop, retain, and reward a diverse workforce, (iii) help us be an inclusive and equitable corporate citizen, (iv) use data to foster tangible improvements, and (v) enhance business results. Our Local Communities of Action are designed to promote ID&E throughout our businesses through supplier diversity, employee resource groups (ERG), and communication.
Progress in 2022. We made meaningful progress toward our ID&E goals. We launched several programs designed to promote inclusion through more collaborative teams, to create a more diverse approach with our supply chains, and to raise the visibility of women and foster their personal and professional development through a Women's ERG. Also, we established priorities to adhere to the CEO Action for Diversity and Inclusion pledge made by our CEO, analyzed and benchmarked workforce data to clarify our ID&E performance metrics, and created a process to increase the diversity of our applicant pools.
Looking Ahead. We expect to introduce our ID&E programs to international employees, expand our ERG memberships, and create ID&E training programs for leaders and teams. We also expect to improve our data analysis and reporting and to continue to incorporate our values and ID&E principles into our talent and human resource processes.
Our Workforce Health and Safety
We are dedicated to the health and safety of our employees through prevention, education, and awareness with the objective of mitigating workplace injuries through accident investigation and process safety. Our dedicated staff of professionals supports health and safety management at our manufacturing facilities, including implementation of a comprehensive program called “SafeGuard.” The SafeGuard program develops relevant job hazard analyses, which are undertaken on many processes and used to develop comprehensive job procedures. This allows us to implement job-specific health and safety practices across our business.
Continuing Education and Training
Developing our talent continues to be part of our ongoing, long-term strategy, which is focused on growing talent, including technical/skilled positions, supervisory and management levels, and other future leaders. We believe that the first step toward achieving our long-term strategic business goals is to maintain a culture of employee development at all levels of the Company.
In 2022, we introduced our Leggett Learning & Leadership site, which is a learning platform offering online content through interactive courses. The topics cover developing core skills, applying those skills, and providing management tools for leaders. In addition, our talent development team presented multiple Leadership Essentials Experience courses. These virtual, instructor-led courses offered impactful lectures and discussions covering development in communication, conflict, coaching, feedback and influence. We also have our “Doors” Internship Program that helps interns learn and contribute by allowing them to gain real-life experience in their field of study through immersive leadership workshops covering goal setting, personal branding, networking, communication and leadership, positive conflict, dealing with criticism, and giving and receiving feedback. Finally, our manufacturing employees receive new hire and annual refresher safety training, weekly “tool box” talks regarding safety and training, job-specific safety training based on the jobs hazards analysis developed from our SafeGuard program, and COVID-19 work procedures handbook training.
Succession Development
We are committed to having strong managers and leadership in critical roles across the Company. Our values and culture guide our talent initiatives, which are designed to create a pipeline of strong, high performing leadership candidates to serve in progressively important roles throughout the Company. Our internal promotion rate over the last three years for corporate officer positions was 88%. We are building on our success in these areas and continue to develop our succession processes to allow us to adapt and grow.
Trends in Market Demand and Competition
Demand Trends for our Products. In early 2020, the COVID-19 pandemic and the resulting economic downturn had a negative effect on the demand for our products and our customers’ products. By mid-second quarter 2020, we began to see rapid recovery in businesses serving home-related and auto markets. This benefited our Bedding, Home Furniture, Flooring & Textile, and Automotive businesses. We ended 2020 with fourth quarter sales in many of our businesses above fourth quarter 2019 levels. In 2021, our trade sales grew 7% compared to pre-pandemic 2019 levels. In 2022, our trade sales increased 1% compared to 2021 levels. Organic sales were flat, with volume declines of 7% and negative currency impact of 2%, offset by raw material-related selling price increases of 9%. Acquisitions, net of divestitures, added 1% to sales growth. The volume declines resulted from demand softness in residential end markets, partially offset by growth in automotive and industrial end markets.
Competition. Many companies offer products that compete with those we manufacture and sell. The number of competing companies varies by product family, but many of the markets for our products are highly competitive. We tend to attract and retain customers through innovation, product quality, competitive pricing, and customer service. Many of our competitors try to win business primarily on price, but, depending upon the particular product, we experience competition based on quality and performance as well. In general, our competitors tend to be smaller, private companies.
Based on certain industry data, we believe we are the largest U.S.-based manufacturer, in terms of revenue, of the following:
| | | | | |
| • | Bedding components |
| • | Automotive seat support and lumbar systems |
| • | Specialty bedding foams and private label finished mattresses |
| • | Components for home furniture and work furniture |
| • | Flooring underlayment |
| • | Adjustable beds |
| • | Bedding industry machinery |
We continue to face pressure from foreign competitors, as some of our customers source a portion of their components and finished products offshore. In addition to lower labor rates, foreign competitors benefit (at times) from lower raw material costs. They may also benefit from currency factors and more lenient regulatory climates. We typically compete in market segments that value product differentiation. However, when we do compete on cost, we typically remain price competitive in most of our business units, even versus many foreign manufacturers, as a result of our efficient operations, automation, vertical integration in steel rod and wire, logistics and distribution efficiencies, and large-scale purchasing of raw materials and commodities. We have also reacted to foreign competition in certain cases by selectively adjusting prices, developing new proprietary products that help our customers reduce total costs, and shifting production offshore to take advantage of lower input costs.
For information about antidumping duty orders regarding innerspring, steel wire rod, and mattress imports, please see Competition in Item 7, Management’s Discussion and Analysis of Financial Condition and Results of Operations on page 35. Seasonality
Although the underlying seasonality in our businesses has been obscured over the last few years by the COVID-19 pandemic, supply chain disruptions, inflation, and other macroeconomic impacts, we generally experience some seasonality in our consolidated sales, earnings, and operating cash flows. Both sales and earnings are typically higher in the second and third quarters, primarily driven by our residential bedding and furniture businesses, as well as our geo components business. Also, historically, our operating cash flows have been stronger in the fourth quarter, primarily related to the timing of cash collections from customers and payments to vendors, and lower in the first quarter, when annual cash incentive payments are paid and as inventories typically increase.
Governmental Regulations
Our operations are subject to various federal, state, local, and international laws and regulations, including environmental regulations. We have policies intended to ensure that our operations are conducted in compliance with applicable laws and regulations. While we cannot predict policy changes by various regulatory agencies or unexpected operational or other developments, management expects that compliance with these laws and regulations will not have a material adverse effect on our capital expenditures (including those capital expenditures for environmental control facilities), earnings, and competitive position.
Internet Access to Information
We routinely post information for investors under the Investor Relations section of our website (www.leggett.com). Our annual reports on Form 10-K, quarterly reports on Form 10-Q, current reports on Form 8-K, and all amendments to those reports are made available, free of charge, on our website as soon as reasonably practicable after electronically filed with, or furnished to, the SEC. In addition to these reports, the Company’s Financial Code of Ethics, Code of Business Conduct and Ethics, and Corporate Governance Guidelines, as well as charters for the Audit, Human Resources and Compensation, and Nominating, Governance and Sustainability Committees of our Board of Directors, can be found on our website under the Governance section. Information contained on our website does not constitute part of this Annual Report on Form 10-K.
Industry and Market Data
Unless indicated otherwise, the information concerning our industries contained in this Annual Report is based on our general knowledge of and expectations concerning the industries. Our market share is based on estimates using our internal data, data from various industry analyses, internal research, and adjustments and assumptions that we believe to be reasonable. We have not independently verified data from industry analyses and cannot guarantee their accuracy or completeness.
Item 1A. Risk Factors.
Investing in our securities involves risk. Set forth below and elsewhere in this report are risk factors that could cause actual results to differ materially from the results contemplated by the forward-looking statements contained in this report. We may amend or supplement these risk factors from time to time by other reports we file with the SEC.
GEOPOLITICAL RISK FACTORS
The Russian invasion of Ukraine has caused supply chain disruptions and global inflationary impacts that have had, and could continue to have, a negative effect on the demand for our products and our results of operations.
Our Automotive Group uses semiconductors, the production of which uses neon gas. Our Aerospace Products Group uses nickel and titanium in the production of aerospace tubing. Several of our businesses use birch plywood in their products. All of our businesses are subject to energy costs that can be impacted by the supply of oil and natural gas.
Although we do not have operations in Russia, Belarus, or Ukraine, and we have not had a material amount of sales into these countries, some of our businesses have sourced, directly or indirectly, a portion of their supply chain requirements of nickel, titanium, and birch plywood from Russia. Also, a significant portion of neon gas is produced in Ukraine. Since the invasion began, the prices of these materials have significantly increased. Several countries have imposed economic sanctions against Russia as a result of its military action. The United States, the European Union, and G7 countries have also moved to revoke Russia’s “most favored nations” trade status, which has resulted or could result in higher duties on imported products. Also, the European Union and the United Kingdom have banned timber imports from Russia.
It is possible sanctions could be expanded, or additional measures taken, which could restrict the import of nickel and titanium, and further restrict the import of birch plywood from Russia or greatly increase the cost of procurement via further increased duties or otherwise. If sanctions are further imposed or duties are further increased on these materials, it could reduce global capacity, impact our ability to obtain them (or alternatives) in a timely manner, or further increase the price of these materials. Inability to obtain sufficient quantities of these materials could disrupt our supply chain. Inability to pass through increased prices to our customers could have a negative impact on our results of operations.
A significant portion of global production of oil is refined and exported from Russia. The European Union and certain countries, including the United States, the United Kingdom, Canada, and Australia, have either partially or fully banned the import of Russian oil. With decreased supply availability, fuel costs have increased and may continue to increase. This has impacted, and may continue to impact, both our businesses and consumers. Also, there has been a reduction of natural gas exports from Russia to Europe from sanction-related impacts and disruption in pipeline delivery, resulting in shortages and higher prices. Higher energy prices have contributed to broader inflationary trends, which have resulted, in some cases, in reduced discretionary consumer spending and a softening of demand for our products. If this continues, the demand for our products may continue to be negatively impacted, which would have a negative impact on our sales.
Finally, if the conflict in Ukraine expands geographically or in intensity, this may have a negative impact on our operations, including access to energy and other raw materials.
Conflict between China and Taiwan could lead to trade sanctions, technology disputes, or supply chain disruptions, which could, in particular, impact the semiconductor industry.
Our Automotive Group uses semiconductors in seat comfort products, and to a lesser extent in motors and actuators. Currently, there is a global shortage of semiconductors. According to certain market reports, both China and Taiwan are leading manufacturers of the world’s semiconductor supply. Conflict between China and Taiwan might lead to trade sanctions, technology disputes, or supply chain disruptions, which could, in particular, affect the semiconductor industry. If this were to occur, our Automotive Group’s ability to source an adequate supply of semiconductors may be reduced, which
could adversely harm our business, financial condition and results of operations. Such a conflict also could negatively impact our OEM and Tier customers' supply chains and production schedules. In addition, any outbreak of hostilities or conflict between China and Taiwan could harm our operations globally, and the operations of our customers and suppliers.
OPERATIONAL RISK FACTORS
Supply chain disruptions impacting our ability to timely receive competitively-priced raw materials and parts used in our products, or impacting our ability to timely deliver our finished products to customers, may adversely affect our manufacturing processes, financial condition, results of operations, and cash flows.
We have manufacturing facilities in 18 countries, primarily located in North America, Europe, and Asia. In our manufacturing processes, we source raw materials and parts from a global supply chain. We sell and deliver our finished products to customers all over the world. We rely on third parties to supply certain raw materials, components, and packaging products, and to deliver our finished products. Any interruption or failure by our suppliers, distributors, or other contractors to meet their obligations on schedule or in accordance with our expectations could adversely affect our business and financial results. We have experienced significant supply chain disruptions related to semiconductor shortages, labor availability, and freight challenges, as well as higher costs associated with each of these issues. We have also experienced delays in delivery of raw materials, parts, and finished goods because of shutdown or congested delivery ports, trucking constraints, severe weather, and the invasion of Ukraine. This has resulted in reduced volume and higher costs in many of our businesses, including our Automotive Group and Bedding Products segment, primarily related to negative impacts on component demand and finished goods production.
We also bear the risk of delays or non-delivery because of natural disaster, fire or explosion, terrorism, pandemics (such as COVID-19), government action, or other reasons beyond our control or the control of our suppliers, all of which could impair our ability to timely manufacture and deliver our products.
Strikes or shutdowns at delivery ports, loss of or damage to our raw materials, parts, or finished products while they are in transit or storage, losses due to tampering, third-party vendor issues with quality, failure by our suppliers to comply with applicable laws and regulations, potential tariffs or other trade restrictions, or similar problems, could restrict or delay the supply of our raw materials, parts, or delivery of our finished products resulting in harm to our business and reputation.
The aforementioned supply chain risks can materially adversely affect our manufacturing processes, financial condition, results of operations, and cash flows.
The COVID-19 pandemic has had, and could further have, an adverse impact to (i) our manufacturing operations' ability to remain fully operational; and (ii) our ability to obtain necessary raw materials and parts, maintain appropriate labor levels, and ship finished products to customers due to supply chain disruptions or otherwise; all of which, in the aggregate, have had, and could further have, a negative impact on our trade sales, earnings, liquidity, cash flow, financial condition, and our stock price.
All of the countries in which we operate have been affected by the COVID-19 pandemic. All of our facilities are open and running at this time. If our manufacturing operations are not fully operational, our ability to obtain necessary raw materials and parts, to manufacture and ship finished products to our customers, and to maintain appropriate labor levels because of absenteeism or otherwise, could be negatively impacted, particularly if we are unable to shift production to other manufacturing facilities. Some of our facilities in China, most notably in our Automotive and Home Furniture businesses, have in the past been temporarily closed from time to time due to strict lockdown requirements. If the lockdowns in China are imposed on a broader geographic scope, this could materially negatively impact our manufacturing capacity, our customers or vendors, and our ability to transport goods in our supply chain. We have also had, at various times, some capacity restrictions on our plants due to governmental orders in other parts of the world. We have been and could be further negatively affected by governmental action in any one or more of the countries in which we operate by the imposition, or re-imposition, of restrictive social measures, mandatory closures of retail establishments that sell our products or our customers’ products, travel restrictions, and restrictions on the import or export of products. The continued realization of these risks to our manufacturing operations, labor force, and supply chain could also increase labor, commodity, and transportation costs.
Business disruptions to our steel rod mill, if coupled with an inability to purchase an adequate and/or timely supply of quality steel rod from alternative sources, could have a material negative impact on our Bedding Products segment and the Company's results of operations.
We purchase steel scrap from third-party suppliers. This scrap is converted into steel rod in our mill in Sterling, Illinois. Our steel rod mill has historically had annual output of approximately 500,000 tons, a substantial majority of which has been used internally by our wire mills, which convert the steel rod into drawn steel wire. This wire is used in the production of many of our products, including mattress innersprings.
A disruption to the operation of, or supply of steel scrap to, our steel rod mill could require us to purchase steel rod from alternative supply sources, subject to market availability. Ongoing trade action by the United States government, along with the existence of antidumping and countervailing duty orders against multiple countries, could result in reduced market availability and/or higher cost of steel rod.
If we experience a disruption to our ability to produce steel rod in our mill, coupled with a reduction of adequate and/or timely supply from alternative market sources of quality steel rod, we could experience a material negative impact on our Bedding Products segment and the Company’s results of operations.
The physical effects of climate change could adversely affect our business, results of operations and financial condition.
Direct Effects
The acute and chronic physical effects of climate change, such as severe weather-related events, natural disasters and/or significant changes in climate patterns could have an increasingly adverse impact on our business and customers. At December 31, 2022, we had 135 manufacturing facilities in 18 countries, primarily located in North America, Europe, and Asia. We serve thousands of customers worldwide. In 2022, our largest customer represented less than 6% of our sales, and our customers were located in approximately 100 countries. Although our diverse geographical manufacturing footprint and our broad geographical customer base mitigates the potential physical risks of any local or regional climate change weather-related event having a material effect on our operations and results, an increased frequency and severity of such weather-related events could pose a risk to our operations and results.
To continue improving our climate-related risk assessment processes, we use technology-based tools to evaluate our property portfolio’s exposure to certain natural catastrophic events. We also initiated integration of climate-related risk into our Enterprise Risk Management (ERM) process providing an opportunity to improve our internal processes for identifying, assessing, and managing climate-related risks. In 2022, we experienced minor damage to two of our operations due to weather-related events. These events did not have a material impact on our physical properties or ability to manufacture and distribute our products to customers in a timely fashion, and did not have a material effect on our business, financial condition, or results of operations. However, in the future, depending on whether severe weather-related events increase in frequency and severity, such events could result in potential damage to our physical assets, local infrastructure, transportation systems, water delivery systems, our customers’ or suppliers’ operations, as well as prolonged disruptions in our manufacturing operations (including but not limited to our steel rod mill), all of which could harm our business, results of operations, and financial condition.
Indirect Effects
The physical effects of climate change could continue to have an adverse impact on our supply chain. In 2020 and 2021, we experienced (due, in part, to severe weather-related impacts) supply shortages in chemicals which restricted foam supply. The restriction of foam supply constrained overall mattress production in the bedding industry and reduced our production levels. The cost of chemicals and foam also increased due to the shortages. Severe weather impacts could also reduce supply of other products in our supply chain that could result in higher prices for our products and the resources needed to produce them. If we are unable to secure an adequate and timely supply of raw materials or products in our supply chain, or the cost of these raw materials or products materially increases, it could have a negative impact on our business, results of operations, and financial condition.
We are engaged in the manufacture of various automotive components, including mechanical and pneumatic lumbar support and massage systems for seating, seat suspension systems, motors and actuators, and cables. For several decades, automotive manufacturers have sought lightweight components designed to increase fuel efficiency in the automobiles they manufacture. Replacing traditional steel components with high-strength steel, magnesium, aluminum alloys, carbon fiber, and polymer composites can directly reduce the weight of a vehicle's body and chassis and therefore reduce a vehicle's fuel consumption. This increased fuel efficiency also indirectly reduces greenhouse gas (GHG) emissions. Because of our technological competitiveness, this long-standing market dynamic has not had, and is not expected to have, a material
negative impact on our share of the markets in which we compete. However, if we are unable to continue to produce comparatively lightweight components, our share in these automotive markets could be negatively impacted.
In addition, although the cost has not been, and is not expected to be, material to our business, results of operations and financial condition, severe weather-related incidents may continue to result in increased costs of our property insurance.
FINANCIAL RISK FACTORS
Macroeconomic uncertainties have had, and could further have, an adverse impact on the collection of trade and other notes receivable in accordance with their terms due to customer bankruptcy, financial difficulties, or insolvency.
Beginning in early 2020, many of our customers and other third parties were adversely affected by the social and governmental restrictions and limitations related to the COVID-19 pandemic. Because of this, we believed the risk of customer nonpayment increased. As such, in the first quarter of 2020, we increased our allowance for doubtful accounts by $20 million, including $9 million associated with a single customer in our Bedding Products segment (fully reserving the balances for this customer). As 2020 progressed, worldwide conditions stabilized, and our bad debt expense finished at $17 million for the year. During 2021, as social and governmental restrictions and limitations were relaxed, trends in customer payment experience and macroeconomic conditions improved and accordingly, we believe the risk of customer nonpayment decreased. Because of these improvements, we reduced our allowance for doubtful accounts by $3 million for 2021. Although favorable customer payment trends continued in 2022, we recorded $3 million bad debt expense during the twelve months ended December 31, 2022, related to macroeconomic uncertainties and ordinary customer credit reviews.
If our customers continue to be adversely affected by macroeconomic uncertainties, they may suffer significant financial difficulty. Macroeconomic uncertainties may include, but are not limited to, rising interest rates, inflation, increased geopolitical tensions, impacts of the COVID-19 pandemic, and political economic policy changes. As a result, our customers may be unable to pay their debts to us, they may reject their contractual obligations to us under bankruptcy laws or otherwise, or we may have to negotiate significant discounts and/or extend financing terms with these parties. If we are unable to collect trade receivables and other notes receivable on a timely basis, larger provisions for bad debt may be required and may result in a negative impact on our earnings, liquidity, cash flow, and financial condition.
Our goodwill and other long-lived assets are subject to potential impairment which could negatively impact our earnings.
A significant portion of our assets consists of goodwill and other long-lived assets, the carrying value of which would be reduced if we determine that those assets are impaired. At December 31, 2022, goodwill and other intangible assets represented $2.1 billion, or 41% of our total assets. In addition, net property, plant, and equipment, operating lease right-of-use assets, and sundry assets totaled $1.1 billion, or 21% of total assets.
We review our reporting units for potential goodwill impairment in the second quarter as part of our annual goodwill impairment testing and more often if an event or circumstance occurs making it likely that impairment exists. In addition, we test for the recoverability of long-lived assets at year end, and more often if an event or circumstance indicates the carrying value may not be recoverable. We conduct impairment testing based on our current business strategy in light of present industry and economic conditions, as well as future expectations.
Our annual goodwill impairment testing performed in the second quarter of 2022 and 2021 indicated no goodwill impairments. However, fair value exceeded carrying value by less than 100% for four reporting units as summarized in the table below:
| | | | | | | | | | | | | | | | | |
| Fair value in excess of carrying value | | Goodwill |
| Goodwill impairment testing as performed in the second quarter 2022 | | Goodwill impairment testing as performed in the second quarter 2021 | | As of December 31, 2022 |
| Bedding | 54 | % | | 171 | % | | $900 | million |
| Work Furniture | 78 | % | | 85 | % | | $98 | million |
| Aerospace | 40 | % | | 28 | % | | $66 | million |
| Hydraulic Cylinders | 32 | % | | 86 | % | | $42 | million |
The Bedding reporting unit’s market value decreased primarily because of lower comparable company multiples and higher discount rates. Although the long-term outlook for the Bedding reporting unit remains strong, macroeconomic
factors also have negatively impacted consumer confidence and spending in the near term, which in turn has had an adverse impact on the bedding market's near-term forecast.
Although the Work Furniture and Aerospace reporting units' long-term forecasts used in the 2022 goodwill impairment testing improved as compared to the 2021 testing, their fair values were adversely impacted by lower comparable company multiples and higher discount rates. Work Furniture's long-term forecasts increased from improving demand in the contract market as companies redesign their office footprints, although demand for products sold for residential has remained soft. Aerospace’s long-term forecasts improved in 2022, as fabricated duct assemblies are at 2019 levels, and demand for welded and seamless tube products is improving modestly but still below pre-pandemic levels. We expect the aerospace industry to return to historical levels in the next few years.
The Hydraulic Cylinders reporting unit had no goodwill associated with it at the time of our annual goodwill impairment testing in both 2022 and 2021, but an August 2022 acquisition added goodwill.
We are continuing to monitor all factors impacting these reporting units. If actual results or the long-term outlook of any of our reporting units materially differ from the assumptions and estimates used in the goodwill valuation calculations, we could incur impairment charges. These non-cash charges could have a material negative impact on our earnings.
For more information regarding goodwill and other long-lived assets, please refer to Note C on page 81 of the Notes to Consolidated Financial Statements. If we do not comply with the restrictive covenants in our credit facility, we may not be able to borrow in the commercial paper market or under our credit facility and our outstanding debt instruments may default, all of which would adversely impact our liquidity.
Our credit facility is a multi-currency facility maturing in September 2026, providing us the ability, from time to time, to borrow, repay, and re-borrow up to $1.2 billion, subject to certain restrictive covenants and customary conditions. The credit facility serves as back-up for our commercial paper borrowing.
Our credit facility contains restrictive covenants. The covenants (a) require us to maintain as of the last day of each fiscal quarter (i) Consolidated Funded Indebtedness minus the lesser of: (A) Unrestricted Cash, or (B) $750 million to (ii) Consolidated EBITDA for the four consecutive trailing quarters, such ratio not being greater than 3.50 to 1.00, provided, however, subject to certain limitations, if the Company has made a Material Acquisition in any fiscal quarter, at the Company’s election, the maximum Leverage Ratio shall be 4.00 to 1.00 for the fiscal quarter during which such Material Acquisition is consummated and the next three consecutive fiscal quarters; (b) limit the amount of total secured obligations to 15% of our total consolidated assets, and (c) limit our ability to sell, lease, transfer or dispose of all or substantially all of the assets of the Company and its subsidiaries, taken as a whole (other than accounts receivable sold in a Permitted Securitization Transaction, products sold in the ordinary course of business and our ability to sell, lease, transfer or dispose of any of the assets of the Company or one of its subsidiaries to the Company or one of its subsidiaries, as applicable) at any given point in time.
If our earnings are reduced, the covenants in the credit facility will reduce our borrowing capacity, both under the credit facility or through commercial paper issuances. Depending on the degree of earnings reduction, our liquidity could be materially negatively impacted. This covenant may also restrict our current and future operations, including (i) our flexibility to plan for, or react to, changes in our businesses and industries; and (ii) our ability to use our cash flows, or obtain additional financing, for future working capital, capital expenditures, acquisitions, or other general corporate purposes. If we are not in compliance with the restrictive covenants in our credit facility, we may not be able to access the commercial paper market or borrow under the credit facility.
Also, if we fail to comply with the covenants specified in the credit facility, we may trigger an event of default, in which case the lenders would have the right to: (i) terminate their commitment to provide loans under the credit facility; and (ii) declare all borrowings outstanding, together with accrued and unpaid interest and fees, to be immediately due and payable. Additionally, our senior notes contain cross-default provisions which could make outstanding amounts under the senior notes immediately payable in the event of an acceleration of amounts due under the credit facility following a material uncured default. If debt under the credit facility or senior notes were to be accelerated, we may not have sufficient cash to repay this debt, which would have an immediate material adverse effect on our business, results of operations, and financial condition.
We may not be able to realize deferred tax assets on our balance sheet depending upon the amount and source of future taxable income.
Our ability to realize deferred tax assets on our balance sheet is dependent upon the amount and source of future taxable income. As of December 31, 2022, we had $105 million of deferred tax assets ($121 million less a $16 million valuation allowance). After netting of deferred tax liabilities, the net amount presented within Sundry assets on our Consolidated Balance Sheets is $8 million. It is possible the amount and source of our taxable income could materially change in the future. Particularly, our mix of earnings by taxing jurisdiction may materially change in that we may have more or less taxable income generated in North America, Europe, or Asia as compared to prior years. This change may impact our underlying assumptions on which valuation allowances are established and negatively affect future period earnings and balance sheets. As a result, we may not be able to realize deferred tax assets on our balance sheet.
MARKET RISK FACTORS
Inflation-impacted raw material and labor costs have negatively affected, and could continue to negatively affect, our profit margins and earnings.
Raw material cost increases impacted by inflationary pressures or otherwise (and our ability to respond to cost increases through selling price increases) can significantly impact our earnings. We typically have short-term commitments from our suppliers; accordingly, our raw material costs generally move with the market. When we experience significant increases in raw material costs, we typically implement price increases to recover the higher costs. Inability to recover cost increases (or a delay in the recovery time) can negatively impact our earnings.
Steel is our principal raw material. The global steel markets are cyclical in nature and have been volatile in recent years. This volatility can result in large swings in pricing and margins from year to year.
As a producer of steel rod, we are also impacted by volatility in metal margins (the difference between the cost of steel scrap and the market price for steel rod). If market conditions cause scrap costs and rod pricing to change at different rates (both in terms of timing and amount), metal margins could be compressed, and this would negatively impact our results of operations.
We have exposure to the cost of chemicals, including TDI, MDI, and polyol. The cost of these chemicals has fluctuated at times, but we have generally passed the changes through to our customers. In 2021, chemical prices inflated due to robust demand and shortages from severe weather, supplier production disruptions, port delays, and logistics challenges. The supply shortages in 2021 resulted in significant restrictions by producers. Late in 2021, chemical prices leveled off as supply availability improved. In 2022, chemical pricing was relatively stable at historically high levels. We import certain chemicals to supplement domestic supply, but port delays and logistics issues could limit access to those products. If we are unable to obtain the chemicals or pass the cost along to our customers, our results of operations may be negatively impacted.
Currently, there is a shortage of semiconductors in the automotive industry. As semiconductor demand elsewhere in the economy has increased over the past few years, automotive OEMs and other suppliers have not been able to secure an adequate supply and as a result have reduced production of some automobile models and/or eliminated certain features (some of which may be added later), which in turn has reduced our sale of products. Consumer demand remains strong, but the semiconductor shortage has caused new vehicle inventories to remain near historically low levels. Our Automotive Group uses the semiconductors in seat comfort products, and to a lesser extent in motors and actuators. Although our Automotive Group has been able to obtain an adequate supply of semiconductors, we are dependent on our suppliers to deliver these semiconductors in accordance with our production schedule. A shortage of the semiconductors, either to us, the automotive OEMs, or our suppliers, can disrupt our operations and our ability to deliver products to our customers. If we, our customers, or our suppliers cannot secure an adequate supply of semiconductors, this may negatively impact our sales, earnings, and financial condition.
Higher raw material costs could lead some of our customers to modify their product designs, causing a change in the quantity and mix of our components in their finished goods (replacing higher-cost with lower-cost components). If this were to occur, it could negatively impact our results of operations.
Shortages in the labor markets in several industries in which we operate have created challenges in hiring and maintaining adequate workforce levels. Because of these shortages, we have experienced increased labor costs. If this continues, our results of operations may be materially negatively impacted.
Unfair competition could adversely affect our market share, sales, profit margins, and earnings.
We produce innersprings for mattresses that are sold to bedding manufacturers. We produce steel wire rod for consumption by our wire mills (primarily to produce innersprings) and to sell to third parties. We also produce and sell finished mattresses.
Since 2009, there have been antidumping duties on the import of innersprings from China, South Africa, and Vietnam imposed by the Department of Commerce (DOC) and International Trade Commission (ITC) extending through 2024. The DOC and ITC have also imposed antidumping duties and countervailing duties on imports of steel wire rod from various countries, including China. Some of these orders are currently under sunset review, and other duties will expire, unless extended, in 2025. Also, antidumping duties have been imposed by the DOC and ITC on the import of finished mattresses from various countries including China, Cambodia, Indonesia, Malaysia, Serbia, Thailand, Turkey, and Vietnam, which will expire, unless extended, at different times ranging from 2024 to 2026. If the existing antidumping and countervailing duties are overturned on appeal, or not extended beyond their current terms and dumping and/or subsidization recurs, or manufacturers in the subject countries circumvent the existing duties through transshipment in other jurisdictions or otherwise, our market share, sales, profit margins, and earnings could be adversely affected.
Our borrowing costs and access to liquidity may be impacted by our credit ratings.
Independent rating agencies evaluate our credit profile on an ongoing basis and have assigned ratings for our long-term and short-term debt. If our credit ratings are lowered below investment grade, we may not be able to access the commercial paper market. If this occurs, we expect to borrow under our credit facility for our liquidity needs but at higher interest costs. If our credit ratings decline below investment grade, our borrowing costs could increase materially, and our access to sources of liquidity, including the commercial paper market, may be adversely affected.
We are exposed to foreign currency exchange rate risk which may negatively impact our competitiveness, profit margins, and earnings.
International sales have represented a significant percentage of our total sales, which exposes us to currency exchange rate fluctuations. In 2022, 35% of our sales were generated by international operations, primarily in Europe, China, Canada, and Mexico. We expect that a significant amount of our sales will continue to come from outside the United States in the future. Approximately 50 of our manufacturing facilities are located outside the United States. We are also exposed to currency exchange rate fluctuations by our purchase of raw materials and component parts from suppliers in multiple countries. We experience currency-related gains and losses where sales or purchases are denominated in currencies other than the functional currency. As of December 31, 2022, we had foreign exchange rate risk associated with the U.S. Dollar, Euro, Chinese Yuan, Mexican Peso, Danish Krone, British Pound Sterling, and Canadian Dollar. If these exchange rates devalue the currency we receive for the sale of our products, or the currency we use to purchase raw materials or component parts from our suppliers, it may have a material adverse effect on our competitiveness, profit margins, and earnings.
For more information regarding currency exchange rate risk, please refer to Note S on page 111 of the Notes to Consolidated Financial Statements. TECHNOLOGY AND CYBERSECURITY RISK FACTORS
Technology failures or cybersecurity breaches could have a material adverse effect on our operations.
We have 135 production facilities in 18 different countries, primarily located in North America, Europe, and Asia. We rely on several on-premise and cloud-based computerized systems and networks to obtain, secure, process, analyze, and manage data, as well as to facilitate the manufacture and distribution of inventory to and from our production facilities. We receive, process, manufacture, and ship orders, manage the billing of and collections from our customers, and manage the accounting for and payments to our vendors. We manage our production processes with certain industrial control systems. We also have risk associated with the network connectivity and systems for consolidated reporting. Technology failures or security breaches of a new or existing infrastructure, including our industrial control systems, could impede normal operations, create system disruptions, or create unauthorized disclosure or alteration of confidential information.
We have a formal process in place for both incident response and cybersecurity continuous improvement that includes a cross-functional Cybersecurity Oversight Committee. Members of the Cybersecurity Oversight Committee update the Board of Directors quarterly on cybersecurity activity, with procedures in place for interim reporting, if necessary. Our cybersecurity program, led by our Chief Information Security Officer, is based on industry recognized
frameworks and takes a multifaceted approach to protecting our network, systems, and data, including personal information. We deploy a wide range of protective security technologies and tools including but not limited to encryption, firewalls, endpoint detection and response, security information and event management, multi-factor authentication, and threat intelligence feeds. In addition, we use an information security risk management approach that includes monitoring security threats and trends in the industry, analyzing potential security risks that could impact the business, partnering with industry recognized security organizations, and coordinating an appropriate response should the need arise.
Although we have not experienced any material technology failures or cybersecurity breaches, we have enhanced our cybersecurity protection efforts over the last few years and continue to do so. We use a third party to periodically benchmark our information security program against the National Institute of Standards and Technology’s Cybersecurity Framework. We provide quarterly cybersecurity training for employees with access to our email and data systems, and we have purchased broad form cyber insurance coverage. Although we believe that our cybersecurity protection systems are adequate, cybersecurity risk has increased due to increased remote access, remote work conditions, and associated strain on employees. As such, technology failures or cybersecurity breaches could still create system disruptions or unauthorized disclosure or alteration of confidential information. We cannot be certain that the attacker’s capabilities will not compromise our technology protecting information systems, including those resulting from ransomware attached to our industrial control systems. If this occurs, our operations could be disrupted, or we may suffer financial loss because of lost or misappropriated information. Also, we may incur remediation costs, increased cybersecurity protection costs, lost revenues resulting from unauthorized use of proprietary information, litigation and legal costs, increased insurance premiums, reputational damages, proprietary and confidentiality impacts, damage to our competitiveness, and negative impact on our stock price and long-term shareholder value.
TRADE RISK FACTORS
Tariffs by the United States government could result in materially lower margins, lost sales, and an overall adverse effect on our results of operations.
While we frequently manufacture products where our customers are located, we do, in some cases, import and export various raw materials, components, or finished goods across several business units, including the Automotive and Bedding groups. The United States has imposed broad-ranging tariffs on steel and aluminum (each of which we use in our manufacturing processes), a wide assortment of Chinese-made products, and other products on a country-specific basis. In retaliation, many other countries have imposed counter-tariffs on U.S.-produced items. If we are unable to pass through additional costs created by current or new tariffs, it could result in materially lower margins, lost sales, and an overall adverse effect on our results of operations.
The United Kingdom's withdrawal from the European Union could adversely affect us.
In June 2016, the United Kingdom (UK) held a referendum in which voters approved an exit from the European Union (EU), commonly referred to as “Brexit.” In January 2020, the Withdrawal Agreement Act was passed by the UK Parliament and the Brexit deal was ratified by the EU Parliament. This allowed the UK to formally leave the EU on January 31, 2020, with a transition period through December 31, 2020, while the EU and UK were to negotiate a trade agreement, among other things. Additional negotiations among the EU and UK continue, as well as negotiations of trade agreements between the UK and other countries, including the United States. Because we have multiple manufacturing facilities in the UK, EU, and other countries, and these facilities purchase raw materials and component parts from suppliers in those countries, and sell products into the UK, EU, and elsewhere, the results of Brexit (and particularly the continued negotiation of trade agreements) could cause disruptions and create uncertainty to our supply chain and distribution networks, tariff rates, and currencies, and could fluctuate the value of the British Pound Sterling and the Euro relative to the U.S. Dollar and other currencies. These disruptions and uncertainties could increase our costs and adversely affect us.
U.S. export controls against China could exacerbate the global semiconductor shortage and negatively impact (i) our ability to manufacture and timely deliver our products, (ii) our OEM and Tier customers’ production schedules, and (iii) the demand for our products.
Our Automotive Group uses semiconductors in seat comfort products, and to a lesser extent in motors and actuators. According to certain market reports, China is a leading manufacturer of the world’s semiconductors. The U.S. government has imposed export controls regarding certain semiconductor chips and semiconductor manufacturing equipment which restrict U.S. companies’ ability to export these products to China without a license. The new controls may exacerbate the global semiconductor shortage and negatively impact our ability to source an adequate supply of semiconductors used in
our manufacturing processes. If so, the resulting shortage could endanger our ability to manufacture and timely deliver our products. It also could negatively impact our OEM and Tier customers’ production schedules and the demand for our products. Additionally, China may adopt retaliatory trade restrictions against U.S. companies. If this occurs, our Chinese-based operations may be negatively impacted. Any of these risks, if realized, could negatively impact our business, results of operations and financial condition.
REGULATORY RISK FACTORS
The timing and amount of our share repurchases is subject to a number of uncertainties.
The Board has established a program authorizing management to repurchase up to 10 million shares each calendar year, with no specific commitment or timetable. The Inflation Reduction Act of 2022 imposes a non-deductible 1% excise tax on net repurchases of shares, with some exceptions. The excise tax will be imposed on transactions that occur after December 31, 2022. The imposition of the excise tax will increase the cost to us of making repurchases and may cause the Company to reduce the number of shares repurchased.
Other factors that may influence our decision to utilize, limit, suspend, or delay future share repurchases include market conditions, the trading price of our common stock, the nature and magnitude of other investment opportunities available to us from time to time, and the amount of available cash.
Privacy and data protection regulations are complex and could harm our business, reputation, financial condition, and operating results.
Governments around the world have adopted legislative and regulatory proposals concerning the collection and use of personal data. As a multi-national company with employee personal data and business contact information from individuals in many countries, we are subject to many different data protection laws, including those in the U.S., and the laws of other jurisdictions in which we operate, such as those in Europe, China, and Brazil. For example, the EU’s General Data Protection Regulation (GDPR) and UK GDPR applies to our operations that collect or process personal data of EU individuals and UK individuals, respectively. If our operations are found to violate GDPR or the UK GDPR, we may incur substantial fines, face reputational harm, and be required to change our business practices, any of which could have an adverse effect on our business.
As a U.S. company, the ability to centrally manage aspects of our operation and workforce and the ability to make decisions based on complete and accurate global data are important and require the ability to transfer and access personal data. The adequacy of the laws of the data-importing country are of increasing importance under various laws, including the GDPR, the UK GDPR, and Brazil’s general data protection law. The validity of data transfer mechanisms remains subject to legal, regulatory, and political developments in many countries, including Brazil, Europe, China, and the U.S. The invalidation of the EU-U.S. Privacy Shield in 2020, the complex assessment and documentation requirements required under the EU Commission's recent Standard Contractual Clauses, as well as the still evolving guidance from Brazil and China, could have an adverse impact on our ability to process and transfer personal data. This may inhibit our ability to transfer our employee personal data from our other operations, such as in Europe, China, and Brazil, to the Company’s headquarters in the U.S. or elsewhere, making it much more difficult to effectively manage our global human capital. These evolving privacy and data protection requirements create uncertainty and added compliance obligations that could harm our business, reputation, financial condition, and operating results.
Climate change transition risks, including new treaties, laws and regulations, could negatively impact our business, capital expenditures, compliance costs, results of operations, financial condition, competitive position, and reputation.
Many scientists, legislators, and others attribute global warming to increased levels of GHG emissions, including carbon dioxide. As of December 31, 2022, we had 135 manufacturing facilities in 18 countries. Most of our facilities are engaged in manufacturing processes that produce GHG, including carbon dioxide. We also maintain a fleet of over-the-road tractor trailers that emit GHG when providing freight services to many of our U.S.-based manufacturing locations. Our manufacturing facilities are primarily located in North America, Europe, and Asia. There are certain transition risks (meaning risks related to the process of reducing the Company’s carbon footprint) that could materially affect our business, capital expenditures, results of operations, financial condition, competitive position, and reputation. One of these transition risks is the change in treaties, laws, policies, and regulations that could impose significant operational and compliance burdens. For example, our operations are subject to certain governmental actions like the European Union’s (EU) “European Green Deal” (which provides for a 55% reduction in net GHG emissions by 2030 (compared to 1990 levels), and no net emissions of GHG by 2050), and the “Paris Agreement” (which is an international treaty on climate change designed to lower GHG emissions). In addition, specifically with respect to our Automotive Group, the EU is moving
forward with an effective ban on the sale of new gas-powered automobiles in the EU from 2035 (with interim requirements by 2030), aiming to accelerate the conversion to zero-GHG emission automobiles as part of a broad package to combat global warming. Some states, including California and New York, are also implementing similar provisions. The Company’s automotive products can be sold to manufacturers of either gas-powered or electric-powered vehicles. However, if our customers (who may be subject to any of these or other similarly proposed or newly enacted laws and regulations) incur additional costs to comply with such laws and regulations, which in turn, impact their ability to operate at similar levels in certain jurisdictions, the demand for our products could be adversely affected. Also, overall, there continues to be a lack of consistent climate legislation in the jurisdictions in which we operate, which creates economic and regulatory uncertainty. If these laws or regulations (including the SEC's proposed rule regarding climate-related disclosures) impose significant operational restrictions and compliance requirements on us, they could increase costs associated with our operations, including costs for raw materials and transportation. Non-compliance with climate change treaties, or legislative and regulatory requirements could also negatively impact our reputation. To date, however, we have not experienced a material impact from climate change legislative and regulatory efforts.
Increased scrutiny from investors, lenders, market participants, and other stakeholders regarding our environmental, social, and governance, or sustainability responsibilities, could expose us to additional costs or risks and adversely impact our liquidity, results of operations, reputation, employee retention, and stock price.
Investor advocacy groups, certain institutional investors, investment funds, lenders, market participants, shareholders, customers, and other stakeholders have focused increasingly on the environmental, social, and governance (ESG) or “sustainability” practices of companies. These parties have placed increased importance on the implications of the social cost of their investments. If our ESG practices do not meet investor, lender, or other industry stakeholder expectations and standards, which continue to evolve, our access to capital may be negatively impacted based on an assessment of our ESG practices. These limitations, in both the debt and equity markets, may materially negatively affect our ability to manage our liquidity, our ability to refinance existing debt, grow our businesses, implement our strategies, our results of operations, and the price of our common stock.
Our sustainability report details how we seek to manage our operations responsibly and ethically. The sustainability report includes our ESG policies and practices on a variety of matters, including, but not limited to, Board and management sustainability oversight, governance and ethics, environmental compliance, climate change, employee health and safety practices, human capital management, product sustainability and stewardship, supply chain management, and workforce inclusion and diversity. In the past few years, we broadened the scope of the Board’s Nominating, Governance and Sustainability Committee to include oversight of our ESG programs and related risks. We also added positions, including our first Chief Human Resources Officer, ID&E Director, and Sustainability Manager to help lead and evaluate our ESG practices. Also, in 2022, we conducted our first materiality assessment to identify ESG-related opportunities that will drive the most value for our company and those we serve. We engaged a broad variety of our stakeholders to get their input on which ESG topics were of the highest importance to them. We also assessed our ability to make a positive business impact in these same ESG areas. Together, this information is helping to better inform us as we prioritize and advance our ESG strategies. We expect to share the results of the materiality assessment and key ESG objectives, goals, and targets later in 2023 or in the first half of 2024. However, it is possible that stakeholders may not be satisfied with our ESG practices or the speed of their adoption. In addition to the costs associated with the above mentioned positions, we could also incur additional costs and require additional resources to monitor, report, and comply with various ESG practices. Also, our failure, or perceived failure, to meet the standards set forth in the sustainability report could negatively impact our reputation, employee retention, and the willingness of our customers and suppliers to do business with us. Our sustainability report can be found at www.leggett.com. Our website does not constitute part of this Form 10-K.
Changes in tax laws or challenges to our tax positions pursuant to ongoing tax audits could negatively impact our earnings and cash flows.
We are subject to the tax laws and reporting rules of the U.S. (federal, state, and local) and several foreign jurisdictions. Current economic and political conditions make these tax rules (and governmental interpretation of these rules) in any jurisdiction, including the U.S., subject to significant change and uncertainty. There have been proposals by the Organization for Economic Cooperation and Development, the European Union, and other jurisdictions to reform tax laws or change interpretations of existing tax rules. These proposals, if adopted, could impact how our earnings and transactions are taxed as a multinational corporation. Although we cannot predict whether or in what form these proposals
will become law, or how they might be interpreted, such changes could impact our assumptions related to the taxation of certain foreign earnings and have an adverse effect on our earnings and cash flows.
We are subject to audit by taxing authorities in the countries where we operate and are currently in various stages of examination in several of these jurisdictions. We have established liabilities as we believe are appropriate, with such amounts representing what we believe is a reasonable provision for taxes that we ultimately might be required to pay. However, these liabilities could be increased over time as more information becomes known relative to the resolution of these audits, as either certain governmental tax positions may be sustained or we may agree to certain tax adjustments. We could incur additional tax expense if we have adjustments higher than the liabilities recorded.
LITIGATION RISK FACTORS
We are exposed to litigation contingencies that, if realized, could have a material negative impact on our financial condition, results of operations, and cash flows.
Although we deny liability in all currently threatened or pending litigation proceedings and believe that we have valid bases to contest all claims made against us, we have recorded an immaterial aggregate litigation contingency accrual at December 31, 2022. Based on current facts and circumstances, aggregate reasonably possible (but not probable) losses in excess of the recorded accruals for litigation contingencies are estimated to be $11 million. If our assumptions or analyses regarding any of our contingencies are incorrect, or if facts and circumstances change, we could realize loss in excess of the recorded accruals (and in excess of the $11 million referenced above) which could have a material negative impact on our financial condition, results of operations, and cash flows. For more information regarding our legal contingencies, please see Note T on page 111 of the Notes to Consolidated Financial Statements. Item 1B. Unresolved Staff Comments.
None.
Item 2. Properties.
The Company’s corporate office is located in Carthage, Missouri. As of December 31, 2022, we had 135 manufacturing locations in 18 countries, of which 84 were located across the United States and 51 were located in foreign countries. We also had various sales, warehouse, and administrative facilities. However, our manufacturing plants are our most important properties.
Manufacturing Locations by Segment
| | | | | | | | | | | | | | | | | | | | | | | | | | |
| | Company- Wide | | Subtotals by Segment |
Manufacturing Locations | | Bedding Products | | Specialized Products | | Furniture, Flooring & Textile Products |
| United States | | 84 | | 35 | | 6 | | 43 |
| Europe | | 18 | | 6 | | 10 | | 2 |
| China | | 15 | | 2 | | 11 | | 2 |
| Canada | | 8 | | — | | 3 | | 5 |
| Mexico | | 6 | | 3 | | 2 | | 1 |
| Other | | 4 | | 1 | | 3 | | — |
| Total | | 135 | | 47 | | 35 | | 53 |
For more information regarding the geographic location of our manufacturing facilities refer to Geographic Areas of Operation under Item 1 Business on page 10.
Manufacturing Locations Owned or Leased by Segment
| | | | | | | | | | | | | | | | | | | | | | | | | | |
| | Company- Wide | | Subtotals by Segment |
Manufacturing Locations | | Bedding Products | | Specialized Products | | Furniture, Flooring & Textile Products |
| Owned | | 69 | | 34 | | 13 | | 22 |
| Leased | | 66 | | 13 | | 22 | | 31 |
| Total | | 135 | | 47 | | 35 | | 53 |
We lease many of our manufacturing, warehouse, and other facilities on terms that vary by lease (including purchase options, renewals, and maintenance costs). For additional information regarding lease obligations, see Note K on page 93 of the Notes to Consolidated Financial Statements. We do not have any manufacturing facilities that are subject to liens or encumbrances that are material to the segment in which they are reported or to the Company as a whole. No individual physical property is material to the Company’s overall manufacturing processes, except for our steel rod mill in Sterling, Illinois, which is reported in our Bedding Products segment. The rod mill consists of approximately 1 million square feet of owned production space. It has annual output capacity of approximately 500,000 tons of steel rod, of which a substantial majority is used by our own wire mills. Our wire mills convert the steel rod into drawn steel wire. This wire is used in the production of many of our products, including mattress innersprings. A disruption to the operation of, or supply of steel scrap to, our steel rod mill could require us to purchase steel rod from alternative supply sources, subject to market availability. Trade actions by the United States government, along with the existence of antidumping and countervailing duty orders against multiple countries, could result in reduced market availability and/or an increase in the cost of steel rod. If we experience a disruption in our ability to produce steel rod in our mill, for whatever reason, coupled with a reduction of adequate and/or timely supply from alternative market sources of quality steel rod, we could experience a material negative impact on our Bedding Products segment’s and the Company’s results of operations.
We believe that the Company’s owned and leased facilities are suitable and adequate for the manufacture, assembly and distribution of our products. Our properties are located to allow timely and efficient delivery of products and services to our diverse customer base. In 2022, most of our manufacturing facilities operated at less than full capacity utilization rates. As such, we have excess production capacity in most of our businesses.
Item 3. Legal Proceedings.
Reference is made to the information in Note T on page 111 of the Notes to Consolidated Financial Statements, which is incorporated into this section by reference. Mattress Antidumping Matters
On March 31, 2020, the Company, along with six other domestic mattress producers, Brooklyn Bedding, Corsicana Mattress Company, Elite Comfort Solutions (a Leggett subsidiary), FXI, Inc., Innocor, Inc., and Kolcraft Enterprises, Inc., and two unions, the International Brotherhood of Teamsters and the United Steel, Paper and Forestry, Rubber, Manufacturing, Energy, Allied Industrial and Service Workers International Union, AFL-CIO (collectively, “Petitioners”), filed petitions with the U.S. Department of Commerce (DOC) and the U.S. International Trade Commission (ITC) alleging that manufacturers of mattresses in Cambodia, Indonesia, Malaysia, Serbia, Thailand, Turkey, and Vietnam were unfairly selling their products in the United States at less than fair value (dumping) and manufacturers of mattresses in China were unfairly benefiting from subsidies, causing harm to the U.S. industry and seeking the imposition of duties on mattresses imported from these countries. On March 18, 2021, the DOC made final determinations on Chinese subsidies, assigning a duty rate of 97.78%, and on dumping, assigning duty rates on imports from Cambodia (52.41%, as amended), Indonesia (2.22%), Malaysia (42.92%), Serbia (112.11%), Thailand (37.48% – 763.28%), Turkey (20.03%), and Vietnam (144.92% - 668.38%). On April 21, 2021, the ITC made a unanimous, affirmative final determination that domestic mattress producers were materially injured by reason of the unfairly priced or subsidized imported mattresses. Accordingly, the agencies instructed that the U.S. government continue to impose duties on mattresses imported from China, Cambodia, Indonesia, Malaysia, Serbia, Thailand, Turkey, and Vietnam at the rate determined by the DOC for five years, through May 2026, at which time the DOC and ITC will conduct a sunset review to determine whether to extend the order for an additional five years. In July 2021, respondents filed appeals with the U.S. Court of International Trade (CIT) as to the DOC’s final determinations on antidumping duty rates for Cambodia, Indonesia, and Vietnam and the ITC’s unanimous, final
determination of material injury to the domestic industry. Petitioners separately appealed the DOC’s final determinations on antidumping duty rates for Cambodia, Indonesia, and Thailand. On November 28, 2022, the CIT issued a ruling on the appeal of the DOC's final determination as to the rates for Vietnam, siding with the DOC and the Petitioners as to the basis for certain calculations, but also ordering a partial remand to the DOC to explain the use of certain financial data in making that determination.
Item 4. Mine Safety Disclosures.
Not applicable.
Supplemental Item. Information About Our Executive Officers.
The following information is included in accordance with the provisions of Part III, Item 10 of Form 10-K, Item 401(b) of Regulation S-K, and the Instruction to Item 401 of Regulation S-K.
The table below sets forth the names, ages and positions of persons appointed as executive officers of the Company. Executive officers are normally appointed annually by the Board of Directors.
| | | | | | | | | | | | | | |
| Name | | Age | | Position |
| J. Mitchell Dolloff | | 57 | | President and Chief Executive Officer |
| Karl G. Glassman | | 64 | | Executive Chairman of the Board |
| Jeffrey L. Tate | | 53 | | Executive Vice President and Chief Financial Officer |
| Benjamin M. Burns | | 45 | | Executive Vice President—Business Support Services |
| J. Tyson Hagale | | 45 | | Executive Vice President, President—Bedding Products |
| Steven K. Henderson | | 62 | | Executive Vice President, President—Specialized Products and Furniture, Flooring & Textile Products |
| Christina Ptasinski | | 63 | | Executive Vice President—Chief Human Resources Officer |
| Scott S. Douglas | | 63 | | Senior Vice President—General Counsel & Secretary |
| Susan R. McCoy | | 58 | | Senior Vice President—Investor Relations |
| | | | |
| Tammy M. Trent | | 56 | | Senior Vice President—Chief Accounting Officer |
Subject to certain severance benefit agreements, the executive officers generally serve at the pleasure of the Board of Directors. The severance benefit agreements with Messrs. Dolloff, Glassman, Tate, Hagale, Henderson, and Douglas are listed as exhibits to this report. Please see Exhibit Index on page 114 for reference to the agreements. J. Mitchell Dolloff was appointed the Company’s Chief Executive Officer, effective January 1, 2022, and continues to serve as President since his appointment in 2020. He previously served as Chief Operating Officer from 2019 until his appointment as CEO, President—Bedding Products from 2020 to 2021, Executive Vice President, President—Specialized Products and Furniture Products from 2017 to 2019, Senior Vice President and President of Specialized Products from 2016 to 2017, Vice President and President of the Automotive Group from 2014 to 2015, President of Automotive Asia from 2011 to 2013, Vice President of Specialized Products from 2009 to 2013, and in various other capacities for the Company since 2000.
Karl G. Glassman was appointed Executive Chairman of the Board effective January 1, 2022, following his retirement as the Company’s Chief Executive Officer on December 31, 2021, a position he held since 2016. Mr. Glassman was first appointed Chairman of the Board in 2020. He previously served as President from 2013 to 2019, Chief Operating Officer from 2006 to 2015, Executive Vice President from 2002 to 2013, President of the former Residential Furnishings Segment from 1999 to 2006, Senior Vice President from 1999 to 2002, and in various capacities since 1982. Mr. Glassman has announced his decision to retire as an executive officer of the Company, effective as of the Company's annual meeting of shareholders, which is expected to be held on May 4, 2023.
Jeffrey L. Tate was appointed Executive Vice President and Chief Financial Officer of the Company in 2019. He previously served as Vice President and Business CFO of the Packaging & Specialty Plastics Operating Segment of The Dow Chemical Company since 2017. He served The Dow Chemical Company as Chief Audit Executive from 2012 to 2017, as Division CFO of Performance Products from 2009 to 2012, and Director, Investor Relations from 2006 to 2009. Mr. Tate served Dow Automotive as Global Finance Director from 2003 to 2006, and he served The Dow Chemical Company as Global Finance Manager, Polyurethane Systems from 2000 to 2003 and in various controller and financial analyst positions from 1992 to 2000.
Benjamin M. Burns was appointed Executive Vice President—Business Support Services on February 22, 2023. He previously served the Company as Senior Vice President—Business Support Services since 2022, Vice President, Business Support Services from 2019 to 2022, Vice President, Treasurer from 2017 to 2019 and Vice President, Internal Audit/Due Diligence from 2012 to 2017. Mr. Burns served the Company in various other auditing capacities since 2003.
J. Tyson Hagale was appointed Executive Vice President, President—Bedding Products on February 22, 2023. He previously served the Company as Senior Vice President, President—Bedding Products since 2021, Commercial Vice President for Domestic Bedding since 2020, President of the Home Furniture Group in 2020, President of the Furniture Hardware Division from 2018 to 2020, Director of Market Plan Development from 2015 to 2018, and Business Development Director from 2011 to 2015. He joined Leggett in 2001 as a member of the Corporate Development Department, and served in a variety of financial and strategic roles during his first ten years with the Company.
Steven K. Henderson was appointed Executive Vice President, President—Specialized Products and Furniture, Flooring & Textile Products in 2020. Mr. Henderson previously served the Company as Vice President, President—Automotive Group since 2017. He joined the Company after more than 30 years of experience in a variety of leadership positions at Dow Automotive Systems and served as Business President—Automotive Systems since 2009, where he was responsible for the global business, including profit and loss, business strategy, and organizational health.
Christina Ptasinski was appointed Executive Vice President—Chief Human Resources Officer on February 22, 2023. She previously served the Company as Senior Vice President—Chief Human Resources Officer since 2021. She joined the Company with over 20 years of human resources leadership experience. She most recently served, from 2019 to 2021, as Senior Vice President HR for CEVA Logistics, where she previously served as Head of Global HR Performance from 2018 to 2019. CEVA Logistics is a global logistics and supply chain company in both freight management and contract logistics operating in many countries with thousands of employees. Prior to that, Ms. Ptasinski was the Chief Human Resources Officer for Crane Worldwide Logistics from 2008 to 2018. Crane Worldwide Logistics is a logistics and supply chain company providing customized supply chain solutions, intermodal transportation and warehousing with over 100 locations in several countries.
Scott S. Douglas was appointed Senior Vice President and General Counsel in 2011. He was appointed Secretary of the Company in 2016. He previously served as Vice President and General Counsel from 2010 to 2011, as Vice President—Law and Deputy General Counsel from 2008 to 2010, as Associate General Counsel—Mergers & Acquisitions from 2001 to 2007, and as Assistant General Counsel from 1991 to 2001. He has served the Company in various legal capacities since 1987.
Susan R. McCoy was appointed Senior Vice President—Investor Relations in 2019. She previously served as Vice President, Investor Relations from 2014 to 2019, Staff Vice President, Investor Relations from 2011 to 2014, and Director of Investor Relations from 2002 to 2011. She also served as Due Diligence Manager from 1999 to 2002, Manager of Financial Reporting in 1999 and in various financial capacities since 1986.
Tammy M. Trent was appointed Senior Vice President in 2017 and has served as Chief Accounting Officer since 2015. She previously served as Vice President from 2015 to 2017, and Staff Vice President, Financial Reporting from 2007 to 2015. She has served the Company in various financial capacities since 1998.
PART II
Item 5. Market for Registrant’s Common Equity, Related Stockholder Matters and Issuer Purchases of Equity Securities.
Market Information
Our common stock is traded on the New York Stock Exchange (symbol LEG).
Shareholders and Dividends
As of February 13, 2023, we had 5,800 shareholders of record.
Increasing the dividend remains a high priority. In 2022, we increased the annual dividend by $.08 from $1.66 to $1.74 per share. We have no restrictions that materially limit our ability to pay such dividends or that we reasonably believe are likely to limit the future payment of dividends. Future dividends will be determined based on our earnings, capital requirements, financial condition, and other factors considered by our Board of Directors. However, our current expectation is to continue paying cash dividends on our common stock at the same or higher rate.
For more information on dividends see Dividends in Item 7, Management’s Discussion and Analysis of Financial Condition and Results of Operations on page 47. Issuer Purchases of Equity Securities
As seen by the below table, neither us nor any affiliated purchaser purchased any shares of our common stock during any calendar month in the fourth quarter of 2022.
| | | | | | | | | | | | | | | | | | | | | | | | | | |
| Period | | Total Number of Shares Purchased 1 | | Average
Price
Paid per
Share | | Total Number of Shares Purchased as Part of Publicly Announced Plans or Programs 2 | | Maximum Number of Shares that May Yet Be Purchased Under the Plans or Programs 2 |
| October 2022 | | — | | | $ | — | | | — | | | 8,505,824 | |
| November 2022 | | — | | | $ | — | | | — | | | 8,505,824 | |
| December 2022 | | — | | | $ | — | | | — | | | 8,505,824 | |
| Total | | — | | | $ | — | | | — | | | |
1 This column does not include shares withheld for taxes on stock unit conversions, as well as forfeitures of stock units, all of which totaled 978 shares in the fourth quarter of 2022.
2 On August 4, 2004, the Board authorized management to repurchase up to 10 million shares each calendar year beginning January 1, 2005. This standing authorization was first reported in the quarterly report on Form 10-Q for the period ended June 30, 2004, filed August 5, 2004, and remained in force until repealed by the Board of Directors. On February 22, 2022, the Board repealed the August 4, 2004 resolution but re-adopted resolutions with minor administrative changes providing for the same authority, which will remain in force until repealed by the Board. As such, effective January 1, 2022, the Company was authorized by the Board of Directors to repurchase up to 10 million shares in 2022, and each calendar year thereafter. No specific repurchase schedule has been established.
Stock Performance Graph
The following graph and table below show the cumulative total shareholder return for five years for the Company’s common stock (LEG), the S&P Midcap 400® index and our Peer Group index. The comparison assumes that $100 was invested on December 31, 2017 in shares of LEG and in each of the indices, and assumes that all of the dividends were reinvested. We measure the Company’s relative performance against the S&P Midcap 400® index, of which the Company is included. The Company has selected a Peer Group of manufacturing companies that, though involved in different industries, resemble the Company in diversification, strategy, growth objectives, acquisitiveness, customer breadth, and geographic extent. Our Peer Group includes: Carlisle Companies Incorporated (CSL), Danaher Corporation (DHR), Dover Corporation (DOV), Eaton Corporation plc (ETN), Emerson Electric Co. (EMR), Illinois Tool Works Inc. (ITW), Ingersoll Rand Inc. (IR), Masco Corporation (MAS), Pentair plc (PNR) and PPG Industries, Inc. (PPG).
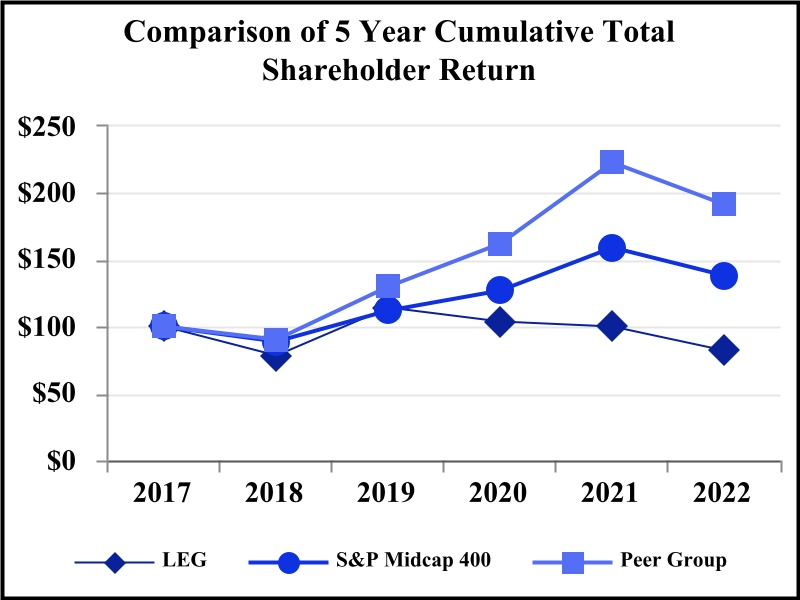
| | | | | | | | | | | | | | | | | | | | | | | | | | | | | | | | | | | |
| For the Years Ended |
| 2017 | | 2018 | | 2019 | | 2020 | | 2021 | | 2022 |
| LEG | $ | 100 | | | $ | 78 | | | $ | 114 | | | $ | 104 | | | $ | 100 | | | $ | 82 | |
| S&P Midcap 400 | 100 | | | 89 | | | 112 | | | 127 | | | 159 | | | 138 | |
| Peer Group | 100 | | | 90 | | | 130 | | | 162 | | | 223 | | | 191 | |
This Stock Performance Graph section does not constitute soliciting material, is not deemed filed with the Securities and Exchange Commission, is not subject to Regulation 14A or 14C of the Securities Exchange Act, as amended (the “Exchange Act”), and is not subject to the liabilities of Section 18 of the Exchange Act. Also, it is not incorporated by reference in any of our filings under the Securities Act of 1933 or the Exchange Act, whether made before or after the date of this Form 10-K and irrespective of any general incorporation language in any such filing, except to the extent we specifically incorporate this Stock Performance Graph section by reference therein.
Item 6. Reserved.
Item 7. Management’s Discussion and Analysis of Financial Condition and Results of Operations.
HIGHLIGHTS
| | | | | | | | | | | | | | | | | | | | | |
| 2022 | | 2021 | | 2020 | | | | |
| (Dollar amounts in millions, except for per share data) | | | | | | | | | |
| Net trade sales | $ | 5,147 | | | $ | 5,073 | | | $ | 4,280 | | | | | |
| Earnings before interest and taxes (EBIT) | 485 | | | 596 | | | 408 | | | | | |
| | | | | | | | | |
| Cash from operations | 441 | | | 271 | | | 603 | | | | | |
| | | | | | | | | |
| Total debt | 2,084 | | | 2,090 | | | 1,900 | | | | | |
| Dividends per share | $ | 1.74 | | | $ | 1.66 | | | $ | 1.60 | | | | | |
Trade sales increased 1% in 2022. Organic sales were flat, with volume declines of 7% and currency impact of 2% offset by raw material-related price increases of 9%. Acquisitions, net of divestitures, added 1% to sales growth. 2021 trade sales increased 19%, primarily from raw material-related selling price increases and volume recovery from pandemic-related sales declines in the first half of 2020.
Earnings in 2022 decreased primarily from lower trade sales volume, lower overhead absorption from reduced production, operational inefficiencies in Specialty Foam, higher raw material and transportation costs and operational inefficiencies in Automotive, and the non-recurrence of a prior year gain on the sale of real estate associated with our exited Fashion Bed business. These decreases were partially offset by metal margin expansion in our Steel Rod business and pricing discipline in the Furniture, Flooring & Textile Products segment. Earnings in 2021 benefited primarily from volume recovery from pandemic-related declines, metal margin expansion, pricing discipline, a gain on the sale of real estate associated with our exited Fashion Bed business, and the non-recurrence of a goodwill impairment charge.
In 2022, we generated $441 million in cash from operations compared to $271 million in 2021. This large increase was primarily driven by a much smaller use of cash for working capital, partially offset by lower earnings. Working capital increased significantly in 2021 due to restocking efforts following inventory depletion in 2020 but increased to a much lesser extent in 2022 as we returned to inventory levels more reflective of current demand. This improvement was partially offset by a decrease in accounts payable as purchases slowed due to lower volume and our efforts to reduce inventory levels. Total capital expenditures in 2022 were $100 million, reflecting a balance of investing for the future while controlling our spending. Cash from operations in 2020 benefited from a sharp focus on working capital management.
In August, we used our commercial paper program to repay $300 million of 3.4%, 10-year bonds that matured. We ended 2022 with $717 million of availability under the $1.2 billion credit facility. We amended our revolving credit agreement in September 2021 to change our financial covenant to a 3.5x net debt to trailing 12-month EBITDA metric (from what would have been 3.25x net debt at year end). This change created more financial flexibility under our revolving credit facility, which serves as back-up for our commercial paper program. In November 2021, we issued $500 million of 30-year, 3.5% notes. Our financial base remains strong.
We increased the annual dividend in 2022 to $1.74 per share from $1.66 per share in 2021 and extended our record of consecutive annual increases to 51 years. With the deleveraging we accomplished over the past few years, share
repurchases returned as one of our uses of cash in 2022. For the full year, we used $60 million to repurchase approximately 1.7 million shares of our stock at an average price of $35.94.
Portfolio management remains a strategic priority. Over the past several years, we have enhanced our business portfolio by executing on our strategy of pursuing profitable growth and exiting or restructuring businesses that consistently struggled to deliver acceptable returns. In 2022, we acquired four businesses: a global manufacturer of hydraulic cylinders for heavy construction equipment with operations in Germany, China, and the U.S.; a small textiles business that converts and distributes construction fabrics for the furniture and bedding industries; and two Canadian-based distributors of products used for erosion control, stormwater management, and various other applications. We also divested a small South African innerspring operation in our International Bedding business. In 2021, we acquired three businesses: a United Kingdom manufacturer specializing in metallic ducting systems, flexible joints, and components for space, military, and commercial applications; a Polish manufacturer of bent metal tubing for furniture used in office, residential, and other settings; and a specialty foam and finished mattress manufacturer serving the United Kingdom and Irish market. We also divested a small specialty wire operation in our Drawn Wire business.
These topics are discussed in more detail in the sections that follow. INTRODUCTION
Total Shareholder Return
Total Shareholder Return (TSR), relative to peer companies, is a primary financial measure that we use to assess long-term performance. TSR = (Change in Stock Price + Dividends) / Beginning Stock Price. We target average annual TSR of 11-14% through an approach that employs four TSR sources: revenue growth, margin expansion, dividends, and share repurchases.
We monitor our TSR performance on a rolling three-year basis. We believe our disciplined growth strategy, portfolio management, and prudent use of capital will support achievement of our goal over time.
The table below shows the components of our TSR targets.
| | | | | | | | |
| | Current Targets |
| Revenue Growth | | 6-9% |
| Margin Increase | | 1% |
| | |
| Dividend Yield | | 3% |
| Stock Buyback | | 1% |
| Total Shareholder Return | | 11-14% |
During the period this report covers, senior executives participated in an incentive program with a three-year performance period based on two equal measures: (i) our TSR performance compared to the performance of a group of approximately 300 peers; and (ii) the Company or segment Earnings Before Interest and Taxes (EBIT) Compound Annual Growth Rate (CAGR).
Customers
We serve a broad suite of customers, with our largest customer representing less than 6% of our sales in 2022. Many are companies whose names are widely recognized. They include bedding brands and manufacturers, residential and office furniture producers, automotive OEM and Tier 1 manufacturers, and a variety of other companies.
Organic Sales
We calculate organic sales as trade sales excluding sales attributable to acquisitions and divestitures consummated within the last twelve months. Management uses the metric, and it is useful to investors, as supplemental information to analyze our underlying sales performance from period to period in our legacy businesses.
Major Factors That Impact Our Business
Many factors impact our business, but those that generally have the greatest impact are discussed below.
Market Demand
Market demand (including product mix) is impacted by several economic factors, with consumer confidence being the most significant. Other important factors include disposable income levels, employment levels, housing turnover, and interest rates. All of these factors influence consumer spending on durable goods, and therefore affect demand for our products and components. Some of these factors also influence business spending on facilities and equipment, which impacts approximately 25% of our sales. As we moved through 2022, the dynamic macroeconomic and geopolitical environment pressured our markets and affected our demand. We expect overall demand in 2023 to be slightly lower than levels experienced in 2022.
Inflationary Trends in Cost of Goods Sold
Our costs have increased significantly as market prices for raw materials (many of which are commodities) have been impacted by inflation. We typically have short-term commitments from our suppliers; accordingly, our raw material costs generally move with the market. Our costs have also been impacted by higher prices for transportation and energy (partially from the Russian invasion of Ukraine) as well as labor. Our ability to recover higher costs through selling price increases is crucial. When we experience significant increases in costs of goods sold, we typically implement price increases to recover the higher costs. While we have been generally successful in recovering the higher costs, even during these volatile times, the timing of our price increases is important; we typically experience a lag in recovering higher costs.
Steel is our principal raw material. At various times in past years, we have experienced significant cost fluctuations in this commodity. In most cases, the major changes (both increases and decreases) were passed through to customers with selling price adjustments. Over the past few years, we have seen varying degrees of inflation and deflation in U.S. steel pricing. Steel costs inflated throughout 2021 and the first half of 2022. In the second half of 2022, costs deflated as demand in the steel markets softened.
As a producer of steel rod, we are also impacted by changes in metal margins (the difference in the cost of steel scrap and the market price for steel rod). In 2021, steel rod price increases outpaced steel scrap price increases resulting in significantly expanded metal margins within the steel industry. Metal margins expanded further in the first half of 2022 but began to modestly compress late in the third quarter and throughout the fourth quarter. These expanded metal margins were partially offset by increased energy and input costs in our steel rod business. While uncertain, we currently expect lower metal margins in our Steel Rod business in 2023, which, if realized, would negatively impact our earnings.
We have exposure to the cost of chemicals, including TDI, MDI, and polyol. The cost of these chemicals has fluctuated at times, but we have generally passed the changes through to our customers. In 2021, chemical prices inflated due to robust demand and shortages from severe weather, supplier production disruptions, port delays, and logistics challenges. The supply shortages in 2021 resulted in significant restrictions by producers. Late in 2021, chemical prices leveled off as supply availability improved. In 2022, chemical pricing was relatively stable at historically high levels.
Shortages in the labor markets in several industries in which we operate have created challenges in hiring and maintaining adequate workforce levels. Because of these shortages, we have experienced increased labor costs.
Some facilities have experienced disruptions in logistics necessary to import, export, or transfer raw materials or finished goods, which has generally resulted in increased transportation costs that are typically passed through to our customers. Our supply chains have also been hampered by congested ports.
Our other raw materials include woven and nonwoven fabrics and foam scrap. We have experienced changes in the cost of these materials and generally have been able to pass them through to our customers.
When we raise our prices to recover higher raw material costs, this sometimes causes customers to modify their product designs and replace higher cost components with lower cost components. We must continue providing product options to our customers that enable them to improve the functionality of their products and manage their costs, while providing higher profits for our operations.
Supply Chain Disruptions
We have experienced significant supply chain disruptions related to semiconductor shortages, labor availability, and freight challenges, as well as higher costs associated with each of these issues. We have also experienced delays in delivery of raw materials, parts, and finished goods because of shutdown or congested delivery ports, trucking constraints, severe
weather, and the invasion of Ukraine. This has resulted in reduced volume and higher costs in many of our businesses, including our Automotive Group and Bedding Products segment, primarily related to negative impacts on component demand and finished goods production.
Currently, there is a shortage of semiconductors in the automotive industry. As semiconductor demand elsewhere in the economy has increased over the past few years, automotive OEMs and other suppliers have not been able to secure an adequate supply and as a result have reduced production of some automobile models and/or eliminated certain features (some of which may be added later), which in turn has reduced our sale of products. Consumer demand remains strong, but the semiconductor shortage has caused new vehicle inventories to remain near historically low levels. Our Automotive Group uses the semiconductors in seat comfort products, and to a lesser extent in motors and actuators. Although our Automotive Group has been able to obtain an adequate supply of semiconductors, we are dependent on our suppliers to deliver these semiconductors in accordance with our production schedule. A shortage of the semiconductors, either to us, the automotive OEMs, or our suppliers, can disrupt our operations and our ability to deliver products to our customers.
The Russian invasion of Ukraine has caused disruptions in our supply chain and negatively impacted our results of operations. Although we do not have operations in Russia, Belarus, or Ukraine, and we have not had a material amount of sales into these countries, some of our businesses have sourced, directly or indirectly, a portion of their supply chain requirements of nickel, titanium, and birch plywood from Russia. Our Aerospace Products Group uses nickel and titanium in the production of aerospace tubing. Several of our businesses use birch plywood in their products. Also, a significant portion of neon gas is produced in Ukraine. Our Automotive Group uses semiconductors, the production of which uses neon gas. Since the invasion began, the prices of these materials have significantly increased. Several countries have imposed economic sanctions against Russia as a result of its military action. It is possible sanctions could be expanded, or additional measures taken, which could restrict the import of nickel and titanium, and further restrict the import of birch plywood from Russia or greatly increase the cost of procurement via further increased duties or otherwise. Also, if the conflict in Ukraine expands geographically or in intensity, this may have a negative impact on our operations, including access to energy and other raw materials.
A significant portion of global production of oil is refined and exported from Russia. The European Union and certain countries, including the United States, the United Kingdom, Canada, and Australia, have either partially or fully banned the import of Russian oil. With decreased supply availability, fuel costs have increased and may continue to increase. This has impacted, and may continue to impact, both our businesses and consumers. Also, there has been a reduction of natural gas exports from Russia to Europe from sanction-related impacts and disruption in pipeline delivery, resulting in shortages and higher prices. Higher energy prices have contributed to broader inflationary trends, which have resulted, in some cases, in reduced discretionary consumer spending and a softening of demand for our products. If this continues, the demand for our products may continue to be negatively impacted, which would have a negative impact on our sales.
Competition
Many of our markets are highly competitive, with the number of competitors varying by product line. In general, our competitors tend to be smaller, private companies. Many of our competitors, both domestic and foreign, compete primarily on the basis of price. Our success has stemmed from the ability to remain price competitive, while delivering innovation, better product quality, and customer service.
We continue to face pressure from foreign competitors, as some of our customers source a portion of their components and finished products offshore. In addition to lower labor rates, foreign competitors benefit (at times) from lower raw material costs. They may also benefit from currency factors and more lenient regulatory climates. We typically compete in market segments that value product differentiation. However, when we do compete on cost, we typically remain price competitive in most of our business units, even versus many foreign manufacturers, as a result of our efficient operations, automation, vertical integration in steel rod and wire, logistics and distribution efficiencies, and large-scale purchasing of raw materials and commodities. We have also reacted to foreign competition in certain cases by selectively adjusting prices, developing new proprietary products that help our customers reduce total costs, and shifting production offshore to take advantage of lower input costs.
Since 2009, there have been antidumping duty orders on innerspring imports from China, South Africa, and Vietnam, ranging from 116% to 234%. In September 2019, the Department of Commerce (DOC) and the International Trade Commission (ITC) concluded a second sunset review extending the orders for an additional five years, through October
2024, at which time the DOC and ITC will conduct a third sunset review to determine whether to extend the orders for an additional five years.
Antidumping and countervailing duty cases filed by major U.S. steel wire rod producers have resulted in the imposition of antidumping duties on imports of steel wire rod from Brazil, China, Belarus, Indonesia, Italy, Korea, Mexico, Moldova, Russia, South Africa, Spain, Trinidad & Tobago, Turkey, Ukraine, United Arab Emirates, and the United Kingdom, ranging from 1% to 757%, and countervailing duties on imports of steel wire rod from Brazil, China, Italy, and Turkey, ranging from 3% to 193%. In June 2020, the ITC and DOC concluded a first sunset review, extending the orders on China through June 2025, and in July 2020, the ITC and DOC concluded a third sunset review, determining to extend the orders on Brazil, Indonesia, Mexico, Moldova, and Trinidad & Tobago through August 2025. The ITC and DOC are currently conducting sunset reviews regarding duties for Belarus, Italy, Korea, Russia, South Africa, Spain, Turkey, Ukraine, United Arab Emirates, and the United Kingdom to determine whether to extend those orders for an additional five years.
Since 2019, there has been an antidumping duty order on mattress imports from China ranging from 57% to 1,732%. This order will remain in effect through December 2024, at which time the DOC and ITC will conduct a sunset review to determine whether to extend the order for an additional five years.
In March 2020, the Company, along with other domestic mattress producers and two labor unions representing workers at other mattress producers, filed antidumping petitions with the DOC and the ITC alleging that manufacturers of mattresses in Cambodia, Indonesia, Malaysia, Serbia, Thailand, Turkey, and Vietnam were unfairly selling their products in the United States at less than fair value (dumping) and a countervailing duty petition alleging manufacturers of mattresses in China were benefiting from subsidies. In March 2021, the DOC made final determinations, assigning China a countervailing duty rate of 97.78% and antidumping duty rates on the other seven countries from 2.22% – 763.28%. In April 2021, the ITC made a unanimous affirmative final determination that domestic mattress producers were materially injured by reason of the unfairly priced or subsidized imported mattresses. Accordingly, the agencies instructed that final antidumping and countervailing duty orders will remain in effect for five years, through May 2026, at which time the DOC and ITC will conduct a sunset review to determine whether to extend the order for an additional five years. Appeals were filed with the U.S. Court of International Trade (CIT) as to the DOC’s final determinations of margins for Cambodia, Indonesia, Thailand, and Vietnam and the ITC’s final determination of injury. On November 28, 2022, the CIT issued a ruling on the appeal of the DOC’s final determination as to the rates for Vietnam, siding with the DOC and the Petitioners as to the basis for certain calculations, but also ordering a partial remand to the DOC to explain the use of certain financial data in making that determination. See Item 3 Legal Proceedings on page 27 for more information. COVID-19 Impacts on our Business
Below is a discussion of the various impacts of COVID-19 on our business.
Demand for our Products. Various governments in North America, Europe, Asia, and elsewhere instituted, and some have reinstituted, quarantines, shelter-in-place or stay-at-home orders, or restrictions on public gatherings as well as limitations on social interactions, which have had, and could further have, an adverse effect on the demand for our products.
Impact on our Manufacturing Operations. As of December 31, 2022, we had manufacturing facilities in 18 countries, including the United States. All of our facilities are open and running at this time. If our manufacturing operations are not fully operational, our ability to obtain necessary raw materials and parts, to manufacture and ship finished products to our customers, and to maintain appropriate labor levels because of absenteeism or otherwise, could be negatively impacted, particularly if we are unable to shift production to other manufacturing facilities. Some of our facilities in China, most notably in our Automotive and Home Furniture businesses, have in the past been temporarily closed from time to time due to strict lockdown requirements. If the lockdowns in China are imposed on a broader geographic scope, this could materially negatively impact our manufacturing capacity, our customers or vendors, and our ability to transport goods in our supply chain. We have also had, at various times, some capacity restrictions on our plants due to governmental orders in other parts of the world. We have been and could be further negatively affected by governmental action in any one or more of the countries in which we operate by the imposition, or re-imposition, of restrictive social measures, mandatory closures of retail establishments that sell our products or our customers’ products, travel restrictions, and restrictions on the import or export of products. The continued realization of these risks to our manufacturing operations, labor force, and supply chain could also increase labor, commodity, and transportation costs.
Relief under the CARES Act and Foreign Governmental Subsidies. We deferred $19 million of our 2020 payment of employer's Social Security match as provided by the Coronavirus Aid, Relief, and Economic Security (CARES) Act. Approximately half was paid in January 2022 and the other half was paid in January 2023, all in accordance with the
holiday schedules for the December 31, 2021 and December 31, 2022 deferral dates. We also received $1 million, $4 million, and $21 million in 2022, 2021, and 2020, respectively, of government subsidies in our international locations. These deferrals and subsidies did not have a material impact on our short- or long-term financial condition, results of operations, liquidity, or capital resources and did not contain material restrictions on our operations, sources of funding, or otherwise. In addition, in 2021 we received $5 million of insurance proceeds from a business interruption claim due to COVID-19 pandemic disruptions.
Sale of Real Estate
In the second quarter 2021, we sold certain real estate associated with our exited Fashion Bed business in the Bedding Products segment and recognized a gain of approximately $28 million on the transaction.
RESULTS OF OPERATIONS—2022 vs. 2021
Consolidated Results
The following table shows the changes in sales and earnings during 2022, and identifies the major factors contributing to the changes from prior year.
| | | | | | | | | | | |
| (Dollar amounts in millions, except per share data) | Amount | | % 1 |
| Net trade sales: | | | |
| Year ended December 31, 2021 | $ | 5,073 | | | |
| Divestitures | (15) | | | (1) | % |
| 2021 sales excluding divestitures | 5,058 | | | |
| Approximate volume declines | (373) | | | (7) | |
| Approximate raw material-related inflation and currency impact | 386 | | | 7 | |
| Organic sales | 13 | | | — | |
| Acquisition sales growth | 76 | | | 2 | |
| Year ended December 31, 2022 | $ | 5,147 | | | 1 | % |
| Earnings: | | | |
| (Dollar amounts, net of tax) | | | |
| Year ended December 31, 2021 | $ | 403 | | | |
| Non-recurrence gain on sale of real estate | (21) | | | |
| | | |
| | | |
| | | |
| | | |
| | | |
| | | |
| | | |
| | | |
Other items, primarily lower volume, lower overhead absorption, and inefficiencies partially offset by higher metal margin and pricing discipline | (72) | | | |
| Year ended December 31, 2022 | $ | 310 | | | |
| 2021 Earnings Per Diluted Share | $ | 2.94 | | | |
| 2022 Earnings Per Diluted Share | $ | 2.27 | | | |
1 Calculations impacted by rounding
Full-year trade sales increased 1%, to $5.15 billion. Organic sales were flat, with volume declines of 7% and currency impact of 2% offset by raw material-related price increases of 9%. Acquisitions, net of divestitures, contributed 1% to sales growth.
Earnings decreased primarily from lower trade sales volume, lower overhead absorption from reduced production, operational inefficiencies in Specialty Foam, higher raw material and transportation costs and operational inefficiencies in Automotive, and the non-recurrence of a prior year gain on the sale of real estate associated with our exited Fashion Bed business. These decreases were partially offset by metal margin expansion in our Steel Rod business and pricing discipline in the Furniture, Flooring & Textile Products segment.
Interest and Income Taxes
Net interest expense in 2022 was higher by $7 million compared to the twelve months ended December 31, 2021 primarily due to the issuance of $500 million debt in the fourth quarter 2021 and higher rates on commercial paper.
Our worldwide effective income tax rate was approximately 23% in both 2022 and 2021. The following table reflects how our effective income tax rate differs from the statutory federal income tax rate. See Note N on page 103 of the Notes to Consolidated Financial Statements for additional details. | | | | | | | | | | | |
| Year Ended December 31 |
| 2022 | | 2021 |
| Statutory federal income tax rate | 21.0 | % | | 21.0 | % |
| Increases (decreases) in rate resulting from: | | | |
| State taxes, net of federal benefit | .9 | | | 1.5 | |
| Tax effect of foreign operations | (.5) | | | (.9) | |
| Global intangible low-taxed income | .6 | | | .5 | |
| Current and deferred foreign withholding taxes | 2.6 | | | 2.3 | |
| | | |
| | | |
| Stock-based compensation | (.1) | | | (.5) | |
| | | |
| Change in valuation allowance | (.1) | | | — | |
| | | |
| | | |
| Other permanent differences, net | (1.0) | | | (.8) | |
| Other, net | (.2) | | | (.2) | |
| Effective tax rate | 23.2 | % | | 22.9 | % |
Segment Results
In the following section we discuss 2022 sales and EBIT (earnings before interest and taxes) for each of our segments. We provide additional detail about segment results and a reconciliation of segment EBIT to consolidated EBIT in Note F on page 84 of the Notes to Consolidated Financial Statements. | | | | | | | | | | | | | | | | | | | | | | | | | | | | | | | | | | | |
| (Dollar amounts in millions) | 2022 | | 2021 | | Change in Sales | | % Change
Organic | | |
| $ | | % | | Sales 1 |
| Trade sales | | | | | | | | | | | |
| Bedding Products | $ | 2,356.3 | | | $ | 2,455.9 | | | $ | (99.6) | | | (4.1) | % | | (4.7) | % | | |
| Specialized Products | 1,118.3 | | | 998.9 | | | 119.4 | | | 12.0 | | | 8.1 | | | |
| Furniture, Flooring & Textile Products | 1,672.1 | | | 1,617.8 | | | 54.3 | | | 3.4 | | | 2.9 | | | |
| | | | | | | | | | | |
| | | | | | | | | | | |
| Total trade sales | $ | 5,146.7 | | | $ | 5,072.6 | | | $ | 74.1 | | | 1.5 | % | | 0.3 | % | | |
| | | | | | | | | | | |
| | 2022 | | 2021 | | Change in EBIT | | EBIT Margins |
| $ | | % | | 2022 | | 2021 |
| EBIT | | | | | | | | | | | |
| Bedding Products | $ | 219.6 | | | $ | 321.3 | | | $ | (101.7) | | | (31.7) | % | | 9.3 | % | | 13.1 | % |
| Specialized Products | 99.4 | | | 115.9 | | | (16.5) | | | (14.2) | | | 8.9 | | | 11.6 | |
| Furniture, Flooring & Textile Products | 165.0 | | | 159.5 | | | 5.5 | | | 3.4 | | | 9.9 | | | 9.9 | |
| Intersegment eliminations & other | 1.0 | | | (.7) | | | 1.7 | | | | | | | |
| | | | | | | | | | | |
| Total EBIT | $ | 485.0 | | | $ | 596.0 | | | $ | (111.0) | | | (18.6) | % | | 9.4 | % | | 11.7 | % |
| | | | | | | | | | | |
| 2022 | | 2021 | | | | | | | | |
| Depreciation and amortization | | | | | | | | | | | |
| Bedding Products | $ | 104.1 | | | $ | 106.8 | | | | | | | | | |
| Specialized Products | 40.5 | | | 44.8 | | | | | | | | | |
| Furniture, Flooring & Textile Products | 23.2 | | | 24.0 | | | | | | | | | |
Unallocated 2 | 12.0 | | | 11.7 | | | | | | | | | |
| Total depreciation and amortization | $ | 179.8 | | | $ | 187.3 | | | | | | | | | |
1 This is the change in sales not attributable to acquisitions or divestitures in the last 12 months. Refer to the Bedding Products, Specialized Products, and Furniture, Flooring & Textile Products discussions below for a reconciliation of the change in total segment sales to organic sales.
2 Unallocated consists primarily of depreciation and amortization on non-operating assets.
Bedding Products
Trade sales decreased 4%. Organic sales were down 5%, from volume declines of 16% and negative currency impact of 1% partially offset by raw material-related selling price increases of 12%. Acquisitions, net of divestitures, added 1% to sales.
EBIT decreased $102 million, primarily from lower volume, lower overhead absorption as production and inventories were adjusted to meet reduced demand, operating inefficiencies in Specialty Foam, and the non-recurrence of the prior year $28 million gain from sale of real estate associated with our exited Fashion Bed business. These decreases were partially offset by higher metal margin in our Steel Rod business.
Specialized Products
Trade sales increased 12%. Organic sales were up 8%, from volume growth of 11% and raw material-related price increases of 3% partially offset by currency impact of 6%. Acquisitions contributed 4% to sales growth.
EBIT decreased $17 million, primarily from higher raw material and transportation costs, operational inefficiencies and related premium freight costs in a North American Automotive facility, and currency impact. These decreases were partially offset by higher volume.
Furniture, Flooring & Textile Products
Trade sales increased 3%. Organic sales were up 3%, from raw material-related selling price increases of 10% partially offset by volume declines of 6% and negative currency impact of 1%. Acquisitions contributed less than 1% to sales growth.
EBIT increased $6 million, primarily from pricing discipline partially offset by lower volume.
RESULTS OF OPERATIONS—2021 vs. 2020
Consolidated Results
The following table shows the changes in sales and earnings during 2021, and identifies the major factors contributing to the changes from prior year.
| | | | | | | | | | | |
| (Dollar amounts in millions, except per share data) | Amount | | % 1 |
| Net trade sales: | | | |
| Year ended December 31, 2020 | $ | 4,280 | | | |
| Divestitures | (32) | | | (1) | % |
| 2020 sales excluding divestitures | 4,248 | | | |
| Approximate volume gains | 172 | | | 4 | |
| Approximate raw material-related inflation and currency impact | 597 | | | 14 | |
| Organic sales | 769 | | | 18 | |
| Acquisition sales growth | 56 | | | 2 | |
| Year ended December 31, 2021 | $ | 5,073 | | | 19 | % |
| Earnings: | | | |
| (Dollar amounts, net of tax) | | | |
| Year ended December 31, 2020 | $ | 253 | | | |
| Gain on sale of real estate | 21 | | | |
| 2020 goodwill impairment | 25 | | | |
| 2020 restructuring-related charges | 6 | | | |
| 2020 note impairment | 6 | | | |
| 2020 stock write-off from a prior year divestiture | 3 | | | |
Other items, primarily including high volume, metal margin expansion in our Steel Rod business, and pricing discipline | 88 | | | |
| Year ended December 31, 2021 | $ | 402 | | | |
| 2020 Earnings Per Diluted Share | $ | 1.86 | | | |
| 2021 Earnings Per Diluted Share | $ | 2.94 | | | |
1 Calculations impacted by rounding
Full-year trade sales increased 19%, to $5.07 billion. Organic sales increased 18%, primarily from raw material-related selling price increases of 13%, volume recovery from pandemic-related sales declines in the first half of 2020 of 4%, and currency benefit of 1%. Acquisitions, net of divestitures, contributed 1% to sales growth.
Earnings increased primarily from the impact of higher sales volume, metal margin expansion in our Steel Rod business, and pricing discipline. As indicated in the table above, earnings also increased from a gain on the sale of real estate and the non-recurrence of the goodwill impairment charge, restructuring-related charges, the impairment charge related to a note receivable, and the stock write-off associated with a prior year divestiture that filed bankruptcy in 2020.
Interest and Income Taxes
Net interest expense in 2021 was lower by $6 million compared to the twelve months ended December 31, 2020 primarily due to lower interest rates.
Our worldwide effective income tax rate was approximately 23% in both 2021 and 2020. The following table reflects how our effective income tax rate differs from the statutory federal income tax rate. See Note N on page 103 of the Notes to Consolidated Financial Statements for additional details. | | | | | | | | | | | |
| Year Ended December 31 |
| 2021 | | 2020 |
| Statutory federal income tax rate | 21.0 | % | | 21.0 | % |
| Increases (decreases) in rate resulting from: | | | |
| State taxes, net of federal benefit | 1.5 | | | .8 | |
| Tax effect of foreign operations | (.9) | | | (2.2) | |
| Global intangible low-taxed income | .5 | | | (.3) | |
| Current and deferred foreign withholding taxes | 2.3 | | | 2.7 | |
| | | |
| | | |
| Stock-based compensation | (.5) | | | (.6) | |
| | | |
| Change in valuation allowance | — | | | .8 | |
| Change in uncertain tax positions, net | — | | | .6 | |
| Goodwill impairment | — | | | 1.6 | |
| Other permanent differences, net | (.8) | | | (1.3) | |
| Other, net | (.2) | | | (.3) | |
| Effective tax rate | 22.9 | % | | 22.8 | % |
Segment Results
In the following section we discuss 2021 sales and EBIT for each of our segments. We provide additional detail about segment results and a reconciliation of segment EBIT to consolidated EBIT in Note F on page 84 of the Notes to Consolidated Financial Statements. | | | | | | | | | | | | | | | | | | | | | | | | | | | | | | | | | | | |
| (Dollar amounts in millions) | 2021 | | 2020 | | Change in Sales | | % Change
Organic | | |
| $ | | % | | Sales 1 |
| Trade sales | | | | | | | | | | | |
| Bedding Products | $ | 2,455.9 | | | $ | 2,039.3 | | | $ | 416.6 | | | 20.4 | % | | 20.3 | % | | |
| Specialized Products | 998.9 | | | 891.2 | | | 107.7 | | | 12.1 | | | 10.7 | | | |
| Furniture, Flooring & Textile Products | 1,617.8 | | | 1,349.7 | | | 268.1 | | | 19.9 | | | 19.7 | | | |
| | | | | | | | | | | |
| | | | | | | | | | | |
| Total trade sales | $ | 5,072.6 | | | $ | 4,280.2 | | | $ | 792.4 | | | 18.5 | % | | 18.1 | % | | |
| | | | | | | | | | | |
| | 2021 | | 2020 | | Change in EBIT | | EBIT Margins |
| $ | | % | | 2021 | | 2020 |
| EBIT | | | | | | | | | | | |
| Bedding Products | $ | 321.3 | | | $ | 192.4 | | | $ | 128.9 | | | 67.0 | % | | 13.1 | % | | 9.4 | % |
| Specialized Products | 115.9 | | | 92.0 | | | 23.9 | | | 26.0 | | | 11.6 | | | 10.3 | |
| Furniture, Flooring & Textile Products | 159.5 | | | 126.5 | | | 33.0 | | | 26.1 | | | 9.9 | | | 9.4 | |
| Intersegment eliminations & other | (.7) | | | (3.4) | | | 2.7 | | | | | | | |
| | | | | | | | | | | |
| Total EBIT | $ | 596.0 | | | $ | 407.5 | | | $ | 188.5 | | | 46.3 | % | | 11.7 | % | | 9.5 | % |
| | | | | | | | | | | |
| 2021 | | 2020 | | | | | | | | |
| Depreciation and amortization | | | | | | | | | | | |
| Bedding Products | $ | 106.8 | | | $ | 106.7 | | | | | | | | | |
| Specialized Products | 44.8 | | | 44.3 | | | | | | | | | |
| Furniture, Flooring & Textile Products | 24.0 | | | 25.5 | | | | | | | | | |
Unallocated 2 | 11.7 | | | 12.9 | | | | | | | | | |
| Total depreciation and amortization | $ | 187.3 | | | $ | 189.4 | | | | | | | | | |
1 This is the change in sales not attributable to acquisitions or divestitures in the last 12 months. Refer to the Bedding Products, Specialized Products, and Furniture, Flooring & Textile Products discussions below for a reconciliation of the change in total segment sales to organic sales.
2 Unallocated consists primarily of depreciation and amortization on non-operating assets.
Bedding Products
Trade sales increased 20%. Organic sales were up 20%, entirely from raw material-related selling price increases. Volume was flat. Acquisitions and divestitures offset.
EBIT increased $129 million, primarily from higher metal margin in our Steel Rod business, pricing discipline, the $28 million gain from sale of real estate associated with our exited Fashion Bed business, and the non-recurrence of the prior year $8 million impairment related to a note receivable and $3 million restructuring-related charges, partially offset by production inefficiencies driven by supply chain constraints and higher transportation costs.
Specialized Products
Trade sales increased 12%. Organic sales were up 11%, from a 7% increase in volume and currency benefit of 4%. Acquisitions contributed 1% to sales growth.
EBIT increased $24 million, primarily from higher volume and the non-recurrence of prior year $25 million goodwill impairment charge in Hydraulic Cylinders and $4 million restructuring-related charges, partially offset by higher raw material and transportation costs.
Furniture, Flooring & Textile Products
Trade sales increased 20%. Organic sales were up 20% from raw material-related selling price increases of 10%, increased volume of 9%, and currency benefit of 1%. Acquisitions contributed less than 1% to sales growth.
EBIT increased $33 million, primarily from higher volume, pricing discipline, and non-recurrence of prior year $1 million restructuring-related charges.
LIQUIDITY AND CAPITALIZATION
Liquidity
With cash on hand, operating cash flow, our commercial paper program and/or our credit facility, and our ability to obtain debt financing, we believe we have sufficient funds available to repay maturing debt, as well as support our ongoing operations, both on a short-term and long-term basis.
Sources of Cash
Cash on Hand
At December 31, 2022, we had cash and cash equivalents of $317 million primarily invested in interest-bearing bank accounts and in bank time deposits with original maturities of three months or less. Substantially all of these funds are held in the international accounts of our foreign operations.
If we were to immediately bring back all our foreign cash to the U.S. in the form of dividends, we would pay foreign withholding taxes of approximately $17 million. Due to capital requirements in various jurisdictions, approximately $47 million of this cash was inaccessible for repatriation at year end.
Cash from Operations
The primary source of funds for our short-term cash requirements is our cash generated from operating activities. Earnings and changes in working capital levels are the two factors that generally have the greatest impact on our cash from operations.
Cash from operation2020 $603 million, 2021 $271 million, 2022 $441 million
Cash from operations increased approximately $170 million in 2022, primarily driven by a much smaller use of cash for working capital, partially offset by lower earnings. Working capital increased significantly in 2021 due to restocking
efforts following inventory depletion in 2020 but increased to a much lesser extent in 2022 as we returned to inventory levels more reflective of current demand. This improvement was partially offset by a decrease in accounts payable as purchases slowed due to lower volume and our efforts to reduce inventory levels.
We ended 2022 with working capital at 20.7% and adjusted working capital at 15.3% of annualized sales.1 The table below explains this non-GAAP calculation. We eliminate cash and current debt maturities from working capital to monitor our operating efficiency and performance related to trade receivables, inventories, and accounts payable. We believe this provides a more useful measurement to investors since cash and current maturities can fluctuate significantly from period to period.
| | | | | | | | | | | |
| (Dollar amounts in millions) | 2022 | | 2021 |
| Current assets | $ | 1,958.0 | | | $ | 2,065.3 | |
| Current liabilities | 968.1 | | | 1,335.7 | |
| Working capital | 989.9 | | | 729.6 | |
| Cash and cash equivalents | 316.5 | | | 361.7 | |
| Current debt maturities and current portion of operating lease liabilities | 58.9 | | | 345.1 | |
| Adjusted working capital | $ | 732.3 | | | $ | 713.0 | |
Annualized sales 1 | $ | 4,783.2 | | | $ | 5,331.6 | |
| Working capital as a percent of annualized sales | 20.7 | % | | 13.7 | % |
| Adjusted working capital as a percent of annualized sales | 15.3 | % | | 13.4 | % |
1 Annualized sales equal fourth quarter sales ($1,195.8 million in 2022 and $1,332.9 million in 2021) multiplied by 4. We believe measuring our working capital against this sales metric is more useful, since efficient management of working capital includes adjusting those net asset levels to reflect current business volume.
| | | | | | | | | | | | | | | | | | | | | | | | | | | | | | | | | | | | | | |
| Three Primary Components of our Working Capital |
| | Amount (in millions) | | | Days |
| 2022 | | 2021 | | 2020 | | | 2022 | | 2021 | | 2020 |
| Trade Receivables | $ | 609 | | | $ | 620 | | | $ | 535 | | | DSO 1 | 44 | | 42 | | 47 |
| | | | | | | | | | | | |
| Inventories | 908 | | | 993 | | | 692 | | | DIO 2 | 83 | | 76 | | 74 |
| | | | | | | | | | | | |
| Accounts Payable | 518 | | | 614 | | | 552 | | | DPO 3 | 50 | | 53 | | 55 |
1Days sales outstanding: ((beginning of year trade receivables + end of year trade receivables) ÷ 2) ÷ (net trade sales ÷ number of days in the period)
2Days inventory on hand: ((beginning of year inventory + end of year inventory) ÷ 2) ÷ (cost of goods sold ÷ number of days in the period)
3Days payables outstanding: ((beginning of year accounts payable + end of year accounts payable) ÷ 2) ÷ (cost of goods sold ÷ number of days in the period)
Trade Receivables - Our trade receivables decreased by $11 million at December 31, 2022 compared to the prior year and our DSO slightly increased during 2022. The decrease in accounts receivable was primarily due to reductions in net trade sales, currency, and increased participation within our trade receivables sales programs. These were partially offset by acquisitions representing $18 million. The DSO in 2020 was higher than both 2022 and 2021 as COVID-19 notably increased DSO in the first half of 2020, but strong credit discipline drove steady DSO improvement in the latter half of the year to a more normal level. We increased our allowance for doubtful accounts by $3 million during 2022, primarily related to macroeconomic uncertainties and ordinary customer credit reviews. We reduced our allowance for doubtful accounts by $3 million during 2021, reflecting lower qualitative risk compared to 2020 due to improved macroeconomic conditions and continued strong customer payment trends. We recognized $17 million of bad debt expense in 2020; approximately half was associated with elevated pandemic-related risk across the entire portfolio, and the remaining expense was related to one Bedding Products segment customer (fully reserving the balances for this customer, primarily a note receivable). We closely monitor accounts
receivable and collections, including accounts for possible loss. We also monitor general macroeconomic conditions and other items that could impact the expected collectability of all customers, or pools of customers with similar risk. We obtain credit applications, credit reports, bank and trade references, and periodic financial statements from our customers to establish credit limits and terms as appropriate. In cases where a customer’s payment performance or financial condition begins to deteriorate or in the event of a customer bankruptcy, we tighten our credit limits and terms and make appropriate reserves based upon the facts and circumstances for each individual customer, as well as pools of similar customers.
Inventories - Our inventories decreased by $85 million in 2022 and DIO increased notably in the last three years. Inventories decreased primarily from reduced production in the Steel Rod business as we returned inventory in the Bedding Products segment to levels needed to support current lower demand. The decrease also reflected currency impact and reduced levels in other businesses. This was partially offset by acquisitions which added $43 million of inventory. Inventories increased in 2021 due to restocking efforts following inventory depletion in 2020. In the first quarter of 2022, we replaced the reheat furnace at our steel rod mill, which also contributed to higher 2021 year-end inventories and affected our normal seasonal cash flow cycle. We continuously monitor our slower-moving and potentially obsolete inventory through reports on inventory quantities compared to usage within the previous 12 months. We also utilize cycle counting programs and complete physical counts of our inventory. When potential inventory obsolescence is indicated by these controls, we will take charges for write-downs to maintain an adequate level of reserves.
Accounts Payable - Our accounts payable decreased by $96 million at December 31, 2022 compared to the prior year, and our DPO decreased during 2022. The decrease in accounts payable was primarily related to the inventory factors discussed above and currency, offset by acquisitions of $28 million. Our payment terms did not change meaningfully since last year, and we have continued to focus on optimizing payment terms with our vendors. We continue to look for ways to establish and maintain favorable payment terms through our significant purchasing power and also utilize third-party services that offer flexibility to our vendors, which in turn helps us manage our DPO as discussed below.
Accounts Receivable and Accounts Payable Programs - We participate in trade receivables sales programs in combination with third-party banking institutions and certain customers. Under each of these programs, we sell our entire interest in the trade receivable for 100% of face value, less a discount. Because control of the sold receivable is transferred to the buyer at the time of sale, accounts receivable balances sold are removed from the Consolidated Balance Sheets, and the related proceeds are reported as cash provided by operating activities in the Consolidated Statements of Cash Flows. We had approximately $55 million and $35 million of trade receivables that were sold and removed from our Consolidated Balance Sheets at December 31, 2022 and 2021, respectively. These sales reduced our quarterly DSO by roughly four and three days at December 31, 2022 and 2021, respectively. The impact to operating cash flow was an approximate $20 million increase and $10 million decrease for the years ended December 31, 2022 and 2021, respectively.
For accounts payable, we have historically looked for ways to optimize payment terms through utilizing third-party programs that allow our suppliers to be paid earlier at a discount. While these programs assist us in negotiating payment terms with our suppliers, we continue to make payments based on our customary terms. A vendor can elect to take payment from a third party earlier with a discount, and in that case, we pay the third party on the original due date of the invoice. Contracts with our suppliers are negotiated independently of supplier participation in the programs, and we cannot increase payment terms pursuant to the programs. As such, there is no direct impact on our DPO, accounts payable, operating cash flows, or liquidity. The accounts payable settled through the third-party programs, which remain on our Consolidated Balance Sheets, were approximately $80 million and $130 million at December 31, 2022 and 2021, respectively.
While we utilize the above items as tools in our cash flow management and offer them as options to facilitate customer and vendor operating cycles, if there were to be a cessation of these programs, we do not expect it would materially impact our operating cash flows or liquidity.
Commercial Paper Program
Another source of funds for our short-term cash requirements is our $1.2 billion commercial paper program. As of December 31, 2022, we had $717 million available under the program. For more information on our commercial paper program, see Commercial Paper Program on page 49.
Credit Facility
Our credit facility is a multi-currency facility providing us the ability, from time to time, to borrow, repay and re-borrow up to $1.2 billion until the maturity date, at which time our ability to borrow under the facility will terminate. The credit facility matures in September 2026. Currently, there are no borrowings under the credit facility. For more information on our credit facility, see Credit Facility on page 50, and Note J on page 91 of the Notes to Consolidated Financial Statements. Capital Markets
We also believe that we have the ability to raise debt in the capital markets which acts as a source of funding of long-term cash requirements. Currently, we have $2.08 billion of total debt outstanding. The maturities of the long-term debt range from 2024 through 2051. For more information, please see Long-Term Debt on page 50, and Note J on page 91 of the Notes to Consolidated Financial Statements. Uses of Cash
Our long-term priorities for uses of cash are: fund organic growth including capital expenditures, pay dividends, fund strategic acquisitions, and repurchase stock with available cash.
Capital Expenditures
Capital expenditures-2020 $66 million, 2021 $107 million, 2022 $100 million
Total capital expenditures in 2022 were $100 million, reflecting a balance of investing for the future while controlling our spending. We intend to make investments to support expansion in businesses and product lines where sales are profitably growing, for efficiency improvement and maintenance, and for system enhancements. We expect capital expenditures to approximate $100 million in 2023. For the periods covered, our employee incentive plans emphasized returns on capital, which included net fixed assets and working capital. This emphasis focuses our management on asset utilization and helps ensure that we are investing additional capital dollars where attractive return potential exists.
Dividends
Dividends Paid-2020 $212 million, 2021 $218 million, 2022 $229 million; Dividends Declared-2020 $1.60, 2021 $1.66, 2022 $1.74
Dividends are the primary means by which we return cash to shareholders. The cash usage for dividends in 2023 should approximate $240 million.
Our long-term targeted dividend payout ratio is approximately 50% of adjusted EPS (which excludes special items such as significant tax law impacts, impairment charges, restructuring-related charges, divestiture gains, litigation accruals, and settlement proceeds). Continuing our long track record of increasing the dividend remains a high priority. In 2022, we increased the annual dividend by $.08 from $1.66 to $1.74 per share. 2022 marked our 51st consecutive annual dividend increase. We are proud of our dividend record and plan to extend it.
Acquisitions
Our long-term, 6-9% annual revenue growth objective envisions periodic acquisitions. We are seeking strategic acquisitions that complement our current products and capabilities.
In 2020, we acquired no businesses.
In 2021, we acquired three businesses for total consideration of $153 million. In January 2021, we acquired a United Kingdom (UK) manufacturer specializing in metallic ducting systems, flexible joints, and components for space, military, and commercial applications for a cash purchase price of $28 million. In May 2021, we acquired a Polish manufacturer of bent metal tubing for furniture used in office, residential, and other settings for a cash purchase price of $5 million. In June 2021, we acquired a specialty foam and finished mattress manufacturer serving the UK and Irish markets for a cash purchase price of $120 million.
In 2022, we acquired four businesses for total consideration of $112 million ($83 million cash and $29 million additional contingent consideration to be paid in cash at a later date). In August, we acquired a leading global manufacturer of hydraulic cylinders for heavy construction equipment with manufacturing locations in Germany and China and a distribution facility in the United States for a total purchase price of $90 million ($61 million cash and $29 million additional contingent consideration to be paid in cash at a later date). Also in August, we acquired a small U.S. textiles business that converts and distributes construction fabrics for the furniture and bedding industries for a cash purchase price of $2 million. In early October and mid-December, we acquired two Canadian-based distributors of products used for erosion control, stormwater management, and various other applications for a cash purchase price of $7 million and $13 million, respectively.
Additional details about acquisitions can be found in Note R on page 109 of the Notes to Consolidated Financial Statements.
Stock Repurchases
Stock repurchases are the other means by which we return cash to shareholders. During the last three years, we repurchased a total of 2 million shares of our stock and issued 3 million shares (through employee benefit plans and stock option exercises). Our net stock repurchases were $9 million, $6 million, and $60 million in 2020, 2021, and 2022, respectively. In 2022, we repurchased 1.7 million shares (at an average price of $35.94) and issued .9 million shares.
We have been authorized by the Board to repurchase up to 10 million shares each year, but we have established no specific repurchase commitment or timetable. We expect 2023 stock repurchases to be less than 2022.
Short-Term and Long-Term Cash Requirements
In addition to the expected uses of cash discussed above, we have various material short-term (12 months or less) and long-term (more than 12 months) cash requirements as listed below.
| | | | | | | | | | | | | | |
| Cash Requirements | | Short-Term | | Long-Term |
| (Dollar amounts in millions) | | | | |
Current and long-term debt, excluding finance leases 1 | | $ | 8 | | | $ | 2,072 | |
| | | | |
Operating and finance leases 2 | | 59 | | | 194 | |
Purchase obligations 3 | | 480 | | | 21 | |
Interest payments 4 | | 69 | | | 686 | |
Deemed repatriation tax payable 5 | | 5 | | | 21 | |
Liability for pension benefits 6 | | 5 | | | 14 | |
Contingent consideration 7 | | 14 | | | 18 | |
| | | | |
1The long-term debt presented above could be accelerated if we were not able to make the principal and interest payments when due. See Note J on page 91 in the Notes to Consolidated Financial Statements for more information regarding scheduled maturities of our long-term debt. 2See Note K on page 93 in the Notes to Consolidated Financial Statements for additional information on leases. 3Purchase obligations primarily include open short-term (30-120 days) purchase orders that arise in the normal course of operating our facilities.
4Interest payments assume debt outstanding remains constant with amounts at December 31, 2022 and at rates in effect at the end of the year.
5In addition to the deemed repatriation tax payable we also have deferred income taxes and other reserves for tax contingencies included in our Consolidated Balance Sheets. The resolution or settlement of these tax positions with the taxing authorities is subject to significant uncertainty. We are therefore unable to make a reliable estimate of the amount or timing of cash that may be required to settle these matters, or whether the matters will require cash to settle or resolve.
6See Note M on page 100 in the Notes to Consolidated Financial Statements for additional information on pension benefit plans. 7See Note R on page 109 in the Notes to Consolidated Financial Statements for more information on contingent consideration liabilities related to acquisitions. See Note I on page 90 of the Notes to Consolidated Financial Statements for details regarding the accrued expenses and other liabilities reflected on our Consolidated Balance Sheets.
Capitalization
Capitalization Table
This table presents key debt and capitalization statistics at the end of the three most recent years.
| | | | | | | | | | | | | | | | | | | | | | | | |
| (Dollar amounts in millions) | 2022 | | 2021 | | 2020 | | | | | | | |
| | | | | | | | | | | | |
| Total debt excluding credit facility/commercial paper | $ | 1,801.1 | | | $ | 2,090.3 | | | $ | 1,900.2 | | | | | | | | |
| Less: Current maturities of long-term debt | 9.4 | | | 300.6 | | | 50.9 | | | | | | | | |
| Scheduled maturities of long-term debt | 1,791.7 | | | 1,789.7 | | | 1,849.3 | | | | | | | | |
Average interest rates 1 | 3.8 | % | | 3.7 | % | | 3.7 | % | | | | | | | |
Average maturities in years 1 | 11.5 | | | 10.8 | | | 5.3 | | | | | | | | |
Credit facility/commercial paper 2 | 282.5 | | | — | | | — | | | | | | | | |
| Weighted average interest rate on year-end balance | 4.8 | % | | — | % | | — | % | | | | | | | |
| Average interest rate during the year | 3.2 | % | | .2 | % | | 2.0 | % | | | | | | | |
| Total long-term debt | 2,074.2 | | | 1,789.7 | | | 1,849.3 | | | | | | | | |
| Deferred income taxes and other liabilities | 502.4 | | | 533.3 | | | 519.6 | | | | | | | | |
| Equity | 1,641.4 | | | 1,648.6 | | | 1,425.1 | | | | | | | | |
| Total capitalization | $ | 4,218.0 | | | $ | 3,971.6 | | | $ | 3,794.0 | | | | | | | | |
Unused committed credit: 2 | | | | | | | | | | | | |
| Long-term | $ | 917.5 | | | $ | 1,200.0 | | | $ | 1,200.0 | | | | | | | | |
| Short-term | — | | | — | | | — | | | | | | | | |
| Total unused committed credit | $ | 917.5 | | | $ | 1,200.0 | | | $ | 1,200.0 | | | | | | | | |
| | | | | | | | | | | | |
| Cash and cash equivalents | $ | 316.5 | | | $ | 361.7 | | | $ | 348.9 | | | | | | | | |
| | | | | | | | | | | | |
1 These rates include current maturities, but exclude commercial paper to reflect the averages of outstanding debt with scheduled maturities. Increase in average maturities and interest rates are due to the issuance of the 30-year $500 million note in November 2021.
2 The unused committed credit amount is based on our revolving credit facility and commercial paper program which, during all periods presented, had a total authorized program amount of $1.2 billion. However, our borrowing capacity is limited by covenants to our credit facility. Reference is made to the discussion under Commercial Paper Program below on page 49 and Credit Facility on page 50 for more details about our borrowing capacity at December 31, 2022. Commercial Paper Program
Amounts outstanding related to our commercial paper program were:
| | | | | | | | | | | | | | | | | |
| (Dollar amounts in millions) | 2022 | | 2021 | | 2020 |
| Total authorized program | $ | 1,200.0 | | | $ | 1,200.0 | | | $ | 1,200.0 | |
| Commercial paper outstanding (classified as long-term debt) | 282.5 | | | — | | | — | |
| Letters of credit issued under the credit agreement | — | | | — | | | — | |
Amount limited by restrictive covenants of credit facility 1 | 200.9 | | | 13.0 | | | — | |
| Total program available | $ | 716.6 | | | $ | 1,187.0 | | | $ | 1,200.0 | |
1 Our borrowing capacity is limited by covenants to our credit facility. Reference is made to the discussion under Credit Facility on page 50 for more details about our borrowing capacity at December 31, 2022.
The average and maximum amounts of commercial paper outstanding during 2022 were $161 million and $402 million, respectively. During the fourth quarter, the average and maximum amounts outstanding were $349 million and $402 million, respectively. At year end, we had no letters of credit outstanding under the credit facility, but we had issued
$47 million of stand-by letters of credit under other bank agreements to take advantage of better pricing. Over the long-term, and subject to our capital needs, market conditions, and alternative capital market opportunities, we expect to maintain the indebtedness under the commercial paper program by continuously repaying and reissuing the commercial paper notes. We view the notes as a source of long-term funds and have classified the borrowings under the commercial paper program as long-term borrowings on our balance sheet. We have the intent to roll over such obligations on a long-term basis and have the ability to refinance these borrowings on a long-term basis as evidenced by our $1.2 billion revolving credit facility maturing in 2026 discussed below.
Credit Facility
Our multi-currency credit facility matures in September 2026. It provides us the ability, from time to time, subject to certain restrictive covenants and customary conditions, to borrow, repay, and re-borrow up to $1.2 billion.
Our credit facility contains restrictive covenants which (a) require us to maintain as of the last day of each fiscal quarter i) Consolidated Funded Indebtedness minus the lesser of: (A) Unrestricted Cash, or (B) $750 million to ii) Consolidated EBITDA for the four consecutive trailing quarters, such ratio not being greater than 3.50 to 1.00, provided, however, subject to certain limitations, if we have made a Material Acquisition in any fiscal quarter, at our election, the maximum Leverage Ratio shall be 4.00 to 1.00 for the fiscal quarter during which such Material Acquisition is consummated and the next three consecutive fiscal quarters; (b) limit the amount of total secured obligations to 15% of our total consolidated assets, and (c) limit our ability to sell, lease, transfer or dispose of all or substantially all of our assets and the assets of our subsidiaries, taken as a whole (other than accounts receivable sold in a Permitted Securitization Transaction, products sold in the ordinary course of business and our ability to sell, lease, transfer, or dispose of any of our assets or the assets of one of our subsidiaries to us or one of our subsidiaries, as applicable) at any given point in time. We were in compliance with all of our debt covenants at the end of 2022, and expect to maintain compliance with the debt covenant requirements. In December 2022, we amended our credit facility to change the benchmark interest rate references from the London interbank offered rate to the secured overnight financing rate. For more information about long-term debt, please see Note J on page 91 of the Notes to Consolidated Financial Statements. Our credit facility serves as back-up for our commercial paper program. At December 31, 2022, we had $283 million commercial paper outstanding and had no borrowing under the credit facility. As our trailing 12-month Consolidated EBITDA, Unrestricted Cash, and debt levels change, our borrowing capacity increases or decreases. Based on our trailing 12-month Consolidated EBITDA, Unrestricted Cash, and debt levels at December 31, 2022, our borrowing capacity under the credit facility was $717 million. However, this may not be indicative of the actual borrowing capacity moving forward, which may be materially different depending on our Consolidated EBITDA, Unrestricted Cash, debt levels, and leverage ratio requirements at that time.
On August 31, 2021, we pre-paid the remaining $280 million outstanding principal under the Term Loan A (a $500 million loan under the credit facility) that would have matured in 2024. We utilized borrowings under our commercial paper program to pre-pay the loan.
Long-Term Debt
We have total debt of $2.08 billion. The maturities of the long-term debt range from 2024 through 2051. For more details on long-term debt see Note J on page 91 of the Notes to Consolidated Financial Statements. In November 2021, we issued $500 million aggregate principal amount of notes that mature in 2051. The notes bear interest at a rate of 3.5% per year, with interest payable semi-annually. As part of this issuance, we also unwound $300 million of treasury lock agreements we had entered into during 2021 at a gain of approximately $10 million, which will be amortized over the life of the notes. The net proceeds of these notes were used to repay commercial paper and therefore indirectly were used to repay the $300 million 3.4% notes that matured in August 2022.
CRITICAL ACCOUNTING POLICIES AND ESTIMATES
We prepare our consolidated financial statements in accordance with accounting principles generally accepted in the United States of America. To do so, we must make estimates and judgments that affect the reported amounts of assets, liabilities, revenues, expenses, and disclosures. If we used different estimates or judgments, our financial statements could change. Some of these changes could be significant. Our estimates are frequently based upon historical experience and are considered by management, at the time they are made, to be reasonable and appropriate. Estimates are adjusted for actual events as they occur.
Critical accounting estimates are those that are: (a) subject to uncertainty and change and (b) of material impact to our financial statements. Listed below are the estimates and judgments which we believe could have the most significant effect on our financial statements.
We provide additional details regarding our significant accounting policies in Note A on page 75 of the Notes to Consolidated Financial Statements. | | | | | | | | | | | | | | |
| Description | | Judgments and Uncertainty | | Changes in Estimate and Effect if Actual Results Differ from Assumptions |
| Goodwill | | | | |
Goodwill is assessed for impairment annually as of June 30 and as triggering events occur.
| | Goodwill is evaluated annually for impairment as of June 30 using a quantitative analysis at the reporting unit level, which is one level below our operating segments.
Judgment is required in the quantitative analysis. We estimate fair value using a combination of:
(a) A discounted cash flow model that contains uncertainties related to the forecast of future results, as many outside economic and competitive factors can influence future performance. Revenue growth, expected changes in operating margins, and appropriate discount rates are the most critical estimates in determining enterprise values using the cash flow model.
(b) A market approach, using price to earnings ratios for comparable publicly traded companies that operate in the same or similar industry and with characteristics similar to the reporting unit.
| | We had no goodwill impairments in 2022 or 2021.
The June 2020 review resulted in a non-cash goodwill impairment charge of $25 million with respect to our Hydraulic Cylinders reporting unit, which is part of the Specialized Products segment.
Four reporting units had fair values in excess of carrying value of less than 100% in 2022 as discussed in Note C on page 81 of the Notes to Consolidated Financial Statements. At December 31, 2022, we had $1.5 billion of goodwill.
Information regarding material assumptions used to determine if a goodwill impairment exists can be found in Note A on page 75 and Note C on page 81 of the Notes to Consolidated Financial Statements.
Our assumptions are based on our current business strategy in light of present industry and economic conditions, as well as future expectations. If we are not able to achieve projected performance levels, future impairments could be possible. |
| | | | | | | | | | | | | | |
| Description | | Judgments and Uncertainty | | Changes in Estimate and Effect if Actual Results Differ from Assumptions |
| Other Long-Lived Assets | | | | |
Other long-lived assets are tested for recoverability at year end and whenever events or circumstances indicate the carrying value may not be recoverable.
For other long-lived assets we estimate fair value at the lowest level where cash flows can be measured (usually at a branch level).
| | Impairments of other long-lived assets usually occur when major restructuring activities take place, or we decide to discontinue selected products. Our impairment assessments have uncertainties because they require estimates of future cash flows to determine if undiscounted cash flows are sufficient to recover carrying values of these assets. For assets where future cash flows are not expected to recover carrying value, fair value is estimated which requires an estimate of market value based upon asset appraisals for like assets. | | These impairments are unpredictable. Impairments did not exceed $4 million per year in any of the last three years.
At December 31, 2022, net property, plant and equipment was $772 million, net intangible assets (other than goodwill) was $675 million, and operating lease right-of-use assets was $195 million. |
| Inventory Reserves | | | | |
We reduce the carrying value of inventories to reflect an estimate of net realizable value for slow-moving (i.e., not selling very quickly) and obsolete inventory.
Generally, a reserve is required when we have more than a 12-month supply of the product.
The calculation also uses an estimate of the ultimate recoverability of items identified as slow-moving, based upon historical experience.
If we have had no sales of a given product for 12 months, those items are generally deemed to be obsolete with no value and are written down completely.
| | Our inventory reserve contains uncertainties because the calculation requires management to make assumptions about the value of products that are obsolete or slow-moving.
Purchases of inventories in excess of quantities ultimately sold and/or changes in customer behavior and requirements can cause inventory to become obsolete or slow-moving. Restructuring activity and decisions to narrow product offerings also impact the estimated net realizable value of inventories.
| | At December 31, 2022, the reserve for obsolete and slow-moving inventory was $55 million (approximately 6% of inventories). This is slightly higher than the reserves at December 31, 2021 and 2020, representing approximately 5% of inventories for both years.
Additions to inventory reserves in 2022 were $17 million, which is slightly higher than our $15 million three-year average. This increase is primarily associated with operating inefficiencies in Specialty Foam and is not indicative of overall trends.
There have been no changes to our policies for establishing reserves, and we do not expect significant changes to our historical obsolescence levels.
For additional information, see discussions of our inventories on page 45 of this Form 10-K.
|
| | | | | | | | | | | | | | |
| Description | | Judgments and Uncertainty | | Changes in Estimate and Effect if Actual Results Differ from Assumptions |
| Credit Losses | | | | |
For accounts and notes receivable, we estimate a bad debt reserve for the amount that will ultimately be uncollectible. When we become aware of a specific customer’s potential inability to pay, we record a bad debt reserve for the amount we believe may not be collectible. We also monitor general macroeconomic conditions and other items that could impact the expected collectibility of all customers or pools of customers with similar risk.
| | Our bad debt reserve contains uncertainties because it requires management to estimate the amount uncollectible based upon an evaluation of several factors such as the length of time that receivables are past due, the financial health of the customer, industry and macroeconomic considerations, and historical loss experience.
Our customers are diverse and many are small-to-medium sized companies, with some being highly leveraged. Bankruptcy can occur with some of these customers relatively quickly and with little warning.
In cases where a customer’s payment performance or financial condition begins to deteriorate, we tighten our credit limits and terms and make appropriate reserves when deemed necessary. Certain of our customers have from time to time experienced bankruptcy, insolvency, and/or an inability to pay their debts to us as they come due. If our customers suffer significant financial difficulty, they may be unable to pay their debts to us timely or at all, they may reject their contractual obligations to us under bankruptcy laws or otherwise, or we may have to negotiate significant discounts and/or extend financing terms with these customers. | | A significant change in the financial status of a large customer could impact our estimates. However, we believe we have established adequate reserves on our customer accounts. Our bad debt expense has fluctuated over the last three years: $3 million in 2022, ($3) million in 2021, and $17 million in 2020. The 2022 expense primarily related to macroeconomic uncertainties and ordinary customer credit reviews. The expense for 2020 was impacted by pandemic-related economic declines and one account that is now fully reserved at $21 million (as discussed in Note H on page 88 of the Notes to Consolidated Financial Statements). Although we have not experienced significant issues with customer payment performance since 2020, the effects of the pandemic have adversely impacted the operations of many of our customers, which have and could further impact their ability to pay their debts to us. As a result, we increased the reserves on trade accounts receivable in 2020 to reflect this increased risk but decreased this reserve in 2021 as conditions improved. Excluding the reserved account discussed above, the average annual amount of bad debt expense associated with trade accounts receivable was less than $4 million (significantly less than 1% of annual net trade sales) over the last three years. At December 31, 2022, our allowances for doubtful trade accounts receivable were $18 million (less than 3% of our trade receivables of $627 million). |
| | | | | | | | | | | | | | |
| Description | | Judgments and Uncertainty | | Changes in Estimate and Effect if Actual Results Differ from Assumptions |
| | | | |
| | | | |
| Pension Accounting | | | | |
For our pension plans, we must estimate the cost of benefits to be provided (well into the future) and the current value of those benefit obligations.
| | The pension liability calculation contains uncertainties because it requires management's judgment. Assumptions used to measure our pension liabilities and pension expense annually include:
- the discount rate used to calculate the present value of future benefits
- an estimate of expected return on pension assets based upon the mix of investments held (bonds and equities)
- certain employee-related factors, such as turnover, retirement age, and mortality. Mortality assumptions represent our best estimate of the duration of future benefit payments at the measurement date. These estimates are based on each plan's demographics and other relevant facts and circumstances
- the rate of salary increases where benefits are based on earnings. | | Our U.S. plans represent approximately 84% of our pension benefit obligations.
Each 25 basis point decrease in the discount rate for our U.S. plans increases pension expense by $.2 million and increases the plans’ benefit obligations by $4.8 million.
Each 25 basis point reduction in the expected return on assets for our U.S. plans would increase pension expense by $.4 million, but have no effect on the plans’ funded status. |
| | | | |
| | | | |
| | | | |
| | | | | | | | | | | | | | |
| Description | | Judgments and Uncertainty | | Changes in Estimate and Effect if Actual Results Differ from Assumptions |
| Income Taxes | | | | |
| In the ordinary course of business, we must make estimates of the tax treatment of many transactions, even though the ultimate tax outcome may remain uncertain for some time. These estimates become part of the annual income tax expense reported in our financial statements. Subsequent to year end, we finalize our tax analysis and file income tax returns. Tax authorities periodically audit these income tax returns and examine our tax filing positions, including (among other things) the timing and amounts of deductions, and the allocation of income among tax jurisdictions. If necessary, we adjust income tax expense in our financial statements in the periods in which the actual outcome becomes more certain. | | Our tax liability for unrecognized tax benefits contains uncertainties because management is required to make assumptions and to apply judgment to estimate the exposures related to our various filing positions. Our effective tax rate is also impacted by changes in tax laws, the current mix of earnings by taxing jurisdiction, and the results of current tax audits and assessments. At December 31, 2022 and 2021, we had $10 million and $13 million, respectively, of net deferred tax assets on our balance sheet, primarily related to net operating losses and other tax carryforwards. The ultimate realization of these deferred tax assets is dependent upon the amount, source, and timing of future taxable income. In cases where we believe it is more likely than not that we may not realize the future potential tax benefits, we establish a valuation allowance against them. | | Changes in U.S. and foreign tax laws could impact assumptions related to the taxation and repatriation of certain foreign earnings. Audits by various taxing authorities continue as governments look for ways to raise additional revenue. Based upon past audit experience, we do not expect any material changes to our tax liability as a result of this audit activity; however, we could incur additional tax expense if we have audit adjustments higher than recent historical experience.
The likelihood of recovery of net operating losses and other tax carryforwards has been closely evaluated and is based upon such factors as the time remaining before expiration, viable tax planning strategies, and future taxable earnings expectations. We believe that appropriate valuation allowances have been recorded as necessary. However, if earnings expectations or other assumptions change such that additional valuation allowances are required, we could incur additional tax expense. Likewise, if fewer valuation allowances are needed, we could incur reduced tax expense. |
| | | | |
| | | | |
CONTINGENCIES
For contingencies related to the impact of the COVID-19 pandemic on our business, please see “COVID-19 Impacts on our Business” on page 36.
Litigation
Accruals for Probable Losses
We are exposed to litigation contingencies that, if realized, could have a material negative impact on our financial condition, results of operations, and cash flows. Although we deny liability in all currently threatened or pending litigation proceedings in which we are or may be a party, and believe we have valid bases to contest all claims made against us, we have recorded a litigation contingency accrual for our reasonable estimate of probable loss for pending and threatened litigation proceedings, in aggregate, of $.9 million, $1.0 million, and $.5 million at December 31, 2022, 2021, and 2020, respectively. There were no material adjustments to the accrual, including cash payments and expense, for each of the years ended December 31, 2022, 2021, and 2020, respectively. The accruals do not include accrued expenses related to workers’ compensation, vehicle-related personal injury, product and general liability claims, taxation issues, and environmental matters, some of which may contain a portion of litigation expense. However, any litigation expense associated with these categories is not anticipated to have a material effect on our financial condition, results of operations, or cash flows. For more information regarding accrued expenses, see “Accrued expenses” under Note I on page 90 of the Notes to Consolidated Financial Statements.
Reasonably Possible Losses in Excess of Accruals
Although there are a number of uncertainties and potential outcomes associated with all of our pending or threatened litigation proceedings, we believe, based on current known facts, that additional losses, if any, are not expected to materially affect our consolidated financial position, results of operations, or cash flows. However, based upon current known facts, as of December 31, 2022, aggregate reasonably possible (but not probable, and therefore not accrued) losses in excess of the accruals noted above are estimated to be $11 million. If our assumptions or analyses regarding these contingencies are incorrect, or if facts change, we could realize losses in excess of the recorded accruals (and in excess of the $11 million referenced above), which could have a material negative impact on our financial condition, results of operations, and cash flows.
For more information regarding litigation contingencies, please refer to Note T on page 111 of the Notes to Consolidated Financial Statements, which is incorporated herein by reference. Climate Change
Change in Laws, Policies, and Regulations
Many scientists, legislators, and others attribute global warming to increased levels of greenhouse gas (GHG) emissions, including carbon dioxide, which has led to significant legislative and regulatory efforts to limit such emissions. At December 31, 2022, we had 135 manufacturing facilities in 18 countries. We also maintain a fleet of over-the-road tractor trailers that emit GHG. Our manufacturing facilities are primarily located in North America, Europe, and Asia. There are certain transition risks (meaning risks related to the process of reducing the Company’s carbon footprint) that could materially affect our business, capital expenditures, results of operations, financial condition, competitive position and reputation. One of these transition risks is the change in treaties, laws, policies, and regulations that could impose significant operational and compliance burdens. For example, our operations are subject to certain governmental actions like the European Union’s (EU) “European Green Deal” (which provides for a 55% reduction in net GHG emissions by 2030 (compared to 1990 levels), and no net emissions of GHG by 2050), and the “Paris Agreement” (which is an international treaty on climate change designed to lower GHG emissions). In addition, specifically with respect to our Automotive Group, the EU is moving forward with an effective ban on the sale of new gas-powered automobiles in the EU from 2035 (with interim requirements by 2030), aiming to accelerate the conversion to zero-GHG emission automobiles as part of a broad package to combat global warming. Some states, including California and New York, are also implementing similar provisions. The Company’s automotive products can be sold to manufacturers of either gas-powered or electric-powered vehicles. However, if our customers (who may be subject to any of these or other similarly proposed or newly enacted laws and regulations) incur additional costs to comply with such laws and regulations, which in turn, impact their ability to operate at similar levels in certain jurisdictions, the demand for our products could be adversely affected. Also, overall, there continues to be a lack of consistent climate legislation in the jurisdictions in which we operate, which creates economic and regulatory uncertainty. If these laws or regulations (including the SEC’s proposed rule regarding climate-related disclosures) impose significant operational restrictions and compliance requirements on us, they could increase costs associated with our operations, including costs for raw materials and transportation. Non-compliance with climate change treaties, legislative and regulatory requirements could also negatively impact our reputation. To date, however, we have not experienced a material impact from climate change legislative and regulatory efforts.
Direct Effects
The acute and chronic physical effects of climate change, such as severe weather-related events, natural disasters and/or significant changes in climate patterns could have an increasingly adverse impact on our business and customers. As mentioned above, at December 31, 2022, we had 135 manufacturing facilities in 18 countries, primarily in North America, Europe, and Asia. We serve thousands of customers worldwide. In 2022, our largest customer represented less than 6% of our sales, and our customers were located in approximately 100 countries. Although our diverse geographical manufacturing footprint and our broad geographical customer base mitigates the potential physical risks of any local or regional climate change weather-related event having a material effect on our operations and results, the increased frequency and severity of such weather-related events could pose a risk to our operations and results.
To continue improving our climate-related risk assessment processes, we use technology-based tools to evaluate our property portfolio’s exposure to certain natural catastrophic events. We also initiated integration of climate-related risk into our Enterprise Risk Management (ERM) process providing an opportunity to improve our internal processes for identifying, assessing, and managing climate-related risks. In 2022, we experienced minor damage to two of our operations due to weather-related events. These events did not have a material impact on our physical properties, or ability to manufacture and distribute our products to customers in a timely fashion, and did not have a material effect on our
business, financial condition, or results of operations. However, in the future, depending on whether severe weather-related events increase in frequency and severity, such events could result in potential damage to our physical assets, local infrastructure, transportation systems, water delivery systems, our customers’ or suppliers’ operations, as well as prolonged disruptions in our manufacturing operations (including but not limited to our steel rod mill), all of which could harm our business, results of operations, and financial condition.
Indirect Effects
The physical effects of climate change could continue to have an adverse impact on our supply chain. In 2020 and 2021, we experienced (due, in part, to severe weather-related impacts) supply shortages in chemicals which restricted foam supply. The restriction of foam supply constrained overall mattress production in the bedding industry and reduced our production levels. The cost of chemicals and foam also increased due to the shortages. Severe weather impacts could also reduce supply of other products in our supply chain that could result in higher prices for our products and the resources needed to produce them. If we are unable to secure an adequate and timely supply of raw materials or products in our supply chain, or the cost of these raw materials or products materially increases, it could have a negative impact on our business, results of operations, and financial condition.
We are engaged in the manufacture of various automotive components including mechanical and pneumatic lumbar support and massage systems for seating, seat suspension systems, motors and actuators, and cables. For several decades, automotive manufacturers have sought lightweight components designed to increase fuel efficiency in the automobiles they manufacture. Replacing traditional steel components with high-strength steel, magnesium, aluminum alloys, carbon fiber, and polymer composites can directly reduce the weight of a vehicle's body and chassis, and therefore reduce a vehicle’s fuel consumption. This increased fuel efficiency also indirectly reduces GHG emissions. Because of our technological competitiveness, this long-standing market dynamic has not had, and is not expected to have, a material negative impact on our share of the markets in which we compete. However, if we are unable to continue to produce comparatively lightweight components, our share in these automotive markets could be negatively impacted.
In addition, although the cost has not been, and is not expected to be, material to our business, results of operations and financial condition, severe weather-related incidents may continue to result in increased costs of our property insurance.
Compliance Costs Related to GHG Emissions Inventory
To date, we have not experienced material climate-related compliance costs. However, evaluating opportunities to reduce our carbon footprint, setting goals for carbon reduction, and measuring performance in achieving those goals will be part of our environmental, sustainability, and governance strategy moving forward. We have completed our first GHG emissions inventory covering 2019 through 2021 and are in the process of completing the 2022 inventory. To ensure our information is complete and accurate, we are engaging in a third party limited assurance process for all four years. Our emissions inventory will include Scope 1 and Scope 2 carbon dioxide equivalent emissions. We believe our inventory in each of the four years was, or will be, prepared consistent with the GHG Protocol Corporate Accounting and Reporting Standard.
Our baseline measurement will inform a long-term GHG reduction strategy, including setting reduction targets and other key performance areas. We expect to publish our ESG objectives, goals, and targets, including climate-related goals in 2023 or in the first half of 2024. As we continue to expand our understanding of our company’s emission sources, geographic distribution of emissions, and available carbon reduction and mitigation opportunities, we will work to develop a roadmap to reduce our carbon footprint. We currently do not have an estimate of the capital expenditures or operating costs that may be required to implement our GHG reduction strategies. However, we do not expect that such capital expenditures or operating costs will be material to our financial condition or results of operations.
Cybersecurity Risk
We rely on information systems to obtain, process, analyze, and manage data, as well as to facilitate the manufacture and distribution of inventory to and from our facilities. We receive, process, and ship orders, manage the billing of and collections from our customers, and manage the accounting for and payment to our vendors. We also manage our production processes with certain industrial control systems. We have a formal process in place for both incident response and cybersecurity continuous improvement that includes a cross-functional Cybersecurity Oversight Committee. Members of the Cybersecurity Oversight Committee update the Board quarterly on cybersecurity activity, with procedures in place for interim reporting if necessary. Our cybersecurity program, led by our Chief Information Security Officer, is based on industry recognized frameworks and takes a multifaceted approach to protecting our network, systems, and data, including personal information. We deploy a wide range of protective security technologies and tools including but not limited to
encryption, firewalls, endpoint detection and response, security information and event management, multi-factor authentication, and threat intelligence feeds. In addition, we use an information security risk management approach that includes monitoring security threats and trends in the industry, analyzing potential security risks that could impact the business, partnering with industry recognized security organizations, and coordinating an appropriate response should the need arise.
Although we have not experienced any material cybersecurity incidents, we have enhanced our cybersecurity protection efforts over the last few years. We use a third party to periodically benchmark our information security program against the National Institute of Standards and Technology’s Cybersecurity Framework. We provide quarterly cybersecurity training for employees with access to our email and data systems, and we have purchased broad form cyber insurance coverage. Although we believe that our cybersecurity protection systems are adequate, cybersecurity risk has increased due to remote access, remote work conditions, and associated strain on employees. As such, technology failures or cybersecurity breaches could still create system disruptions or unauthorized disclosure or alterations of confidential information. We cannot be certain that the attacker’s capabilities will not compromise our technology protecting information systems, including those resulting from ransomware attached to our industrial control systems. If these systems are interrupted or damaged by any incident or fail for any extended period of time, then our results of operations could be adversely affected. We may incur remediation costs, increased cybersecurity protection costs, lost revenues resulting from unauthorized use of proprietary information, litigation and legal costs, increased insurance premiums, reputational damage, damage to our competitiveness, and negative impact on stock price and long-term shareholder value.
Finally, burdens associated with regulatory compliance, including any potential regulations adopted by the SEC regarding cybersecurity disclosure, may increase the Company’s costs.
Goodwill Impairment Testing
A significant portion of our assets consists of goodwill and other long-lived assets, the carrying value of which may be reduced if we determine that those assets are impaired. At December 31, 2022, goodwill and other intangible assets represented $2.1 billion, or 41% of our total assets. In addition, net property, plant and equipment, operating lease right-of-use assets, and sundry assets totaled $1.1 billion, or 21% of total assets.
Our annual goodwill impairment testing performed in the second quarter of 2022 and 2021 indicated no goodwill impairments. However, fair value exceeded carrying value by less than 100% for four reporting units as summarized in the table below:
| | | | | | | | | | | | | | | | | |
| Fair value in excess of carrying value | | Goodwill |
| Goodwill impairment testing as performed in the second quarter 2022 | | Goodwill impairment testing as performed in the second quarter 2021 | | As of December 31, 2022 |
| Bedding | 54 | % | | 171 | % | | $900 | million |
| Work Furniture | 78 | % | | 85 | % | | $98 | million |
| Aerospace | 40 | % | | 28 | % | | $66 | million |
| Hydraulic Cylinders | 32 | % | | 86 | % | | $42 | million |
The Bedding reporting unit’s market value decreased primarily because of lower comparable company multiples and higher discount rates. Although the long-term outlook for the Bedding reporting unit remains strong, macroeconomic factors also have negatively impacted consumer confidence and spending in the near term, which in turn has had an adverse impact on the bedding market's near-term forecast.
Although the Work Furniture and Aerospace reporting units' long-term forecasts used in the 2022 goodwill impairment testing improved as compared to the 2021 testing, their fair values were adversely impacted by lower comparable company multiples and higher discount rates. Work Furniture's long-term forecasts increased from improving demand in the contract market as companies redesign their office footprints, although demand for products sold for residential has remained soft. Aerospace’s long-term forecasts improved in 2022, as fabricated duct assemblies are at 2019
levels, and demand for welded and seamless tube products is improving modestly but still below pre-pandemic levels. We expect the aerospace industry to return to historical levels in the next few years.
The Hydraulic Cylinders reporting unit had no goodwill associated with it at the time of our annual goodwill impairment testing in both 2022 and 2021, but an August 2022 acquisition added goodwill.
We are continuing to monitor all factors impacting these reporting units. If actual results or the long-term outlook of any of our reporting units materially differ from the assumptions and estimates used in the goodwill valuation calculations, we could incur impairment charges. These non-cash charges could have a material negative impact on our earnings. We did not identify any triggering events subsequent to the annual goodwill impairment testing date indicating a potential impairment.
The annual goodwill impairment testing performed in the second quarter of 2020 resulted in a $25 million non-cash goodwill impairment charge with respect to our Hydraulic Cylinders reporting unit (which is a part of the Specialized Products segment) and reflected the complete write-off of the goodwill associated with this reporting unit at that time.
NEW ACCOUNTING STANDARDS
The FASB has issued accounting guidance effective for current and future periods. See Note A on page 75 of the Notes to Consolidated Financial Statements for a more complete discussion. Item 7A. Quantitative and Qualitative Disclosures About Market Risk.
(Unaudited)
(Dollar amounts in millions)
Interest Rates
The table below provides information about the Company’s debt obligations sensitive to changes in interest rates. Substantially all of the debt shown in the table below is denominated in United States dollars. The fair value of fixed rate debt was approximately $210 million greater than carrying value at December 31, 2022 and approximately $130 million greater than carrying value at December 31, 2021. The fair value of the fixed rate debt was based on quoted prices in an active market. The fair value of variable rate debt is not significantly different from its recorded amount.
| | | | | | | | | | | | | | | | | | | | | | | | | | | | | | | | | | | | | | | | | | | | | | | |
| Long-term debt as of December 31, | Scheduled Maturity Date | | | | |
| 2023 | | 2024 | | 2025 | | 2026 | | 2027 | | Thereafter | | 2022 | | 2021 |
| Principal fixed rate debt | $ | — | | | $ | 300.0 | | | $ | — | | | $ | — | | | $ | 500.0 | | | $ | 1,000.0 | | | $ | 1,800.0 | | | $ | 2,100.0 | |
| Average stated interest rate | — | | | 3.80 | % | | — | | | — | | | 3.50 | % | | 3.95 | % | | 3.80 | % | | 3.74 | % |
| Principal variable rate debt | — | | | — | | | — | | | — | | | 1.8 | | | 2.0 | | | 3.8 | | | 3.8 | |
| | | | | | | | | | | | | | | |
| Unamortized discounts and deferred loan costs | | | | | | | | | | | | | (15.6) | | | (17.7) | |
Commercial paper 1 | | | | | | | | | | | | | 282.5 | | | — | |
| Miscellaneous debt and finance leases | | | | | | | | | | | | | 12.9 | | | 4.2 | |
| Total debt | | | | | | | | | | | | | 2,083.6 | | | 2,090.3 | |
| Less: current maturities | | | | | | | | | | | | | 9.4 | | | 300.6 | |
| Total long-term debt | | | | | | | | | | | | | $ | 2,074.2 | | | $ | 1,789.7 | |
1The weighted average interest rate for the average net commercial paper outstanding activity during the years ended December 31, 2022 and 2021 was 3.2% and .2%, respectively.
Derivative Financial Instruments
The Company is subject to market and financial risks related to interest rates and foreign currency. In the normal course of business, the Company utilizes derivative instruments (individually or in combinations) to reduce or eliminate these risks. The Company seeks to use derivative contracts that qualify for hedge accounting treatment; however, some instruments may not qualify for hedge accounting treatment. It is the Company’s policy not to speculate using derivative
instruments. Information regarding cash flow hedges and fair value hedges is provided in Note A beginning on page 75 and Note S beginning on page 111 of the Notes to Consolidated Financial Statements and is incorporated by reference into this section. Investment in Foreign Subsidiaries
We view our investment in foreign subsidiaries as a long-term commitment. This investment may take the form of either permanent capital or notes. Our net investment (i.e., total assets less total liabilities subject to translation exposure) in foreign operations with functional currencies other than the U.S. dollar at December 31 is as follows:
| | | | | | | | | | | | | | |
| Functional Currency (amounts in millions) | | 2022 | | 2021 |
| European Currencies | | $ | 555.8 | | | $ | 528.4 | |
| Chinese Yuan | | 252.8 | | | 269.9 | |
| Canadian Dollar | | 217.3 | | | 218.6 | |
| Mexican Peso | | 55.2 | | | 47.1 | |
| Other | | 74.6 | | | 67.8 | |
| Total | | $ | 1,155.7 | | | $ | 1,131.8 | |
We have acquired foreign companies and assets in 2022 and 2021 that are included in the amounts above. Information regarding these acquisitions is provided in Note R beginning on page 109 of the Notes to Consolidated Financial Statements and is incorporated by reference into this section. Item 8. Financial Statements and Supplementary Data.
The Consolidated Financial Statements and Notes and Financial Statement Schedule included in this Report are listed and included in Item 15 on page 66, and are incorporated by reference into this item. Item 9. Changes in and Disagreements With Accountants on Accounting and Financial Disclosure.
None.
Item 9A. Controls and Procedures.
Effectiveness of the Company’s Disclosure Controls and Procedures
An evaluation as of December 31, 2022, was carried out by the Company’s management, with the participation of the Company’s Chief Executive Officer and Chief Financial Officer, of the effectiveness of the Company’s disclosure controls and procedures (as defined in Rule 13a-15(e) under the Securities Exchange Act of 1934, as amended (the “Exchange Act”)). Based upon this evaluation, the Chief Executive Officer and Chief Financial Officer have concluded the Company’s disclosure controls and procedures were effective, as of December 31, 2022, to provide assurance that information required to be disclosed by the Company in the reports that it files or submits under the Exchange Act is recorded, processed, summarized, and reported within the time periods specified by the Securities and Exchange Commission’s rules and forms. Disclosure controls and procedures include, without limitation, controls and procedures designed to ensure that information required to be disclosed by the Company in the reports that it files or submits under the Exchange Act is accumulated and communicated to the Company’s management, including its Chief Executive Officer and Chief Financial Officer, or persons performing similar functions, as appropriate to allow timely decisions regarding required disclosure.
Management’s Annual Report on Internal Control over Financial Reporting and Auditor’s Attestation Report
Changes in the Company’s Internal Control Over Financial Reporting
There were no changes during the quarter ended December 31, 2022 that have materially affected, or are reasonably likely to materially affect, our internal control over financial reporting.
Item 9B. Other Information.
Not Applicable.
Item 9C. Disclosure Regarding Foreign Jurisdictions that Prevent Inspections.
Not Applicable.
PART III
Item 10. Directors, Executive Officers and Corporate Governance.
The subsections titled “PROPOSAL ONE: Election of Directors,” “Board and Committee Composition and Meetings,” “Consideration of Director Nominees and Diversity,” “Delinquent Section 16(a) Reports,” and “Director Independence and Board Service,” as well as the introductory paragraph under the “Corporate Governance and Board Matters” section in the Company’s definitive Proxy Statement for the Company’s Annual Meeting of Shareholders to be held on May 4, 2023, are incorporated by reference.
Directors of the Company
Directors are normally elected annually at the Annual Meeting of Shareholders and hold office until the next annual meeting of shareholders or until their successors are elected and qualified. All current directors, except Judy C. Odom, have been nominated for re-election at the Company’s annual meeting of shareholders to be held May 4, 2023. Ms. Odom previously announced that she will retire as a director effective as of the annual meeting.
In order to be nominated for election as a director, a nominee must submit a contingent resignation to the Nominating, Governance and Sustainability Committee (NGS Committee). The resignation will become effective only if (i) the director nominee fails to receive an affirmative majority of the votes cast in the director election; and (ii) the Board accepts the resignation. If a nominee fails to receive an affirmative majority of the votes cast in the director election, the NGS Committee will make a recommendation to the Board of Directors whether to accept or reject the director’s resignation and whether any other action should be taken. If a director’s resignation is not accepted, that director will continue to serve until the Company’s next annual meeting or until his or her successor is duly elected and qualified. If the Board accepts the director’s resignation, it may, in its sole discretion, either fill the resulting vacancy or decrease the size of the Board to eliminate the vacancy.
Brief biographies of the Company’s Board of Directors are provided below.
Angela Barbee, age 56, was Senior Vice President of Technology and Global R&D of Weber Inc., a manufacturer of charcoal, gas, pellet, and electric outdoor grills and accessories, from 2021 until January 2022. She previously served as Vice President of Advance Development, Global Kitchen & Bath Group of Kohler Company, a global leader in design, innovation and manufacture of kitchen and bath products, engines and power systems, and luxury cabinet and tile, from 2020 to 2021, and as Vice President of New Product Development and Engineering, Global Faucets from 2018 to 2020. Ms. Barbee served as Director of Global Creative Design Operations of General Motors, a global company that designs, builds, and sells trucks, crossovers, cars, and automobile parts and accessories, from 2013 to 2017, and in various other capacities since 1994. Ms. Barbee holds a bachelor’s degree in mechanical engineering from Wayne State University, a master’s degree in mechanical engineering from Purdue University, and has completed the Executive Education Program in the Ross Business School at the University of Michigan. Through her positions at Weber, Kohler, and General Motors, Ms. Barbee has a wide-ranging knowledge of manufacturing, engineering and innovation, management, and operations in the consumer products and automotive industries. She also has extensive international experience in leading engineering, development and innovation efforts. She was first elected as a director of the Company in 2022.
Mark A. Blinn, age 61, was President and Chief Executive Officer and a director of Flowserve Corporation, a leading provider of fluid motion and control products and services for the global infrastructure markets, from 2009 until his retirement in 2017. He previously served Flowserve as Chief Financial Officer from 2004 to 2009 and in the additional role of Head of Latin America from 2007 to 2009. Prior to Flowserve, Mr. Blinn’s positions included Chief Financial Officer of FedEx Kinko’s Office and Print Services Inc. and Vice President, Corporate Controller and Chief Accounting Officer of Centex Corporation. Mr. Blinn holds a bachelor’s degree, a law degree, and an MBA from Southern Methodist University. Mr. Blinn currently serves as a director of Texas Instruments, Incorporated, a global semiconductor design and manufacturing company, Emerson Electric Co., a global technology and engineering company for industrial, commercial and residential markets, and Globe Life Inc., a financial services holding company specializing in life insurance, annuity, and supplemental health insurance products. He previously served as a director of Kraton Corporation, a leading global producer of polymers for a wide range of applications. As the former CEO and CFO of Flowserve, Mr. Blinn has exceptional leadership experience in operations and finance, as well as strategic planning and risk management. His board service at other global, public companies provides additional perspective on current finance, oversight, and governance matters. He was first elected as a director of the Company in 2019.
Robert E. Brunner, age 65, was the Executive Vice President of Illinois Tool Works (ITW), a Fortune 250 global, multi-industrial manufacturer of advanced industrial technology, from 2006 until his retirement in 2012. He previously served ITW as President—Global Auto beginning in 2005 and President—North American Auto from 2003. Mr. Brunner holds a degree in finance from the University of Illinois and an MBA from Baldwin-Wallace University. Mr. Brunner currently serves as the independent Board Chair of Lindsay Corporation, a global manufacturer of irrigation equipment and road safety products, and as a director of NN, Inc., a diversified industrial company that designs and manufactures high-precision components and assemblies on a global basis. Mr. Brunner’s experience and leadership with ITW, a diversified manufacturer with a global footprint, provides valuable insight to our Board on the automotive strategy, business development, mergers and acquisitions, operations, and international issues. He was first elected as a director of the Company in 2009.
Mary Campbell, age 55, was appointed President, vCommerce Ventures of Qurate Retail, Inc., in 2022. Qurate Retail is comprised of a select group of retail brands including QVC, HSN, Zulily, Ballard Designs, Frontgate, Garnet Hill, and Grandin Road and is a leader in video commerce, a top-10 ecommerce retailer, and a leader in mobile and social commerce. During her more than 20 years with the company, Ms. Campbell held various leadership positions across the Merchandising, Planning and Commerce Platforms functions. Most recently, and prior to her current position, she served as Chief Content, Digital, and Platforms Officer of QxH, a segment of Qurate, since 2021, as Chief Merchandising Officer of Qurate Retail Group and Chief Commerce Officer of QVC US from 2018 to 2021, as Chief Merchandising and Interactive Officer in 2018, as Chief Interactive Experience Officer from 2017 to 2018, and as Executive Vice President, Commerce Platforms for QVC from 2014 to 2017. Ms. Campbell holds a bachelor’s degree in psychology from Central Connecticut State University. Through her positions at QxH, Qurate Retail Group and QVC, Ms. Campbell has extensive knowledge in consumer driven product innovation, marketing and brand building, and traditional and new media platforms, as well as leading teams for long-term growth and evolution. She was first elected as a director of the Company in 2019.
J. Mitchell Dolloff, age 57, was appointed the Company’s Chief Executive Officer, effective January 1, 2022, and continues to serve as President since his appointment in 2020. He previously served as Chief Operating Officer from 2019 until his appointment as CEO, President - Bedding Products from 2020 to 2021, President - Specialized Products & Furniture Products from 2017 to 2019, Senior Vice President and President of Specialized Products from 2016 to 2017, Vice President and President of the Automotive Group from 2014 to 2015, President of Automotive Asia from 2011 to 2013, Vice President of Specialized Products from 2009 to 2013, and in various other capacities for the Company since 2000. Mr. Dolloff holds a degree in economics from Westminster College (Fulton, Missouri), as well as a law degree and an MBA from Vanderbilt University. As the Company’s President and CEO, Mr. Dolloff provides comprehensive insight to the Board from strategic planning to implementation at all levels of the Company around the world, as well as the Company's relationships with investors, the financial community and other key stakeholders. He was first elected as a director of the Company in 2020.
Manuel A. Fernandez, age 76, co-founded SI Ventures, a venture capital firm focusing on IT and communications infrastructure, and has served as the managing director since 2000. Previously, he served as the Chairman, President and Chief Executive Officer at Gartner, Inc., a research and advisory company, from 1989 to 2000. Prior to Gartner, Mr. Fernandez was President and CEO of three technology-driven companies, including Dataquest, an information services company, Gavilan Computer Corporation, a laptop computer manufacturer, and Zilog Incorporated, a semiconductor manufacturer. Mr. Fernandez was the Executive Chairman of Sysco Corporation, a marketer and distributor of foodservice products, from 2012 until his retirement in 2013, having previously served as Non-executive Chairman since 2009 and as a director since 2006. Mr. Fernandez holds a degree in electrical engineering from the University of Florida and completed post-graduate work in solid-state engineering at the University of Florida. Mr. Fernandez currently serves as the lead independent director of Performance Food Group Company, a foodservice products distributor. He was previously the non-executive chairman of Brunswick Corporation, a market leader in the marine industry. Mr. Fernandez’ venture capital experience, leadership of several technology companies as CEO and service on a number of public company boards offers Leggett outstanding insight into corporate strategy and development, information technology, international growth, and corporate governance. He was first elected as a director of the Company in 2014.
Karl G. Glassman, age 64, was appointed Executive Chairman of the Board effective January 1, 2022, following his retirement as the Company’s Chief Executive Officer on December 31, 2021, a position he held since 2016. Mr. Glassman was first appointed Chairman of the Board in 2020. He previously served as President from 2013 to 2019, Chief Operating Officer from 2006 to 2015, Executive Vice President from 2002 to 2013, President of the former Residential Furnishings Segment from 1999 to 2006, Senior Vice President from 1999 to 2002, and in various capacities since 1982. Mr. Glassman holds a degree in business management and finance from California State University-Long Beach. As the Company's former CEO with decades of experience in Leggett’s senior management team, Mr. Glassman offers exceptional knowledge of the Company’s operations, strategy and governance, as well as customers and end markets. Mr. Glassman also served on the Board of Directors of the National Association of Manufacturers through the end of 2022. He was first elected as a director of the Company in 2002. Mr. Glassman has announced his decision to retire as an executive officer of the Company, effective as of the Company's annual meeting of shareholders, which is expected to be held on May 4, 2023.
Joseph W. McClanathan, age 70, served as President and Chief Executive Officer of the Household Products Division of Energizer Holdings, Inc., a manufacturer of portable power solutions, from 2007 through his retirement in 2012. Previously, he served Energizer as President and Chief Executive Officer of the Energizer Battery Division from 2004 to 2007, as President—North America from 2002 to 2004, and as Vice President—North America from 2000 to 2002. Mr. McClanathan holds a degree in management from Arizona State University. Mr. McClanathan currently serves as a director of Brunswick Corporation, a market leader in the marine industry. Through his leadership experience at Energizer and as a former director of the Retail Industry Leaders Association, Mr. McClanathan offers an exceptional perspective to the Board on manufacturing operations, marketing and development of international capabilities. He was first elected as a director of the Company in 2005.
Judy C. Odom, age 70, served until her retirement in 2002, as Chief Executive Officer and Board Chair at Software Spectrum, Inc., a global business to business software services company, which she co-founded in 1983. Prior to founding Software Spectrum, she was a partner with the international accounting firm, Grant Thornton. Ms. Odom is a licensed Certified Public Accountant and holds a degree in business administration from Texas Tech University. Ms. Odom previously served as a director of Sabre, Inc., a technology solutions provider for the global travel and tourism industry, and of Harte-Hanks, a direct marketing service company. Ms. Odom’s director experience with several companies offers a broad leadership perspective on strategic and operating issues. Her experience co-founding Software Spectrum and growing it to a global Fortune 1000 enterprise before selling it to another public company provides the insight of a long-serving CEO with international operating experience. Ms. Odom was first elected as a director of the Company in 2002. She will retire from the Board, effective as of the annual meeting of shareholders, which is expected to be held on May 4, 2023.
Srikanth Padmanabhan, age 58, has served Cummins Inc., a global manufacturer of engines and power solutions, as a Vice President since 2008 and President of its Engine Business segment since 2016. Previously, he served Cummins as Vice President—Engine Business from 2014 to 2016, Vice President and General Manager of Emission Solutions from 2008 to 2014, and in various other capacities since 1991. Mr. Padmanabhan holds a bachelor’s degree in mechanical engineering from the National Institute of Technology in Trichy, India, a Ph.D. in mechanical engineering from Iowa State University, and has completed the Advanced Management Program at Harvard Business School. With over 30 years at Cummins in a variety of leadership roles, Mr. Padmanabhan offers considerable knowledge of the automotive industry and the industrial sector. He brings extensive experience in managing operations, technology and innovation across a multi-billion-dollar global business. He has lived and worked in India, the United States, Mexico, and the United Kingdom. He was first elected as a director of the Company in 2018.
Jai Shah, age 56, serves as a Group President of Masco Corporation, a Fortune 500 global leader in the design, manufacture and distribution of branded home improvement and building products. In this position since 2018, Mr. Shah has responsibility for operating companies with leading brands in architectural coatings, decorative and outdoor lighting, decorative hardware and wellness businesses in North America. Mr. Shah is also responsible for Masco’s Corporate Strategic Planning activities. He previously served as President of Delta Faucet Company, a Masco business unit, from 2014 to 2018, as Vice President and Chief Human Resources Officer for Masco from 2012 to 2014, and in various capacities since 2003. Prior to Masco, Mr. Shah held a number of senior management positions at Diversey Corporation and served as Senior Auditor for KPMG Peat Marwick Chartered Accountants. Mr. Shah is a Certified Public Accountant and Chartered Professional Accountant (Canada) and holds an MBA from the University of Michigan, as well as bachelor’s and master’s degrees in accounting from the University of Waterloo in Ontario, Canada. Mr. Shah’s range of experience at Masco in a variety of operational, financial and corporate roles offers the Board a broad perspective on
relevant issues facing global corporations, including growth strategy development and implementation, talent management, and adapting to e-business and market innovations. He was first elected as a director of the Company in 2019.
Phoebe A. Wood, age 69, has been a principal in CompaniesWood, a consulting firm specializing in early stage investments, since her 2008 retirement as Vice Chairman and Chief Financial Officer of Brown-Forman Corporation, a diversified consumer products manufacturer, where she had served since 2001. Ms. Wood previously held various positions at Atlantic Richfield Company, an oil and gas company, from 1976 to 2000. Ms. Wood holds a degree in psychology from Smith College and an MBA from UCLA. Ms. Wood is a director of Invesco, Ltd., an independent global investment manager, Pioneer Natural Resources, an independent oil and gas company, and PPL Corporation, a utility and energy services company. From her career in business and various directorships, Ms. Wood provides the Board with a wealth of understanding of the strategic, financial and accounting issues the Board addresses in its oversight role. She was first elected as a director of the Company in 2005.
The Supplemental Item in Part I on page 28, which includes a listing and description of the positions and offices held by the executive officers of the Company, is incorporated into this section by reference. The Company has adopted a code of ethics that applies to its chief executive officer, chief financial officer, and chief accounting officer called the Financial Code of Ethics. The Company has also adopted a Code of Business Conduct and Ethics for directors, officers, and employees and Corporate Governance Guidelines. The Financial Code of Ethics, the Code of Business Conduct and Ethics and the Corporate Governance Guidelines are available on the Company’s website at www.leggett.com/governance. Each of these documents is available in print to any person, without charge, upon request. Such requests may be made to the Company’s Secretary at Leggett & Platt, Incorporated, No. 1 Leggett Road, Carthage, Missouri 64836.
The Company intends to satisfy the disclosure requirement under Item 5.05 of Form 8-K by posting any applicable amendment to, or waiver from its Financial Code of Ethics, within four business days, on its website at www.leggett.com/governance for at least a 12-month period. We routinely post important information to our website. However, the Company’s website does not constitute part of this Annual Report on Form 10-K.
Item 11. Executive Compensation.
The subsections titled “Board’s Oversight of Risk Management,” “Director Compensation,” together with the entire section titled “Executive Compensation and Related Matters” in the Company’s definitive Proxy Statement for the Company’s Annual Meeting of Shareholders to be held on May 4, 2023, are incorporated by reference. No Human Resources and Compensation Committee member had an interlocking relationship as described in Item 407(e)(4) of Regulation S-K.
Item 12. Security Ownership of Certain Beneficial Owners and Management and Related Stockholder Matters.
The entire sections titled “Security Ownership” and “Equity Compensation Plan Information” in the Company’s definitive Proxy Statement for the Company’s Annual Meeting of Shareholders to be held on May 4, 2023, are incorporated by reference.
Item 13. Certain Relationships and Related Transactions, and Director Independence.
The subsections titled “PROPOSAL ONE: Election of Directors,” “Transactions with Related Persons,” “Director Independence and Board Service,” and “Board and Committee Composition and Meetings” in the Company’s definitive Proxy Statement for the Company’s Annual Meeting of Shareholders to be held on May 4, 2023, are incorporated by reference.
Item 14. Principal Accountant Fees and Services.
The subsections titled “Audit and Non-Audit Fees” and “Pre-Approval Procedures for Audit and Non-Audit Services” in the Company’s definitive Proxy Statement for the Company’s Annual Meeting of Shareholders to be held on May 4, 2023, are incorporated by reference.
PART IV
Item 15. Exhibit and Financial Statement Schedules.
(a) Financial Statements and Financial Statement Schedule.
The Reports, Financial Statements and Notes, and Financial Statement Schedule listed below are included in this Form 10-K:
We have omitted other information schedules because the information is inapplicable, not required, or in the financial statements or notes.
We did not file other long-term debt instruments because the total amount of securities authorized under all of these instruments does not exceed ten percent of the total assets of the Company and its subsidiaries on a consolidated basis. The Company agrees to furnish a copy of such instruments to the SEC upon request.
Management’s Annual Report on Internal Control Over Financial Reporting
Management of Leggett & Platt, Incorporated is responsible for establishing and maintaining adequate internal control over financial reporting as defined in Exchange Act Rule 13a-15(f). Leggett & Platt’s internal control over financial reporting is a process designed to provide reasonable assurance regarding the reliability of financial reporting and the preparation of financial statements for external purposes in accordance with accounting principles generally accepted in the United States of America. The Company’s internal control over financial reporting includes those policies and procedures that:
•Pertain to the maintenance of records that, in reasonable detail, accurately and fairly reflect the transactions and dispositions of the assets of Leggett & Platt;
•Provide reasonable assurance that transactions are recorded as necessary to permit preparation of financial statements in accordance with accounting principles generally accepted in the United States of America, and that receipts and expenditures of Leggett & Platt are being made only in accordance with authorizations of management and directors of Leggett & Platt; and
•Provide reasonable assurance regarding prevention or timely detection of unauthorized acquisition, use, or disposition of Leggett & Platt assets that could have a material effect on the financial statements.
Because of its inherent limitations, internal control over financial reporting may not prevent or detect misstatements. Also, projections of any evaluation of effectiveness to future periods are subject to the risk that controls may become inadequate because of changes in conditions, or that the degree of compliance with the policies or procedures may deteriorate.
Under the supervision and with the participation of management (including ourselves), we conducted an evaluation of the effectiveness of Leggett & Platt’s internal control over financial reporting, as of December 31, 2022, based on the criteria in Internal Control—Integrated Framework (2013) issued by the Committee of Sponsoring Organizations of the Treadway Commission. Based on the evaluation under this framework, we concluded that Leggett & Platt’s internal control over financial reporting was effective as of December 31, 2022.
Leggett & Platt’s internal control over financial reporting, as of December 31, 2022, has been audited by PricewaterhouseCoopers LLP, an independent registered public accounting firm, as stated in their report appearing on page 68 of this Form 10-K.
| | | | | | | | |
| /s/ J. MITCHELL DOLLOFF | | /s/ JEFFREY L. TATE |
J. Mitchell Dolloff
President and Chief Executive Officer | | Jeffrey L. Tate
Executive Vice President and Chief Financial Officer |
| | |
| February 24, 2023 | | February 24, 2023 |
Report of Independent Registered Public Accounting Firm
To the Board of Directors and Shareholders of Leggett & Platt, Incorporated
Opinions on the Financial Statements and Internal Control over Financial Reporting
We have audited the accompanying consolidated balance sheets of Leggett & Platt, Incorporated and its subsidiaries (the “Company”) as of December 31, 2022 and 2021, and the related consolidated statements of operations, comprehensive income (loss), changes in equity and cash flows for each of the three years in the period ended December 31, 2022, including the related notes and financial statement schedule listed in the index appearing under Item 15(a) (collectively referred to as the “consolidated financial statements”). We also have audited the Company's internal control over financial reporting as of December 31, 2022, based on criteria established in Internal Control - Integrated Framework (2013) issued by the Committee of Sponsoring Organizations of the Treadway Commission (COSO).
In our opinion, the consolidated financial statements referred to above present fairly, in all material respects, the financial position of the Company as of December 31, 2022 and 2021, and the results of its operations and its cash flows for each of the three years in the period ended December 31, 2022 in conformity with accounting principles generally accepted in the United States of America. Also in our opinion, the Company maintained, in all material respects, effective internal control over financial reporting as of December 31, 2022, based on criteria established in Internal Control - Integrated Framework (2013) issued by the COSO.
Basis for Opinions
The Company's management is responsible for these consolidated financial statements, for maintaining effective internal control over financial reporting, and for its assessment of the effectiveness of internal control over financial reporting, included in the accompanying Management’s Annual Report on Internal Control Over Financial Reporting. Our responsibility is to express opinions on the Company’s consolidated financial statements and on the Company's internal control over financial reporting based on our audits. We are a public accounting firm registered with the Public Company Accounting Oversight Board (United States) (PCAOB) and are required to be independent with respect to the Company in accordance with the U.S. federal securities laws and the applicable rules and regulations of the Securities and Exchange Commission and the PCAOB.
We conducted our audits in accordance with the standards of the PCAOB. Those standards require that we plan and perform the audits to obtain reasonable assurance about whether the consolidated financial statements are free of material misstatement, whether due to error or fraud, and whether effective internal control over financial reporting was maintained in all material respects.
Our audits of the consolidated financial statements included performing procedures to assess the risks of material misstatement of the consolidated financial statements, whether due to error or fraud, and performing procedures that respond to those risks. Such procedures included examining, on a test basis, evidence regarding the amounts and disclosures in the consolidated financial statements. Our audits also included evaluating the accounting principles used and significant estimates made by management, as well as evaluating the overall presentation of the consolidated financial statements. Our audit of internal control over financial reporting included obtaining an understanding of internal control over financial reporting, assessing the risk that a material weakness exists, and testing and evaluating the design and operating effectiveness of internal control based on the assessed risk. Our audits also included performing such other procedures as we considered necessary in the circumstances. We believe that our audits provide a reasonable basis for our opinions.
Definition and Limitations of Internal Control over Financial Reporting
A company’s internal control over financial reporting is a process designed to provide reasonable assurance regarding the reliability of financial reporting and the preparation of financial statements for external purposes in accordance with generally accepted accounting principles. A company’s internal control over financial reporting includes those policies and procedures that (i) pertain to the maintenance of records that, in reasonable detail, accurately and fairly reflect the transactions and dispositions of the assets of the company; (ii) provide reasonable assurance that transactions are recorded as necessary to permit preparation of financial statements in accordance with generally accepted accounting principles, and that receipts and expenditures of the company are being made only in accordance with authorizations of management and directors of the company; and (iii) provide reasonable assurance regarding prevention or timely detection of unauthorized acquisition, use, or disposition of the company’s assets that could have a material effect on the financial statements.
Because of its inherent limitations, internal control over financial reporting may not prevent or detect misstatements. Also, projections of any evaluation of effectiveness to future periods are subject to the risk that controls may become
inadequate because of changes in conditions, or that the degree of compliance with the policies or procedures may deteriorate.
Critical Audit Matter
The critical audit matter communicated below is a matter arising from the current period audit of the consolidated financial statements that was communicated or required to be communicated to the audit committee and that (i) relates to accounts or disclosures that are material to the consolidated financial statements and (ii) involved our especially challenging, subjective, or complex judgments. The communication of critical audit matters does not alter in any way our opinion on the consolidated financial statements, taken as a whole, and we are not, by communicating the critical audit matter below, providing a separate opinion on the critical audit matter or on the accounts or disclosures to which it relates.
Goodwill Impairment Assessment - Bedding Reporting Unit
As described in Notes A and C to the consolidated financial statements, the Company’s consolidated net goodwill balance was $1,474.4 million as of December 31, 2022, and the goodwill associated with the Bedding reporting unit was $900.3 million. Management assesses goodwill for impairment annually and as triggering events may occur. An impairment charge is recognized for the amount by which the carrying amount exceeds the reporting unit's fair value, up to the total amount of goodwill for the reporting unit. Fair value of the reporting unit is determined by management using a combination of two valuation methods, a market approach and an income approach. The market approach estimates fair value by first determining price-to-earnings ratios for comparable publicly traded companies with similar characteristics of the reporting unit. The price-to-earnings ratio for comparable companies is based upon current enterprise value compared to the projected earnings for the next two years. The enterprise value is based upon current market capitalization and includes a control premium. Projected earnings are based upon market analysts’ projections. The earnings ratios are applied to the projected earnings of the comparable reporting unit to estimate fair value. The income approach is based on projected future (debt-free) cash flow that is discounted to present value using factors that consider the timing and risk of future cash flows. Discounted cash flow projections are based on 10-year financial forecasts developed from operating plans and economic projections, sales growth, estimates of future expected changes in operating margins, a discount rate, terminal value growth rates, future capital expenditures and changes in working capital requirements.
The principal considerations for our determination that performing procedures relating to the goodwill impairment assessment of the Bedding reporting unit is a critical audit matter are (i) the significant judgment by management when developing the fair value estimate of the Bedding reporting unit; (ii) the high degree of auditor judgment, subjectivity, and effort in performing procedures and evaluating management’s significant assumptions related to sales growth, estimates of future expected changes in operating margins, and the discount rate used in the discounted cash flow model of the income approach; and (iii) the audit effort involved the use of professionals with specialized skill and knowledge.
Addressing the matter involved performing procedures and evaluating audit evidence in connection with forming our overall opinion on the consolidated financial statements. These procedures included testing the effectiveness of controls relating to management’s goodwill impairment assessment, including controls over the valuation of the Bedding reporting unit. These procedures also included, among others, (i) testing management's process for developing the fair value estimate of the reporting unit; (ii) evaluating the appropriateness of the discounted cash flow model; (iii) testing the completeness and accuracy of underlying data used in the discounted cash flow model; and (iv) evaluating the reasonableness of the significant assumptions used by management related to the sales growth, estimates of future expected changes in operating margins, and the discount rate. Evaluating management’s assumptions related to sales growth and estimates of future expected changes in operating margins involved evaluating whether the assumptions used by management were reasonable considering (i) past and present performance of the reporting unit, (ii) the consistency with external market and industry data, and (iii) whether these assumptions were consistent with evidence obtained in other areas of the audit. Professionals with specialized skill and knowledge were used to assist in the evaluation of the appropriateness of the Company's discounted cash flow model and the reasonableness of the discount rate.
/s/ PricewaterhouseCoopers LLP
St. Louis, Missouri
February 24, 2023
We have served as the Company’s auditor since 1991.
LEGGETT & PLATT, INCORPORATED
Consolidated Statements of Operations
| | | | | | | | | | | | | | | | | |
| | | | | |
| | Year Ended December 31 |
| (Amounts in millions, except per share data) | 2022 | | 2021 | | 2020 |
| Net trade sales | $ | 5,146.7 | | | $ | 5,072.6 | | | $ | 4,280.2 | |
| Cost of goods sold | 4,169.9 | | | 4,034.3 | | | 3,376.1 | |
| Gross profit | 976.8 | | | 1,038.3 | | | 904.1 | |
| Selling and administrative expenses | 427.3 | | | 422.1 | | | 424.4 | |
| Amortization of intangibles | 66.8 | | | 67.5 | | | 65.2 | |
| Impairments | — | | | — | | | 29.4 | |
| Net gain on sale of assets and businesses | (2.5) | | | (29.4) | | | — | |
| Other expense (income), net | .2 | | | (17.9) | | | (22.4) | |
| Earnings before interest and income taxes | 485.0 | | | 596.0 | | | 407.5 | |
| Interest expense | 85.5 | | | 76.5 | | | 82.7 | |
| Interest income | 4.1 | | | 2.6 | | | 3.1 | |
| Earnings before income taxes | 403.6 | | | 522.1 | | | 327.9 | |
| Income taxes | 93.7 | | | 119.5 | | | 74.8 | |
| | | | | |
| | | | | |
| Net earnings | 309.9 | | | 402.6 | | | 253.1 | |
| Earnings attributable to noncontrolling interest, net of tax | (.1) | | | (.2) | | | (.1) | |
| Net earnings attributable to Leggett & Platt, Inc. common shareholders | $ | 309.8 | | | $ | 402.4 | | | $ | 253.0 | |
| | | | | |
| | | | | |
| | | | | |
| | | | | |
| | | | | |
| | | | | |
| Net earnings per share attributable to Leggett & Platt, Inc. common shareholders | | | | | |
| Basic | $ | 2.28 | | | $ | 2.95 | | | $ | 1.86 | |
| Diluted | $ | 2.27 | | | $ | 2.94 | | | $ | 1.86 | |
The accompanying notes are an integral part of these consolidated financial statements.
LEGGETT & PLATT, INCORPORATED
Consolidated Statements of Comprehensive Income (Loss)
| | | | | | | | | | | | | | | | | |
| | Year Ended December 31 |
| (Amounts in millions) | 2022 | | 2021 | | 2020 |
| Net earnings | $ | 309.9 | | | $ | 402.6 | | | $ | 253.1 | |
| Other comprehensive income (loss), net of tax: | | | | | |
| Foreign currency translation adjustments | (71.8) | | | (18.2) | | | 27.8 | |
| Cash flow hedges | (3.5) | | | 10.5 | | | 5.5 | |
| Defined benefit pension plans | 20.1 | | | 21.7 | | | (9.0) | |
| Other comprehensive (loss) income | (55.2) | | | 14.0 | | | 24.3 | |
| Comprehensive income | 254.7 | | | 416.6 | | | 277.4 | |
| Less: comprehensive income attributable to noncontrolling interest | (.1) | | | (.1) | | | — | |
| Comprehensive income attributable to Leggett & Platt, Inc. | $ | 254.6 | | | $ | 416.5 | | | $ | 277.4 | |
The accompanying notes are an integral part of these consolidated financial statements.
LEGGETT & PLATT, INCORPORATED
Consolidated Balance Sheets | | | | | | | | | | | |
| | December 31 |
| (Amounts in millions, except per share data) | 2022 | | 2021 |
| ASSETS | | | |
| Current Assets | | | |
| Cash and cash equivalents | $ | 316.5 | | | $ | 361.7 | |
| Trade receivables, net | 609.0 | | | 620.0 | |
| Other receivables, net | 66.0 | | | 31.5 | |
| | | |
| Inventories | 907.5 | | | 993.2 | |
| Prepaid expenses and other current assets | 59.0 | | | 58.9 | |
| Total current assets | 1,958.0 | | | 2,065.3 | |
| Property, Plant and Equipment—at cost | | | |
| Machinery and equipment | 1,434.0 | | | 1,435.0 | |
| Buildings and other | 791.0 | | | 772.1 | |
| Land | 43.5 | | | 44.1 | |
| Total property, plant and equipment | 2,268.5 | | | 2,251.2 | |
| Less accumulated depreciation | 1,496.1 | | | 1,469.7 | |
| Net property, plant and equipment | 772.4 | | | 781.5 | |
| Other Assets | | | |
| Goodwill | 1,474.4 | | | 1,449.6 | |
| Other intangibles, net | 675.4 | | | 707.8 | |
| Operating lease right-of-use assets | 195.0 | | | 192.6 | |
| Sundry | 110.9 | | | 110.5 | |
| Total other assets | 2,455.7 | | | 2,460.5 | |
| TOTAL ASSETS | $ | 5,186.1 | | | $ | 5,307.3 | |
| LIABILITIES AND EQUITY | | | |
| Current Liabilities | | | |
| Current maturities of long-term debt | $ | 9.4 | | | $ | 300.6 | |
| Current portion of operating lease liabilities | 49.5 | | | 44.5 | |
| Accounts payable | 518.4 | | | 613.8 | |
| Accrued expenses | 261.7 | | | 284.6 | |
| Other current liabilities | 129.1 | | | 92.2 | |
| Total current liabilities | 968.1 | | | 1,335.7 | |
| Long-term Liabilities | | | |
| Long-term debt | 2,074.2 | | | 1,789.7 | |
| Operating lease liabilities | 153.6 | | | 153.0 | |
| Other long-term liabilities | 126.1 | | | 162.9 | |
| Deferred income taxes | 222.7 | | | 217.4 | |
| Total long-term liabilities | 2,576.6 | | | 2,323.0 | |
| Commitments and Contingencies | | | |
| Equity | | | |
Common stock: Preferred stock—authorized, 100.0 shares; none issued; Common stock—authorized, 600.0 shares of $.01 par value; 198.8 shares issued | 2.0 | | | 2.0 | |
| Additional contributed capital | 568.5 | | | 557.9 | |
| Retained earnings | 3,046.0 | | | 2,973.0 | |
| Accumulated other comprehensive loss | (93.5) | | | (38.3) | |
Less treasury stock—at cost (66.2 and 65.4 shares at December 31, 2022 and 2021, respectively) | (1,882.3) | | | (1,846.6) | |
| Total Leggett & Platt, Inc. equity | 1,640.7 | | | 1,648.0 | |
| Noncontrolling interest | .7 | | | .6 | |
| Total equity | 1,641.4 | | | 1,648.6 | |
| TOTAL LIABILITIES AND EQUITY | $ | 5,186.1 | | | $ | 5,307.3 | |
The accompanying notes are an integral part of these consolidated financial statements.
LEGGETT & PLATT, INCORPORATED
Consolidated Statements of Cash Flows | | | | | | | | | | | | | | | | | |
| | Year Ended December 31 |
| (Amounts in millions) | 2022 | | 2021 | | 2020 |
| Operating Activities | | | | | |
| Net earnings | $ | 309.9 | | | $ | 402.6 | | | $ | 253.1 | |
| Adjustments to reconcile net earnings to net cash provided by operating activities: | | | | | |
| Depreciation | 110.2 | | | 116.5 | | | 119.4 | |
| Amortization of intangibles and supply agreements | 69.6 | | | 70.8 | | | 70.0 | |
| Long-lived asset impairment | — | | | — | | | 4.0 | |
| Goodwill impairment | — | | | — | | | 25.4 | |
| Increase (decrease) in provision for losses on accounts and notes receivable | 3.2 | | | (3.4) | | | 17.1 | |
| Writedown of inventories | 17.1 | | | 13.7 | | | 13.6 | |
| Net gain from sales of assets and businesses | (2.5) | | | (29.4) | | | — | |
| | | | | |
| Deferred income tax benefit | (15.7) | | | (8.5) | | | (20.9) | |
| Stock-based compensation | 30.1 | | | 34.2 | | | 29.2 | |
| | | | | |
| Pension (income) expense, net of contributions | (1.7) | | | 1.1 | | | 1.9 | |
| | | | | |
| Other, net | (.8) | | | 11.3 | | | 9.5 | |
| Increases/decreases in, excluding effects from acquisitions and divestitures: | | | | | |
| Accounts and other receivables | (26.6) | | | (75.0) | | | 24.3 | |
| Inventories | 96.1 | | | (305.0) | | | (31.9) | |
| Other current assets | (3.7) | | | (6.7) | | | 4.8 | |
| Accounts payable | (102.1) | | | 63.5 | | | 83.0 | |
| Accrued expenses and other current liabilities | (41.7) | | | (14.4) | | | .1 | |
| Net Cash Provided by Operating Activities | 441.4 | | | 271.3 | | | 602.6 | |
| Investing Activities | | | | | |
| Additions to property, plant and equipment | (100.3) | | | (106.6) | | | (66.2) | |
| Purchases of companies, net of cash acquired | (83.3) | | | (152.6) | | | — | |
| Proceeds from sales of assets and businesses | 4.2 | | | 38.5 | | | 14.8 | |
| | | | | |
| | | | | |
| Other, net | (1.8) | | | (5.5) | | | 2.4 | |
| Net Cash Used for Investing Activities | (181.2) | | | (226.2) | | | (49.0) | |
| Financing Activities | | | | | |
| Additions to long-term debt | 4.7 | | | 492.8 | | | — | |
| Payments on long-term debt | (301.5) | | | (306.6) | | | (157.5) | |
| Change in commercial paper and short-term debt | 301.8 | | | (1.3) | | | (70.3) | |
| Dividends paid | (229.2) | | | (218.3) | | | (211.5) | |
| Issuances of common stock | — | | | 3.5 | | | 1.5 | |
| Purchases of common stock | (60.3) | | | (9.8) | | | (10.6) | |
| | | | | |
| | | | | |
| Proceeds from interest rate treasury lock | — | | | 10.2 | | | — | |
| Additional consideration paid for acquisitions | — | | | (.2) | | | (8.4) | |
| Other, net | (1.7) | | | (3.1) | | | (4.9) | |
| Net Cash Used for Financing Activities | (286.2) | | | (32.8) | | | (461.7) | |
| Effect of Exchange Rate Changes on Cash | (19.2) | | | .5 | | | 9.4 | |
| (Decrease) Increase in Cash and Cash Equivalents | (45.2) | | | 12.8 | | | 101.3 | |
| Cash and Cash Equivalents—Beginning of Year | 361.7 | | | 348.9 | | | 247.6 | |
| Cash and Cash Equivalents—End of Year | $ | 316.5 | | | $ | 361.7 | | | $ | 348.9 | |
| Supplemental Information | | | | | |
| Interest paid (net of amounts capitalized) | $ | 84.0 | | | $ | 66.6 | | | $ | 74.8 | |
| Income taxes paid | 125.2 | | | 126.8 | | | 108.6 | |
| | | | | |
| Property, plant and equipment acquired through finance leases | 1.4 | | | 1.9 | | | 1.8 | |
| Capital expenditures in accounts payable | 3.6 | | | 4.3 | | | 7.1 | |
| Prepaid income taxes and taxes receivable applied against the deemed repatriation tax liability | 6.1 | | | 4.0 | | | 1.2 | |
| | | | | |
The accompanying notes are an integral part of these consolidated financial statements.
LEGGETT & PLATT, INCORPORATED
Consolidated Statements of Changes in Equity
| | | | | | | | | | | | | | | | | | | | | | | | | | | | | | | | | | | | | | | | | | | | | | | | | | | | | |
(Amounts in millions, except per share data) | Common Stock | | Additional
Contributed
Capital | | Retained
Earnings | | Accumulated
Other
Comprehensive
Income (Loss) | | Treasury Stock | | Noncontrolling
Interest | | Total
Equity |
| Shares | | Amount | | Shares | | Amount | |
| Balance, December 31, 2019 | 198.8 | | | $ | 2.0 | | | $ | 536.1 | | | $ | 2,763.9 | | | $ | (76.8) | | | (67.0) | | | $ | (1,883.8) | | | $ | .5 | | | $ | 1,341.9 | |
Effect of accounting change on prior years (See Note A) | — | | | — | | | — | | | (2.5) | | | — | | | — | | | — | | | — | | | (2.5) | |
Adjusted beginning balance,
January 1, 2020 | 198.8 | | | 2.0 | | | 536.1 | | | 2,761.4 | | | (76.8) | | | (67.0) | | | (1,883.8) | | | .5 | | | 1,339.4 | |
| Net earnings attributable to Leggett & Platt, Inc. common shareholders | — | | | — | | | — | | | 253.0 | | | — | | | — | | | — | | | .1 | | | 253.1 | |
| | | | | | | | | | | | | | | | | |
| Dividends declared | — | | | — | | | 5.5 | | | (217.2) | | | — | | | — | | | — | | | — | | | (211.7) | |
| | | | | | | | | | | | | | | | | |
| Treasury stock purchased | — | | | — | | | — | | | — | | | — | | | (.2) | | | (11.2) | | | — | | | (11.2) | |
| Treasury stock issued | — | | | — | | | (21.9) | | | — | | | — | | | 1.0 | | | 29.6 | | | — | | | 7.7 | |
Other comprehensive income (loss), net of tax (See Note P) | — | | | — | | | — | | | — | | | 24.4 | | | — | | | — | | | (.1) | | | 24.3 | |
| | | | | | | | | | | | | | | | | |
| | | | | | | | | | | | | | | | | |
| Stock-based compensation, net of tax | — | | | — | | | 23.5 | | | — | | | — | | | — | | | — | | | — | | | 23.5 | |
| | | | | | | | | | | | | | | | | |
| | | | | | | | | | | | | | | | | |
| Balance, December 31, 2020 | 198.8 | | | $ | 2.0 | | | $ | 543.2 | | | $ | 2,797.2 | | | $ | (52.4) | | | (66.2) | | | $ | (1,865.4) | | | $ | .5 | | | $ | 1,425.1 | |
| | | | | | | | | | | | | | | | | |
| | | | | | | | | | | | | | | | | |
| Net earnings attributable to Leggett & Platt, Inc. common shareholders | — | | | — | | | — | | | 402.4 | | | — | | | — | | | — | | | .2 | | | 402.6 | |
| | | | | | | | | | | | | | | | | |
| Dividends declared | — | | | — | | | 5.2 | | | (226.6) | | | — | | | — | | | — | | | — | | | (221.4) | |
| | | | | | | | | | | | | | | | | |
| Treasury stock purchased | — | | | — | | | — | | | — | | | — | | | (.3) | | | (12.3) | | | — | | | (12.3) | |
| Treasury stock issued | — | | | — | | | (20.2) | | | — | | | — | | | 1.1 | | | 31.1 | | | — | | | 10.9 | |
Other comprehensive income (loss), net of tax (See Note P) | — | | | — | | | — | | | — | | | 14.1 | | | — | | | — | | | (.1) | | | 14.0 | |
| | | | | | | | | | | | | | | | | |
| | | | | | | | | | | | | | | | | |
| Stock-based compensation, net of tax | — | | | — | | | 29.6 | | | — | | | — | | | — | | | — | | | — | | | 29.6 | |
| Purchase of remaining interest in noncontrolling interest | — | | | — | | | (.2) | | | — | | | — | | | — | | | — | | | (1.2) | | | (1.4) | |
| Partial sale of business resulting in noncontrolling interest | — | | | — | | | .3 | | | — | | | — | | | — | | | — | | | 1.2 | | | 1.5 | |
| Balance, December 31, 2021 | 198.8 | | | $ | 2.0 | | | $ | 557.9 | | | $ | 2,973.0 | | | $ | (38.3) | | | (65.4) | | | $ | (1,846.6) | | | $ | .6 | | | $ | 1,648.6 | |
| | | | | | | | | | | | | | | | | |
| | | | | | | | | | | | | | | | | |
| Net earnings attributable to Leggett & Platt, Inc. common shareholders | — | | | — | | | — | | | 309.8 | | | — | | | — | | | — | | | .1 | | | 309.9 | |
| | | | | | | | | | | | | | | | | |
| Dividends declared | — | | | — | | | 5.3 | | | (236.8) | | | — | | | — | | | — | | | — | | | (231.5) | |
| | | | | | | | | | | | | | | | | |
| Treasury stock purchased | — | | | — | | | — | | | — | | | — | | | (1.7) | | | (60.3) | | | — | | | (60.3) | |
| Treasury stock issued | — | | | — | | | (15.2) | | | — | | | — | | | .9 | | | 24.6 | | | — | | | 9.4 | |
Other comprehensive loss, net of tax (See Note P) | — | | | — | | | — | | | — | | | (55.2) | | | — | | | — | | | — | | | (55.2) | |
| | | | | | | | | | | | | | | | | |
| | | | | | | | | | | | | | | | | |
| Stock-based compensation, net of tax | — | | | — | | | 20.5 | | | — | | | — | | | — | | | — | | | — | | | 20.5 | |
| | | | | | | | | | | | | | | | | |
| | | | | | | | | | | | | | | | | |
| Balance, December 31, 2022 | 198.8 | | | $ | 2.0 | | | $ | 568.5 | | | $ | 3,046.0 | | | $ | (93.5) | | | (66.2) | | | $ | (1,882.3) | | | $ | .7 | | | $ | 1,641.4 | |
The accompanying notes are an integral part of these consolidated financial statements.
LEGGETT & PLATT, INCORPORATED
Notes to Consolidated Financial Statements
(Dollar amounts in millions, except per share data)
December 31, 2022, 2021 and 2020
A—Summary of Significant Accounting Policies
PRINCIPLES OF CONSOLIDATION: The consolidated financial statements include the accounts of Leggett & Platt, Incorporated and its majority-owned subsidiaries (“we” or “our”). Management does not expect foreign exchange restrictions to significantly impact the ultimate realization of amounts consolidated in the accompanying financial statements for subsidiaries located outside the United States. All intercompany transactions and accounts have been eliminated in consolidation.
ESTIMATES: The preparation of financial statements in conformity with generally accepted accounting principles in the United States of America ("GAAP") requires management to make estimates and assumptions that affect the reported amounts of assets, liabilities, revenues, and expenses and the accrual and disclosure of loss contingencies.
CASH EQUIVALENTS: Cash equivalents include cash in excess of daily requirements, which is invested in various financial instruments with original maturities of three months or less. Restricted cash was less than $8.0 in the years presented and was primarily related to restricted deposits against a short-term borrowing arrangement of a foreign entity.
TRADE AND OTHER RECEIVABLES AND ALLOWANCE FOR DOUBTFUL ACCOUNTS: Trade receivables are recorded at the invoiced amount and generally do not bear interest. Credit is also occasionally extended in the form of a note receivable to facilitate our customers’ operating cycles. Other notes receivable are established in special circumstances, such as in partial payment for the sale of a business or to support other business opportunities. Other notes receivable generally bear interest at market rates commensurate with the corresponding credit risk on the date of origination.
We participate in trade receivables sales programs in combination with third-party banking institutions and certain customers. Under each of these programs, we sell our entire interest in the trade receivable for 100% of face value, less a discount. Because control of the sold receivable is transferred to the buyer at the time of sale, accounts receivable balances sold are removed from the Consolidated Balance Sheets and the related proceeds are reported as cash provided by operating activities in the Consolidated Statements of Cash Flows. We had approximately $55.0 and $35.0 of trade receivables that were sold and removed from our Consolidated Balance Sheets at December 31, 2022 and 2021, respectively.
While we utilize the above programs as tools in our cash flow management, and offer them as options to facilitate customer operating cycles, if there were to be a cessation of these programs, we do not expect it would materially impact our operating cash flows or liquidity.
The allowance for doubtful accounts is an estimate of the amount of probable credit losses. Allowances and nonaccrual status designations are determined by individual account reviews by management and are based on several factors, such as the length of time that receivables were past due, the financial health of the companies involved, industry and macroeconomic considerations, and historical loss experience. We also utilize a pool approach to group our receivables with similar risk characteristics. Our pools correspond with our business units, which generally have similar terms, industry-specific conditions, and historical or expected loss patterns. Reserves are established for each pool based on their level of risk exposure. When credit deterioration occurs on a specific customer within a pool, we evaluate the receivable separately to estimate the expected credit loss, based on the specific risk characteristics. A qualitative reserve is also established for any current macroeconomic conditions or reasonable and supportable forecasts that could impact the expected collectability of all or a portion of our receivables portfolio. On January 1, 2020, we adopted ASU 2016-13 "Financial Instruments—Credit Losses" (Topic 326) using the modified retrospective approach. As a result, the allowance for doubtful accounts on trade accounts receivable increased $3.3 and beginning retained earnings decreased $2.5 as presented in the Consolidated Statements of Changes in Equity. Account balances are charged against the allowance when it is probable the receivable will not be recovered. Interest income is not recognized for nonperforming accounts that are placed on nonaccrual status. For accounts on nonaccrual status, any interest payments received are applied against the balance of the nonaccrual account.
ACCOUNTS PAYABLE: Accounts payable are recorded at the invoiced amount for services at the time they are rendered and for inventory based on the delivery terms of the purchase. We sometimes utilize third-party programs that allow our suppliers to be paid earlier at a discount. While these programs assist us in negotiating payment terms with our
suppliers, we continue to make payments based on our customary terms. A supplier can elect to take payment from a third party earlier with a discount, and in that case, we pay the third party on the original due date of the invoice. Contracts with our suppliers are negotiated independently of supplier participation in the programs, and we cannot increase payment terms pursuant to the programs. The accounts payable settled through the third-party programs, which remain on our Consolidated Balance Sheets, were approximately $80.0 and $130.0 at December 31, 2022 and 2021, respectively.
While we utilize the above programs as tools in our cash flow management, and offer them as options to facilitate vendor operating cycles, if there were to be a cessation of these programs, we do not expect it would materially impact our operating cash flows or liquidity.
INVENTORIES:
The following table recaps the components of inventory for each period presented:
| | | | | | | | | | | |
| December 31, 2022 | | December 31, 2021 |
| Finished goods | $ | 389.9 | | | $ | 429.1 | |
| Work in process | 71.1 | | | 66.9 | |
| Raw materials and supplies | 446.5 | | | 497.2 | |
| | | |
| Inventories | $ | 907.5 | | | $ | 993.2 | |
All inventories are stated at the lower of cost or net realizable value. For the majority of our inventories, we use the first-in, first-out method which is representative of our standard costs (includes materials, labor, and production overhead at normal production capacity). Remaining inventories are valued using an average-cost method. Inventories are reviewed at least quarterly for slow-moving and potentially obsolete items using actual inventory turnover and, if necessary, are written down to estimated net realizable value. Restructuring activity and decisions to narrow product offerings (as discussed in Note E) also impact the estimated net realizable value of inventories. ACQUISITIONS: When acquisitions occur, we value the assets acquired, liabilities assumed, and any noncontrolling interest in acquired companies at estimated acquisition-date fair values. Goodwill is measured as the excess amount of consideration transferred, compared to fair value of the assets acquired and the liabilities assumed. While we use our best estimates and assumptions to accurately value these items at the acquisition date (as well as contingent consideration where applicable), our estimates are inherently uncertain and subject to refinement during the measurement period, which may be up to one year from the acquisition date.
We utilize the following methodologies in determining fair value:
•Inventory is valued at current replacement cost for raw materials, with a step-up for work in process and finished goods items that reflects the amount of ultimate profit earned as of the valuation date.
•Other working capital items are generally recorded at carrying value, unless there are known conditions that would impact the ultimate settlement amount of the particular item.
•Buildings and machinery are valued at an estimated replacement cost for an asset of comparable age and condition. Market pricing of comparable assets is used to estimate replacement cost where available.
•The most common identified intangible assets are customer relationships, technology, and tradenames. Discount rates discussed below are typically derived from a weighted-average cost of capital analysis and adjusted to reflect inherent risks.
◦Customer relationships are valued using an excess earnings method using various inputs, such as the estimated customer attrition rate, revenue growth rate and cost of sales, the amount of contributory asset charges, and an appropriate discount rate. The economic useful life is determined based on historical customer turnover rates.
◦Technology and tradenames are typically valued using a relief-from-royalty method, with various inputs, such as comparable market royalty rates for items of similar value, future earnings forecast, an appropriate discount rate, and a replacement rate for technology. The economic useful life is determined based on the expected life of the technology and tradenames.
LOSS CONTINGENCIES: Loss contingencies are accrued when a loss is probable and reasonably estimable. If a range of outcomes is possible, the most likely outcome is used to accrue these costs. If no outcome is more likely, we accrue at the minimum amount of the range. Any insurance recovery is recorded separately if it is determined that a recovery is probable. Legal fees are accrued when incurred.
PROPERTY, PLANT AND EQUIPMENT: Property, plant and equipment is stated at cost, less accumulated depreciation. Assets are depreciated by the straight-line method and salvage value, if any, is assumed to be minimal. The table below presents the depreciation periods of the estimated useful lives of our property, plant and equipment. Accelerated methods are used for tax purposes. | | | | | | | | | | | |
| | Useful Life Range | | Weighted Average Life |
| Machinery and equipment | 3-30 years | | 12 years |
| Buildings | 5-40 years | | 26 years |
| Other items | 3-15 years | | 11 years |
Property is reviewed for recoverability at year end and whenever events or changes in circumstances indicate that its carrying value may not be recoverable as discussed above.
LEASES: At the inception of a contract, we assess whether a contract is, or contains, a lease. Our assessment is based on whether the contract involves the use of a distinct identified asset, whether we obtain the right to substantially all the economic benefit of the asset, and whether we have the right to direct the use of the asset.
Where renewal or termination options are reasonably likely to be exercised, we recognize the option as part of the right-of-use asset and lease liability. Leases with an initial term of 12 months or less are not recorded on the balance sheet; we recognize lease expense for these leases on a straight-line basis over the lease term.
As most of our leases do not provide an implicit rate, we use our incremental borrowing rate in determining the present value of the lease payments. We apply a portfolio approach for determining the incremental borrowing rate based on the applicable lease terms and the economic environment in the various regions where our operations are located.
GOODWILL: Goodwill results from the acquisition of existing businesses. It is assessed for impairment annually and as triggering events may occur. Our seven reporting units are the business groups one level below the operating segment level for which discrete financial information is available. We perform our annual review in the second quarter of each year using a quantitative analysis, comparing the fair value of each reporting unit with its carrying amount. An impairment charge is recognized for the amount by which the carrying amount exceeds the reporting unit's fair value, up to the total amount of goodwill for the reporting unit.
Fair value of reporting units is determined using a combination of two valuation methods: a market approach and an income approach. Absent an indication of fair value from a potential buyer or similar specific transaction, we believe that the use of these two methods provides a reasonable estimate of a reporting unit’s fair value. Assumptions common to both methods are operating plans and economic projections, which are used to project future revenues, earnings, and after-tax cash flows for each reporting unit. These assumptions are applied consistently for both methods.
The market approach estimates fair value by first determining price-to-earnings ratios for comparable publicly-traded companies with similar characteristics of the reporting unit. The price-to-earnings ratio for comparable companies is based upon current enterprise value compared to the projected earnings for the next two years. The enterprise value is based upon current market capitalization and includes a control premium. Projected earnings are based upon market analysts’ projections. The earnings ratios are applied to the projected earnings of the comparable reporting unit to estimate fair value. Management believes this approach is appropriate because it provides a fair value estimate using multiples from entities with operations and economic characteristics comparable to our reporting units.
The income approach is based on projected future (debt-free) cash flow that is discounted to present value using factors that consider the timing and risk of future cash flows. Management believes that this approach is appropriate because it provides a fair value estimate based upon the reporting unit’s expected long-term operating cash flow performance. Discounted cash flow projections are based on 10-year financial forecasts developed from operating plans and economic projections noted above, sales growth, estimates of future expected changes in operating margins, an appropriate discount rate, terminal value growth rates, future capital expenditures, and changes in working capital requirements. There are inherent assumptions and judgments required in the analysis of goodwill impairment. It is possible that assumptions underlying the impairment analysis will change in such a manner that impairment in value may occur in the future.
OTHER INTANGIBLE ASSETS: Substantially all other intangible assets are amortized using the straight-line method over their estimated useful lives and are evaluated for impairment using a process similar to that used in evaluating the recoverability of property, plant and equipment. | | | | | | | | | | | |
| | Useful Life Range | | Weighted Average Life |
| Other intangible assets | 1-20 years | | 15 years |
STOCK-BASED COMPENSATION: The cost of employee services received in exchange for all equity awards granted is based on the fair market value of the award as of the grant date. Expense is recognized net of an estimated forfeiture rate using the straight-line method over the vesting period of the award.
REVENUE RECOGNITION: We recognize revenue when performance obligations, under the terms of a contract with our customers, are satisfied. Substantially all of our revenue is recognized upon transfer of control of our products to our customers, which is generally upon shipment from our facilities or upon delivery to our customers' facilities, and is dependent on the terms of the specific contract. This conclusion considers the point at which our customers have the ability to direct the use of and obtain substantially all of the remaining benefits of the products that were transferred. Substantially all performance obligations are satisfied within one year or less.
The amount of consideration we receive and revenue we recognize varies with changes in various sales allowances, discounts, and rebates (variable consideration) that we offer to our customers. We reduce revenue by our estimates of variable consideration, based on contract terms and historical experience. Changes in estimates of variable consideration for the periods presented were not material.
Some of our customers have the right to return products after transfer. For this right, we recognize an estimated refund liability and a corresponding reduction to revenue, based on historical returns experience. We also record an asset and a corresponding reduction to cost of sales for our right to recover products from customers upon settling the refund liability. We reduce the carrying amount of these assets by estimates of costs associated with the recovery and any additional expected reduction in value. Our refund liability and the corresponding asset associated with our right to recover products from our customers were immaterial for the periods presented.
We expect that at contract inception, the time period between when we transfer a promised good to our customer and our receipt of payment from that customer for that good will be one year or less (our typical trade terms are 30 to 60 days for U.S. customers and up to 90 days for our international customers). We generally expense costs of obtaining a contract because the amortization period would be one year or less. Sales, value added, and other taxes collected in connection with revenue-producing activities are excluded from revenue.
SHIPPING AND HANDLING FEES AND COSTS: Shipping and handling costs are included as a component of “Cost of goods sold.”
RESTRUCTURING COSTS: Restructuring costs are items such as employee termination, contract termination, plant closure, and asset relocation costs related to exit activities or workforce reductions. Restructuring-related items are primarily inventory writedowns. We recognize a liability for costs associated with an exit or disposal activity when the liability is incurred. Certain termination benefits for which employees are required to render service are recognized ratably over the respective future service periods.
INCOME TAXES: The provision for income taxes is determined using the asset and liability approach of accounting for income taxes. Under this approach, deferred taxes represent the future tax consequences expected to occur when the reported amounts of assets and liabilities are recovered or paid. The provision for income taxes represents income taxes paid or payable for the current year plus the change in deferred taxes during the year. Deferred taxes result from differences between the financial and tax basis of our assets and liabilities and are adjusted for changes in tax rates and laws, as appropriate. A valuation allowance is provided to reduce deferred tax assets when management cannot conclude that it is more likely than not that a tax benefit will be realized. A provision is also made for incremental withholding taxes on undistributed earnings of foreign subsidiaries and related companies to the extent that such earnings are not deemed to be indefinitely invested.
The calculation of our U.S., state, and foreign tax liabilities involves dealing with uncertainties in the application of complex global tax laws. We recognize potential liabilities for anticipated tax issues which might arise in the U.S. and other tax jurisdictions based on management’s estimate of whether, and the extent to which, additional taxes will be due. If payment of these amounts ultimately proves to be unnecessary, the reversal of the liabilities would result in tax benefits being recognized in the period when we determine the liabilities are no longer necessary. Conversely, if the estimate of tax liabilities proves to be less than the ultimate tax assessment, a further charge to tax expense would result.
CONCENTRATION OF CREDIT RISKS, EXPOSURES, AND FINANCIAL INSTRUMENTS: We manufacture, market, and distribute products for the various end markets described in Note F. Our operations are principally located in the United States, although we also have operations in Europe, China, Canada, Mexico, and other countries. We maintain allowances for potential credit losses. We perform ongoing credit evaluations of our customers’ financial conditions and generally require no collateral from our customers, some of which are highly leveraged. Management also monitors the financial condition and status of other notes receivable. Other notes receivable have historically primarily consisted of notes accepted as partial payment for the divestiture of a business or to support other business opportunities. Some of these companies are highly leveraged and the notes are not fully collateralized.
We have no material guarantees or liabilities for product warranties which require disclosure.
From time to time, we will enter into contracts to hedge foreign currency denominated transactions and interest rates related to our debt. To minimize the risk of counterparty default, only highly-rated financial institutions that meet certain requirements are used. We do not anticipate that any of the financial institution counterparties will default on their obligations.
The carrying value of cash and short-term financial instruments approximates fair value due to the short maturity of those instruments
OTHER RISKS: Although we obtain insurance for workers’ compensation, automobile, product and general liability, property loss, and medical claims, we have elected to retain a significant portion of expected losses through the use of deductibles. Accrued liabilities include estimates for unpaid reported claims and for claims incurred but not yet reported. Provisions for losses are recorded based upon reasonable estimates of the aggregate liability for claims incurred utilizing our prior experience and information provided by our third-party administrators and insurance carriers.
The results of operations for the year ended December 31, 2022 are not necessarily indicative of future results. The COVID-19 pandemic and related supply chain constraints have impacted, and could continue to impact, the global economy. Our operating results will be subject to fluctuations based on general economic conditions, and the extent to which COVID-19 may ultimately impact our business will depend on future developments.
DERIVATIVE FINANCIAL INSTRUMENTS: We utilize derivative financial instruments to manage market and financial risks related to foreign currency and interest rates. We seek to use derivative contracts that qualify for hedge accounting treatment; however, some instruments that economically manage currency risk may not qualify for hedge accounting treatment. It is our policy not to speculate using derivative instruments.
Under hedge accounting, we formally document our hedge relationships, including identification of the hedging instruments and the hedged items, as well as our risk management objectives and strategies for entering into the hedge transaction. The process includes designating derivative instruments as hedges of specific assets, liabilities, firm commitments, or forecasted transactions. We also formally assess both at inception and on a quarterly basis thereafter, whether the underlying transactions are probable of occurring. If it is determined that an underlying transaction is probable of not occurring, deferred gains or losses are recorded in the Consolidated Statements of Operations on the same line item as the hedged item.
On the date the contract is entered into, we designate the derivative as one of the following types of hedging instruments and account for it as follows:
Cash Flow Hedge—The hedge of a forecasted transaction or of the variability of cash flows to be received or paid, related to a recognized asset or liability or anticipated transaction, is designated as a cash flow hedge. The change in fair value is recorded in accumulated other comprehensive income. When the hedged item impacts the income statement, the gain or loss included in "Other comprehensive income (loss)" is reported on the same line of the Consolidated Statements of Operations as the hedged item, to match the gain or loss on the derivative to the gain or loss on the hedged item. Specifically, we regularly use currency cash flow hedges to manage risk associated with exchange rate volatility of various currencies and occasionally use interest rate cash flow hedges to manage interest rate risks. Settlements associated with the sale or production of product are presented in operating cash flows, and settlements associated with debt issuance are presented in financing cash flows.
Fair Value Hedge and Derivatives not Designated as Hedging Instruments—These derivatives typically manage foreign currency risk associated with subsidiaries’ assets and liabilities or unrecognized firm commitments. The changes in fair value of the derivative, along with the gain or loss on the hedged item that is attributable to the hedged risk, are recorded in earnings and reported in the Consolidated Statements of Operations, and in the case of fair value hedges, on the same line as the hedged item. Cash flows from settled contracts are presented in the category consistent with the nature of the item being hedged.
FOREIGN CURRENCY TRANSLATION: The functional currency for most foreign operations is the local currency. The translation of foreign currencies into U.S. dollars is performed for balance sheet accounts using current exchange rates in effect at the balance sheet date and for income and expense accounts using monthly average exchange rates. The cumulative effects of translating the functional currencies into the U.S. dollar are included in comprehensive income.
RECLASSIFICATIONS: Certain immaterial reclassifications have been made to the prior years’ information in the Consolidated Financial Statements and related notes to conform to the 2022 presentation.
NEW ACCOUNTING GUIDANCE: The Financial Accounting Standards Board (FASB) regularly issues updates to the FASB Accounting Standards Codification that are communicated through issuance of an Accounting Standards Update (ASU).
None of the accounting guidance issued by the FASB effective for current and future periods has had a material impact on our current financial statements, and we do not believe it will have a material impact on our future financial statements.
B—Revenue
Revenue by Product Family
We disaggregate revenue by customer group, which is the same as our product families for each of our segments, as we believe this best depicts how the nature, amount, timing, and uncertainty of our revenue and cash flows are affected by economic factors. For information regarding our segment structure, see Note F. | | | | | | | | | | | | | | | | | |
| | Year Ended December 31 |
| | 2022 | | 2021 | | 2020 |
| Bedding Products | | | | | |
| Bedding Group | $ | 2,356.3 | | | $ | 2,455.9 | | | $ | 2,039.3 | |
| | 2,356.3 | | | 2,455.9 | | | 2,039.3 | |
| Specialized Products | | | | | |
| Automotive Group | 846.5 | | | 801.4 | | | 719.0 | |
| Aerospace Products Group | 120.9 | | | 102.9 | | | 102.4 | |
Hydraulic Cylinders Group 1 | 150.9 | | | 94.6 | | | 69.8 | |
| 1,118.3 | | | 998.9 | | | 891.2 | |
| Furniture, Flooring & Textile Products | | | | | |
| Home Furniture Group | 398.0 | | | 434.3 | | | 320.9 | |
| Work Furniture Group | 318.7 | | | 284.1 | | | 231.1 | |
| Flooring & Textile Products Group | 955.4 | | | 899.4 | | | 797.7 | |
| | 1,672.1 | | | 1,617.8 | | | 1,349.7 | |
| | $ | 5,146.7 | | | $ | 5,072.6 | | | $ | 4,280.2 | |
1 On August 26, 2022, we acquired a leading global manufacturer of hydraulic cylinders for heavy construction equipment (see Note R).
C—Impairment Charges
Pretax impairment charges are reported in “Impairments” in the Consolidated Statements of Operations and summarized in the following table. We did not have any impairment charges in 2022 or 2021.
| | | | | | | | | | | | | | | | | | | | | | | | | |
| | | |
| Year ended December 31, 2020 | | | | | | | | |
| | Goodwill Impairment | | Other Long-Lived Asset Impairments | | Total Impairments | | | | | | | | |
| Bedding Products | $ | — | | | $ | .3 | | | $ | .3 | | | | | | | | | |
| Specialized Products | 25.4 | | | — | | | 25.4 | | | | | | | | | |
| Furniture, Flooring & Textile Products | — | | | .2 | | | .2 | | | | | | | | | |
Unallocated 1 | — | | | 3.5 | | | 3.5 | | | | | | | | | |
| Total impairment charges | $ | 25.4 | | | $ | 4.0 | | | $ | 29.4 | | | | | | | | | |
1 This charge was incurred to write off stock associated with a prior year divestiture that filed bankruptcy in 2020.
Goodwill Impairment Testing
As discussed in Note A, we test goodwill for impairment at the reporting unit level (the business groups that are one level below the operating segments) when triggering events occur, or at least annually. We perform our annual goodwill impairment testing in the second quarter. The 2022 and 2021 goodwill impairment testing indicated no impairments.
The annual goodwill impairment testing performed in the second quarter of 2020 resulted in a $25.4 non-cash goodwill impairment charge with respect to our Hydraulic Cylinders reporting unit (which is a part of the Specialized Products segment) and reflected the complete write-off of the goodwill associated with this reporting unit at that time.
The fair values of our reporting units in relation to their respective carrying values and significant assumptions used are presented in the tables below. If actual results differ materially from estimates used in these calculations, we could incur future impairment charges.
| | | | | | | | | | | | | | | | | | | | | | | | | | |
| 2022 |
| Fair Value over Carrying Value divided by Carrying Value | | December 31, 2022 Goodwill Value | | 10-year Compound
Annual Growth Rate
Range for Sales | | Terminal Values Long-term Growth Rate for Debt-Free Cash Flow | | Discount Rate Ranges |
Less than 50% 1 | | $ | 107.8 | | | 3.7 - 8.5% | | 3.0 | % | | 11.8% |
50% - 100% 2 | | 998.7 | | | 2.6 - 4.8 | | 3.0 | | | 10.3 |
101% - 300% | | 248.3 | | | 1.4 - 2.6 | | 3.0 | | | 9.8 - 10.3 |
Greater than 300% | | 119.6 | | | 8.2 | | 3.0 | | | 11.8 |
| | $ | 1,474.4 | | | 1.4% - 8.5% | | 3.0 | % | | 9.8% - 11.8% |
| | | | | | | | | | | | | | | | | | | | | | | | | | |
| 2021 |
| Fair Value over Carrying Value divided by Carrying Value | | December 31, 2021 Goodwill Value | | 10-year Compound Annual Growth Rate Range for Sales | | Terminal Values Long-term Growth Rate for Debt-Free Cash Flow | | Discount Rate Ranges |
Less than 50% 1 | | $ | 67.5 | | | 7.8% | | 3.0 | % | | 10.0% |
50% - 100% 2 | | 101.0 | | | 5.5 | | 3.0 | | | 9.0 |
101% - 300% | | 1,086.9 | | | 3.1 - 3.3 | | 3.0 | | | 8.0 - 8.5 |
Greater than 300% | | 194.2 | | | 2.9 - 10.4 | | 3.0 | | | 9.0 |
| | $ | 1,449.6 | | | 2.9% - 10.4% | | 3.0 | % | | 8.0% - 10.0% |
1 This category includes two reporting units (Aerospace and Hydraulic Cylinders) for 2022 and the Aerospace unit for 2021.
•The fair value of our Aerospace reporting unit exceeded its carrying value by 40% at our second quarter 2022 testing date as compared to 28% in 2021. Goodwill associated with the Aerospace reporting unit was $66.3 at December 31, 2022 and $67.5 at December 31, 2021.
•The fair value of our Hydraulic Cylinders reporting unit exceeded its carrying value by 32% at our second quarter 2022 testing date as compared to 86% in 2021. At the time of our annual goodwill impairment testing in both 2022 and 2021, there was no goodwill associated with this reporting unit, but an August 2022 acquisition (see Note R) added goodwill. At December 31, 2022, the goodwill balance was $41.5. 2 This category includes two reporting units (Work Furniture and Bedding) for 2022 and the Work Furniture unit for 2021.
•The fair value of our Work Furniture reporting unit exceeded its carrying value by 78% at our second quarter 2022 testing date as compared to 85% in 2021. Goodwill associated with the Work Furniture reporting unit was $98.4 at December 31, 2022 and $101.0 at December 31, 2021.
•The fair value of our Bedding unit exceeded its carrying value by 54% at our second quarter 2022 testing date as compared to 171% in 2021. Goodwill associated with the Bedding reporting unit was $900.3 at December 31, 2022 and $908.3 at December 31, 2021.
Other long-lived assets
As discussed in Note A, we test other long-lived assets for recoverability at year end and whenever events or changes in circumstances indicate that the carrying value may not be recoverable. Fair value, and the resulting impairment charges noted above, was based primarily upon offers from potential buyers or third party estimates of fair value less selling costs.
D—Goodwill and Other Intangible Assets
The changes in the carrying amounts of goodwill are as follows:
| | | | | | | | | | | | | | | | | | | | | | | |
| Bedding Products | | Specialized
Products | | Furniture, Flooring & Textile Products | | Total |
| Net goodwill as of January 1, 2021 | $ | 856.9 | | | $ | 187.0 | | | $ | 344.9 | | | $ | 1,388.8 | |
| Additions for current year acquisitions | 58.3 | | | 8.2 | | | 4.4 | | | 70.9 | |
| | | | | | | |
| Allocations to divested businesses | (1.3) | | | — | | | — | | | (1.3) | |
| | | | | | | |
| | | | | | | |
| Foreign currency translation adjustment | (5.6) | | | (2.5) | | | (.7) | | | (8.8) | |
| Net goodwill as of December 31, 2021 | 908.3 | | | 192.7 | | | 348.6 | | | 1,449.6 | |
| Additions for current year acquisitions | — | | | 39.0 | | | 3.5 | | | 42.5 | |
| Adjustments to prior year acquisitions | — | | | .3 | | | — | | | .3 | |
| Allocations to divested businesses | (.3) | | | — | | | — | | | (.3) | |
| | | | | | | |
| | | | | | | |
| Foreign currency translation adjustment | (7.7) | | | (4.6) | | | (5.4) | | | (17.7) | |
| Net goodwill as of December 31, 2022 | $ | 900.3 | | | $ | 227.4 | | | $ | 346.7 | | | $ | 1,474.4 | |
| | | | | | | |
| Net goodwill as of December 31, 2022 is comprised of: | | | | | | | |
| Gross goodwill | $ | 905.7 | | | $ | 319.5 | | | $ | 597.3 | | | $ | 1,822.5 | |
| Accumulated impairment losses | (5.4) | | | (92.1) | | | (250.6) | | | (348.1) | |
| Net goodwill as of December 31, 2022 | $ | 900.3 | | | $ | 227.4 | | | $ | 346.7 | | | $ | 1,474.4 | |
The gross carrying amount and accumulated amortization by intangible asset class and intangible assets acquired during the periods presented, included in "Other intangibles, net" on the Consolidated Balance Sheets, are as follows:
| | | | | | | | | | | | | | | | | | | | | | | | | | | | | |
| December 31, 2022 | | Year Ended December 31, 2022 |
| Gross Carrying Amount | | Accumulated Amortization | | Net Intangibles | | Gross carrying amounts of items acquired | | Weighted average amortization in years for items acquired |
| Customer-related intangibles | $ | 622.6 | | | $ | 206.1 | | | $ | 416.5 | | | $ | 22.0 | | | 15.0 |
| Technology | 196.6 | | | 51.7 | | | 144.9 | | | 13.4 | | | 13.9 |
| Patents and trademarks | 145.7 | | | 52.8 | | | 92.9 | | | 8.2 | | | 15.6 |
| Non-compete agreements, supply agreements and other | 66.9 | | | 45.8 | | | 21.1 | | | .3 | | | 4.8 |
| Total | $ | 1,031.8 | | | $ | 356.4 | | | $ | 675.4 | | | $ | 43.9 | | | 14.7 |
| | | | | | | | | |
| December 31, 2021 | | Year Ended December 31, 2021 |
| Customer-related intangibles | $ | 610.6 | | | $ | 172.0 | | | $ | 438.6 | | | $ | 64.9 | | | 15.0 |
| Technology | 183.5 | | | 38.4 | | | 145.1 | | | 5.4 | | | 8.0 |
| Patents and trademarks | 139.8 | | | 47.2 | | | 92.6 | | | 8.7 | | | 15.1 |
| Non-compete agreements, supply agreements and other | 72.0 | | | 40.5 | | | 31.5 | | | 4.3 | | | 2.9 |
| Total | $ | 1,005.9 | | | $ | 298.1 | | | $ | 707.8 | | | $ | 83.3 | | | 13.9 |
The gross carrying amount of acquired intangible assets related to business acquisitions was $40.6 and $80.3 at December 31, 2022 and 2021, respectively. For information regarding our business acquisitions, see Note R.
Estimated amortization expense for the items above included in our December 31, 2022 Consolidated Balance Sheets in each of the next five years is as follows:
| | | | | |
| 2023 | $ | 70.6 | |
| 2024 | 63.7 | |
| 2025 | 60.7 | |
| 2026 | 59.1 | |
| 2027 | 58.3 | |
E—Restructuring and Restructuring-Related Charges
We implemented various cost reduction initiatives to improve our operating cost structures in the periods presented. These cost initiatives have, among other actions, included workforce reductions and the closure or consolidation of certain operations.
The table below presents all restructuring and restructuring-related activity for the periods presented:
| | | | | | | | | | | | | | | | | |
| | Year Ended December 31 |
| | 2022 | | 2021 | | 2020 |
| | | | | |
| Charged to other expense (income), net: | | | | | |
Severance and other restructuring costs 1 | $ | 1.4 | | | $ | (.3) | | | $ | 7.6 | |
| | | | | |
| Charged to cost of goods sold: | | | | | |
| Inventory obsolescence and other | — | | | — | | | .3 | |
| | | | | |
| | | | | |
| | | | | |
| | | | | |
| | | | | |
| Total restructuring and restructuring-related costs | $ | 1.4 | | | $ | (.3) | | | $ | 7.9 | |
| Amount of total that represents cash charges | $ | 1.4 | | | $ | (.3) | | | $ | 7.6 | |
1 In response to the effect the COVID-19 pandemic had on the nature and focus of our operations during 2020, we incurred $6.5 severance expense, primarily for permanent workforce reductions associated with changes in management and organizational structure. The accrued liabilities associated with restructuring initiatives at December 31, 2022, 2021, and 2020 were $.6, $1.3, and $4.1, respectively. Divestitures
During the years presented we divested a few small businesses in our Bedding Products segment which had immaterial amounts of annual external sales and EBIT. There were no material gains or losses recognized on the sale of these businesses. The aggregated selling price for 2022, 2021, and 2020 were $2.0, $7.0, and $11.0, respectively.
F—Segment Information
We have three operating segments that supply a wide range of products:
•Bedding Products: This segment supplies a variety of components and machinery used by bedding manufacturers in the production and assembly of their finished products, as well as produces private label finished mattresses for bedding brands and adjustable bed bases. This segment is also vertically integrated into the production and supply of specialty foam chemicals, steel rod, and drawn steel wire to our own operations and to external customers. Our trade customers for wire make mechanical springs and many other end products.
•Specialized Products: From this segment, we supply lumbar support systems, seat suspension systems, motors and actuators, and control cables used by automotive manufacturers. We also produce and distribute tubing and tube assemblies for the aerospace industry and engineered hydraulic cylinders used in the material-handling and construction industries.
•Furniture, Flooring & Textile Products: Operations in this segment supply a wide range of components for residential and work furniture manufacturers, as well as select lines of private label finished furniture. We also produce or distribute carpet cushion, hard surface flooring underlayment, and textile and geo components.
Our reportable segments are the same as our operating segments, which also correspond with our management organizational structure. Each reportable segment has a vice president who has accountability to, and maintains regular
contact with, our chief executive officer, who is the chief operating decision maker (CODM). The operating results and financial information reported through the segment structure are regularly reviewed and used by the CODM to evaluate segment performance, allocate overall resources, and determine management incentive compensation.
The accounting principles used in the preparation of the segment information are the same as those used for the consolidated financial statements. We evaluate performance based on Earnings Before Interest and Taxes (EBIT). Intersegment sales are made primarily at prices that approximate market-based selling prices. Centrally incurred costs are allocated to the segments based on estimates of services used by the segment. Certain of our general and administrative costs and miscellaneous corporate income and expenses are allocated to the segments based on sales or other appropriate metrics. These allocated corporate costs include depreciation and other costs and income related to assets that are not allocated or otherwise included in the segment assets.
A summary of segment results for the periods presented are as follows: | | | | | | | | | | | | | | | | | | | | | | | | | | | | | |
| | Year Ended December 31 |
| | Trade 1 Sales | | Inter-
Segment
Sales | | Total Segment
Sales | | EBIT | | Depreciation and Amortization |
| 2022 | | | | | | | | | |
| Bedding Products | $ | 2,356.3 | | | $ | 40.5 | | | $ | 2,396.8 | | | $ | 219.6 | | | $ | 104.1 | |
| Specialized Products | 1,118.3 | | | 2.2 | | | 1,120.5 | | | 99.4 | | | 40.5 | |
| Furniture, Flooring & Textile Products | 1,672.1 | | | 14.5 | | | 1,686.6 | | | 165.0 | | | 23.2 | |
Intersegment eliminations and other 2 | | | | | | | 1.0 | | | 12.0 | |
| | | | | | | | | |
| | $ | 5,146.7 | | | $ | 57.2 | | | $ | 5,203.9 | | | $ | 485.0 | | | $ | 179.8 | |
| 2021 | | | | | | | | | |
Bedding Products 3 | $ | 2,455.9 | | | $ | 44.1 | | | $ | 2,500.0 | | | $ | 321.3 | | | $ | 106.8 | |
| Specialized Products | 998.9 | | | 3.6 | | | 1,002.5 | | | 115.9 | | | 44.8 | |
| Furniture, Flooring & Textile Products | 1,617.8 | | | 13.4 | | | 1,631.2 | | | 159.5 | | | 24.0 | |
Intersegment eliminations and other 2 | | | | | | | (.7) | | | 11.7 | |
| | | | | | | | | |
| | $ | 5,072.6 | | | $ | 61.1 | | | $ | 5,133.7 | | | $ | 596.0 | | | $ | 187.3 | |
| 2020 | | | | | | | | | |
| Bedding Products | $ | 2,039.3 | | | $ | 32.2 | | | $ | 2,071.5 | | | $ | 192.4 | | | $ | 106.7 | |
Specialized Products 4 | 891.2 | | | 2.8 | | | 894.0 | | | 92.0 | | | 44.3 | |
| Furniture, Flooring & Textile Products | 1,349.7 | | | 13.8 | | | 1,363.5 | | | 126.5 | | | 25.5 | |
Intersegment eliminations and other 2,5 | | | | | | | (3.4) | | | 12.9 | |
| | | | | | | | | |
| | $ | 4,280.2 | | | $ | 48.8 | | | $ | 4,329.0 | | | $ | 407.5 | | | $ | 189.4 | |
1 See Note B for revenue by product family. 2 Depreciation and amortization: Other relates to non-operating assets (assets not included in segment assets) and is allocated to segment EBIT as discussed above.
3 2021 EBIT: Includes $28.2 gain on the sale of real estate associated with our exited Fashion Bed business.
4 2020 EBIT: Includes $25.4 of goodwill impairment for the Hydraulic Cylinders unit as discussed in Note C. 5 2020 EBIT: Other includes a charge to write off stock associated with a prior year divestiture that filed bankruptcy in 2020.
Average assets for our segments are shown in the table below and reflect the basis for return measures used by management to evaluate segment performance. These segment totals include working capital (all current assets and current liabilities) plus net property, plant and equipment. Segment assets for all years are reflected at their estimated average for the year. Acquired companies’ long-lived assets as disclosed below include property, plant and equipment, goodwill, and intangible assets.
| | | | | | | | | | | | | | | | | | | |
| | Year Ended December 31 |
| | Assets | | Additions
to
Property,
Plant and
Equipment | | Acquired
Companies’
Long-Lived
Assets | | |
| 2022 | | | | | | | |
| Bedding Products | $ | 931.2 | | | $ | 42.1 | | | $ | — | | | |
| Specialized Products | 350.1 | | | 28.2 | | | 93.8 | | | |
| Furniture, Flooring & Textile Products | 423.1 | | | 12.5 | | | 7.1 | | | |
| Average current liabilities included in segment numbers above | 793.9 | | | — | | | — | | | |
| Unallocated assets and other | 2,840.6 | | | 17.5 | | | — | | | |
| Difference between average assets and year-end balance sheet | (152.8) | | | — | | | — | | | |
| | $ | 5,186.1 | | | $ | 100.3 | | | $ | 100.9 | | | |
| 2021 | | | | | | | |
| Bedding Products | $ | 836.0 | | | $ | 67.1 | | | $ | 136.6 | | | |
| Specialized Products | 316.7 | | | 20.6 | | | 25.1 | | | |
| Furniture, Flooring & Textile Products | 373.5 | | | 9.8 | | | 6.2 | | | |
| Average current liabilities included in segment numbers above | 814.1 | | | — | | | — | | | |
| Unallocated assets and other | 2,828.5 | | | 9.1 | | | — | | | |
| Difference between average assets and year-end balance sheet | 138.5 | | | — | | | — | | | |
| | $ | 5,307.3 | | | $ | 106.6 | | | $ | 167.9 | | | |
| 2020 | | | | | | | |
| Bedding Products | $ | 739.0 | | | $ | 27.1 | | | $ | — | | | |
| Specialized Products | 299.5 | | | 13.2 | | | — | | | |
| Furniture, Flooring & Textile Products | 348.6 | | | 7.9 | | | — | | | |
| Average current liabilities included in segment numbers above | 665.0 | | | — | | | — | | | |
| Unallocated assets and other | 2,759.1 | | | 18.0 | | | — | | | |
| Difference between average assets and year-end balance sheet | (11.2) | | | — | | | — | | | |
| | $ | 4,800.0 | | | $ | 66.2 | | | $ | — | | | |
Trade sales and tangible long-lived assets are presented below, based on the geography of manufacture.
| | | | | | | | | | | | | | | | | |
| Year Ended December 31 |
| | 2022 | | 2021 | | 2020 |
| Trade sales | | | | | |
| Foreign sales | | | | | |
| Europe | $ | 624.5 | | | $ | 589.0 | | | $ | 420.9 | |
| China | 501.5 | | | 559.0 | | | 441.7 | |
| Canada | 279.4 | | | 262.0 | | | 261.5 | |
| Mexico | 262.8 | | | 276.0 | | | 215.4 | |
| Other | 129.2 | | | 116.1 | | | 94.7 | |
| Total foreign sales | 1,797.4 | | | 1,802.1 | | | 1,434.2 | |
| United States | 3,349.3 | | | 3,270.5 | | | 2,846.0 | |
| Total trade sales | $ | 5,146.7 | | | $ | 5,072.6 | | | $ | 4,280.2 | |
| | | | | |
| Tangible long-lived assets | | | | | |
| Foreign tangible long-lived assets | | | | | |
| Europe | $ | 142.1 | | | $ | 150.1 | | | $ | 155.0 | |
| China | 45.2 | | | 44.1 | | | 45.4 | |
| Canada | 24.3 | | | 26.9 | | | 30.2 | |
| Mexico | 14.1 | | | 13.9 | | | 8.8 | |
| Other | 7.9 | | | 9.8 | | | 11.1 | |
| Total foreign tangible long-lived assets | 233.6 | | | 244.8 | | | 250.5 | |
| United States | 538.8 | | | 536.7 | | | 534.3 | |
| Total tangible long-lived assets | $ | 772.4 | | | $ | 781.5 | | | $ | 784.8 | |
G—Earnings Per Share
Basic and diluted earnings per share were calculated as follows: | | | | | | | | | | | | | | | | | |
| | Year Ended December 31 |
| | 2022 | | 2021 | | 2020 |
| Earnings: | | | | | |
| Net earnings | $ | 309.9 | | | $ | 402.6 | | | $ | 253.1 | |
| Earnings attributable to noncontrolling interest, net of tax | (.1) | | | (.2) | | | (.1) | |
| | | | | |
| | | | | |
| Net earnings attributable to Leggett & Platt, Inc. common shareholders | $ | 309.8 | | | $ | 402.4 | | | $ | 253.0 | |
| | | | | |
| Weighted average number of shares (in millions): | | | | | |
| Weighted average number of common shares used in basic EPS | 136.1 | | | 136.3 | | 135.7 |
| Dilutive effect of stock-based compensation | .4 | | | .4 | | .2 |
| Weighted average number of common shares and dilutive potential common shares used in diluted EPS | 136.5 | | | 136.7 | | | 135.9 | |
| | | | | |
| Basic and Diluted EPS: | | | | | |
| | | | | |
| | | | | |
| | | | | |
| Basic EPS attributable to Leggett & Platt, Inc. common shareholders | $ | 2.28 | | | $ | 2.95 | | | $ | 1.86 | |
| | | | | |
| | | | | |
| | | | | |
| | | | | |
| Diluted EPS attributable to Leggett & Platt, Inc. common shareholders | $ | 2.27 | | | $ | 2.94 | | | $ | 1.86 | |
| | | | | |
| Other information: | | | | | |
| Anti-dilutive shares excluded from diluted EPS computation | .4 | | | .2 | | | .2 | |
| | | | | |
| Cash dividends declared per share | $ | 1.74 | | | $ | 1.66 | | | $ | 1.60 | |
H—Accounts and Other Receivables
Accounts and other receivables at December 31 consisted of the following: | | | | | | | | | | | | | | | | | | | | | | | |
| | 2022 | | 2021 |
| | Current | | Long-term | | Current | | Long-term |
| | | | | | | |
| | | | | | | |
Total trade receivables 1 | $ | 626.8 | | | $ | — | | | $ | 634.9 | | | $ | .2 | |
| | | | | | | |
| | | | | | | |
| | | | | | | |
Allowance for doubtful accounts-trade receivables 1 | (17.8) | | | — | | | (14.9) | | | (.1) | |
| Trade receivables, net | $ | 609.0 | | | $ | — | | | $ | 620.0 | | | $ | .1 | |
| | | | | | | |
| | | | | | | |
Other notes receivable 1 | $ | — | | | $ | 22.4 | | | $ | .7 | | | $ | 22.5 | |
| | | | | | | |
| Taxes receivable, including income taxes | 5.0 | | | — | | | 4.3 | | | — | |
Value-added taxes recoverable 2 | 45.4 | | | — | | | 14.5 | | | — | |
| Other receivables | 15.6 | | | — | | | 12.0 | | | — | |
Allowance for doubtful accounts - Other notes receivable 1 | — | | | (21.2) | | | — | | | (22.0) | |
| Other receivables, net | $ | 66.0 | | | $ | 1.2 | | | $ | 31.5 | | | $ | .5 | |
1 The “Total trade receivables” and “Other notes receivable” line items above include $21.3 and $22.5 as of December 31, 2022 and December 31, 2021, respectively, from a customer in our Bedding Products segment who has been experiencing financial difficulty and liquidity problems since 2018. They were delinquent with an interest payment in 2020, and as a result, we increased and fully reserved the balances for this customer in 2020. The reserve for this customer was $21.3 ($21.2 for the note and $.1 for the trade receivable) at December 31, 2022, and $22.5 ($22.0 for the note and $.5 for the trade receivable) at December 31, 2021.
2 Our value-added taxes recoverable have increased $30.9 since December 31, 2021, primarily as a result of refund delays from the Mexican government. We believe that these are fully collectible.
Activity related to the allowance for doubtful accounts is reflected below: | | | | | | | | | | | | | | | | | | | | | | | | | | | | | | | | | | | | | | | | | |
| Balance at December 31, 2020 | | Add:
Charges | | Less: Net
Charge-offs/(Recoveries) and Other | | Balance at December 31, 2021 | | Add:
Charges | | Less: Net
Charge-offs/(Recoveries) and Other | | Balance at December 31, 2022 |
| | | | | | | | | | | | | |
| | | | | | | | | | | | | |
| Total trade receivables | $ | 19.2 | | | $ | (2.6) | | | $ | 1.6 | | | $ | 15.0 | | | $ | 4.0 | | | $ | 1.2 | | | $ | 17.8 | |
| | | | | | | | | | | | | |
| | | | | | | | | | | | | |
| Other notes receivable | 22.8 | | | (.8) | | | — | | | 22.0 | | | (.8) | | | — | | | 21.2 | |
| | | | | | | | | | | | | |
| Total allowance for doubtful accounts | $ | 42.0 | | | $ | (3.4) | | | $ | 1.6 | | | $ | 37.0 | | | $ | 3.2 | | | $ | 1.2 | | | $ | 39.0 | |
I—Supplemental Balance Sheet Information
Additional supplemental balance sheet details at December 31 consisted of the following: | | | | | | | | | | | |
| 2022 | | 2021 |
| | | |
| | | |
| | | |
| | | |
| | | |
| | | |
| Sundry | | | |
Deferred income taxes (see Note N) | $ | 8.3 | | | $ | 8.6 | |
| | | |
Diversified investments associated with stock-based compensation plans (see Note L) | 39.7 | | | 47.4 | |
| | | |
| | | |
Pension plan assets (see Note M) | 3.9 | | | 2.8 | |
| Tooling and molds | 22.7 | | | 23.2 | |
| | | |
| 4.2 | | | 3.8 | |
| Other | 32.1 | | | 24.7 | |
| | $ | 110.9 | | | $ | 110.5 | |
| Accrued expenses | | | |
| Wages and commissions payable | $ | 71.3 | | | $ | 75.1 | |
| Workers’ compensation, vehicle-related and product liability, medical/disability | 44.7 | | | 45.2 | |
| Sales promotions | 45.4 | | | 53.4 | |
Liabilities associated with stock-based compensation plans (see Note L) | 5.9 | | | 9.1 | |
| Accrued interest | 12.5 | | | 16.4 | |
General taxes, excluding income taxes 1 | 29.2 | | | 28.8 | |
| Environmental reserves | 4.6 | | | 3.8 | |
Litigation contingency accruals (see Note T) | .9 | | | 1.0 | |
| Other | 47.2 | | | 51.8 | |
| | $ | 261.7 | | | $ | 284.6 | |
| Other current liabilities | | | |
| Dividends payable | $ | 58.3 | | | $ | 56.0 | |
| Customer deposits | 18.1 | | | 19.5 | |
| | | |
Additional consideration for acquisition of businesses (see Note R) | 14.4 | | | — | |
Derivative financial instruments (see Note S) | 5.5 | | | 1.1 | |
Liabilities associated with stock-based compensation plans (see Note L) | 3.1 | | | 3.5 | |
| Outstanding checks in excess of book balances | 19.6 | | | .3 | |
| Other | 10.1 | | | 11.8 | |
| | $ | 129.1 | | | $ | 92.2 | |
| Other long-term liabilities | | | |
Liability for pension benefits (see Note M) | $ | 19.0 | | | $ | 45.2 | |
Liabilities associated with stock-based compensation plans (see Note L) | 42.2 | | | 51.1 | |
| Deemed repatriation tax payable | 21.4 | | | 27.6 | |
| Net reserves for tax contingencies | 5.5 | | | 6.3 | |
| Deferred compensation | 10.8 | | | 13.2 | |
Additional consideration for acquisition of businesses (see Note R) | 17.5 | | | — | |
Other 1 | 9.7 | | | 19.5 | |
| | $ | 126.1 | | | $ | 162.9 | |
1 In 2020, we deferred our employer's U.S. Social Security match as provided by the Coronavirus Aid, Relief, and Economic Security (CARES) Act. As of December 31, 2022 and 2021, we had $9.5 and $8.3, respectively in Accrued expenses, and at December 31, 2021 we had $9.5 in Other long-term liabilities.
J—Long-Term Debt
Our multi-currency credit facility matures in September 2026. It provides us the ability, from time to time, subject to certain restrictive covenants and customary conditions, to borrow, repay, and re-borrow up to $1,200.0. At December 31, 2022, we were in compliance with all of our debt covenants and expect to be able to maintain compliance with the debt covenant requirements.
Our credit facility contains restrictive covenants which (a) require us to maintain as of the last day of each fiscal quarter i) Consolidated Funded Indebtedness minus the lesser of: (A) Unrestricted Cash, or (B) $750.0 to ii) Consolidated EBITDA for the four consecutive trailing quarters, such ratio not being greater than 3.50 to 1.00, provided, however, subject to certain limitations, if we have made a Material Acquisition in any fiscal quarter, at our election, the maximum Leverage Ratio shall be 4.00 to 1.00 for the fiscal quarter during which such Material Acquisition is consummated and the next three consecutive fiscal quarters; (b) limit the amount of total secured obligations to 15% of our total consolidated assets, and (c) limit our ability to sell, lease, transfer or dispose of all or substantially all of our assets and the assets of our subsidiaries, taken as a whole (other than accounts receivable sold in a Permitted Securitization Transaction, products sold in the ordinary course of business and our ability to sell, lease, transfer, or dispose of any of our assets or the assets of one of our subsidiaries to us or one of our subsidiaries, as applicable) at any given point in time.
In November 2021, we issued $500.0 aggregate principal amount of notes that mature in 2051. The notes bear interest at a rate of 3.5% per year, with interest payable semi-annually which began May 15, 2022. The net proceeds of these notes were used to repay commercial paper, and therefore indirectly were used to repay our $300.0 3.4% Senior Notes in August 2022.
Long-term debt, interest rates, and due dates at December 31 are as follows: | | | | | | | | | | | | | | | | | | | | | | | | | | | | | | | | | | | |
| | 2022 | | 2021 |
| | Year-end Interest Rate | | Due Date
Through | | Balance | | Year-end Interest Rate | | Due Date
Through | | Balance |
Senior Notes 1 | | | | | $ | — | | | 3.4 | % | | 2022 | | $ | 300.0 | |
Senior Notes 1 | 3.8 | % | | 2024 | | 300.0 | | | 3.8 | % | | 2024 | | 300.0 | |
Senior Notes 1 | 3.5 | % | | 2027 | | 500.0 | | | 3.5 | % | | 2027 | | 500.0 | |
Senior Notes 1 | 4.4 | % | | 2029 | | 500.0 | | | 4.4 | % | | 2029 | | 500.0 | |
Senior Notes 1 | 3.5 | % | | 2051 | | 500.0 | | | 3.5 | % | | 2051 | | 500.0 | |
| | | | | | | | | | | |
| Industrial development bonds, principally variable interest rates | 3.9 | % | | 2030 | | 3.8 | | | .3 | % | | 2030 | | 3.8 | |
Commercial paper 2 | 4.8 | % | | 2026 | | 282.5 | | | — | % | | 2026 | | — | |
| Finance leases | | | | | 4.2 | | | | | | | 3.7 | |
| Other, partially secured | | | | | 8.7 | | | | | | | .5 | |
| Unamortized discounts and deferred loan costs | | | | | (15.6) | | | | | | | (17.7) | |
| Total debt | | | | | 2,083.6 | | | | | | | 2,090.3 | |
| Less: current maturities | | | | | 9.4 | | | | | | | 300.6 | |
| Total long-term debt | | | | | $ | 2,074.2 | | | | | | | $ | 1,789.7 | |
1 Senior Notes are unsecured and unsubordinated obligations. For each of the Senior Notes: (i) interest is paid semi-annually in arrears; (ii) principal is due at maturity with no sinking fund; and (iii) we may, at our option, at any time, redeem all or a portion of any of the debt at a make-whole redemption price equal to the greater of: (a) 100% of the principal amount of the notes being redeemed; and (b) the sum of the present values of the remaining scheduled payments of principal and interest thereon (either to the maturity or the "par call date" depending on the respective note), discounted to the date of redemption on a semi-annual basis (assuming a 360-day year consisting of twelve 30-day months) at a specified discount rate, determined by the terms of each respective note. The Senior Notes may also be redeemed by us within 90 days of maturity (or within 180 days of maturity for the notes maturing in 2051) at 100% of the principal amount plus accrued and unpaid interest, and we are required to offer to purchase such notes at 101% of the principal amount, plus accrued and unpaid interest, if we experience a Change of Control Repurchase Event, as defined in the Senior Notes. Also, each respective Senior Note contains restrictive covenants, including a limitation on secured debt of 15% of our consolidated assets, a limitation on sale and leaseback transactions, and a limitation on certain consolidations, mergers, and sales of assets.
2 The weighted average interest rate for the net commercial paper activity during the years ended December 31, 2022 and 2021 was 3.2% and .2%, respectively. We view the notes as a source of long-term funds and have classified the borrowings under the commercial paper program as long-term borrowings on our balance sheet. We have the intent to roll over such obligations on a long-term basis and have the ability to refinance these borrowings on a long-term basis, as evidenced by our $1,200.0 revolving credit facility maturing in 2026 discussed above.
Maturities are as follows:
| | | | | |
| 2023 | $ | 9.4 | |
| 2024 | 300.8 | |
| 2025 | .6 | |
| 2026 | 283.0 | |
| 2027 | 498.4 | |
| Thereafter | 991.4 | |
| | $ | 2,083.6 | |
Amounts outstanding at December 31 related to our commercial paper program were:
| | | | | | | | | | | |
| 2022 | | 2021 |
| Total program authorized | $ | 1,200.0 | | | $ | 1,200.0 | |
| | | |
| | | |
| Commercial paper outstanding (classified as long-term debt) | $ | 282.5 | | | $ | — | |
| Letters of credit issued under the credit facility | — | | | — | |
| Total program usage | $ | 282.5 | | | $ | — | |
| | | |
At December 31, 2022, subject to restrictive covenants, we could raise cash by issuing commercial paper through a program that is backed by a $1,200.0 revolving credit facility with a syndicate of 12 lenders. The credit facility allows us to issue total letters of credit up to $125.0. When we issue letters of credit in this manner, our capacity under the revolving facility, and consequently, our ability to issue commercial paper, is reduced by a corresponding amount. We had no outstanding letters of credit under the facility at year end for the periods presented. Our borrowing capacity may be limited by covenants to our credit facility. At December 31, 2022, our borrowing capacity under the credit facility was $716.6.
Generally, we may elect one of five types of borrowing under the revolving credit facility, which determines the rate of interest to be paid on the outstanding principal balance. The interest rate would typically be commensurate with the currency borrowed and the term of the borrowing, as well as either (i) a competitive variable or fixed rate; or (ii) various published rates plus a pre-defined spread.
We are required to periodically pay accrued interest on any outstanding principal balance under the revolving credit facility at different time intervals based upon the elected interest rate and the elected interest period. Any outstanding principal under this facility will be due upon the maturity date. We may also terminate or reduce the lending commitments under this facility, in whole or in part, upon three business days’ notice.
K—Lease Obligations
Substantially all of our operating lease right-of-use assets and operating lease liabilities represent leases for certain operating facilities, warehouses, office space, trucking equipment, and various other assets. Finance lease balances consist of vehicle and certain equipment leases. Our leases have terms that expire at various dates through 2039, some of which include options to extend or terminate the leases at our discretion.
At December 31, 2022, we had $29.4 of additional operating leases that had not yet commenced. These leases will commence in 2023 with average lease terms of 5 years.
Supplemental balance sheet information related to leases was as follows:
| | | | | | | | | | | |
| December 31 |
| 2022 | | 2021 |
| Operating leases: | | | |
| Operating lease right-of-use assets | $ | 195.0 | | | $ | 192.6 | |
| | | |
| Current portion of operating lease liabilities | $ | 49.5 | | | $ | 44.5 | |
| Operating lease liabilities | 153.6 | | | 153.0 | |
| Total operating lease liabilities | $ | 203.1 | | | $ | 197.5 | |
| | | |
| Finance leases: | | | |
| Sundry | $ | 4.2 | | | $ | 3.8 | |
| | | |
| Current maturities of long-term debt | $ | 1.1 | | | $ | .8 | |
| Long-term debt | 3.1 | | | 2.9 | |
| Total finance lease liabilities | $ | 4.2 | | | $ | 3.7 | |
The components of lease expense were as follows:
| | | | | | | | | | | | | | | | | |
| Year Ended December 31 |
| 2022 | | 2021 | | 2020 |
| Operating lease costs: | | | | | |
| Lease costs | $ | 56.1 | | | $ | 50.1 | | | $ | 48.4 | |
| Variable lease costs | 15.1 | | | 15.4 | | | 12.1 | |
| Total operating lease costs | $ | 71.2 | | | $ | 65.5 | | | $ | 60.5 | |
| | | | | |
| Short-term lease costs | $ | 6.6 | | | $ | 7.0 | | | $ | 4.9 | |
| | | | | |
| Finance lease costs: | | | | | |
| Amortization of right-of-use assets | $ | 1.7 | | | $ | 1.7 | | | $ | 2.4 | |
| Interest on lease liabilities | .1 | | | .1 | | | .1 | |
| Total finance lease costs | $ | 1.8 | | | $ | 1.8 | | | $ | 2.5 | |
| | | | | |
| Total lease costs | $ | 79.6 | | | $ | 74.3 | | | $ | 67.9 | |
Variable lease costs consist primarily of taxes, insurance, and common-area or other maintenance costs for our leased facilities and equipment, which are paid based on actual costs incurred by the lessor.
Supplemental cash flow information related to leases was as follows: | | | | | | | | | | | | | | | | | |
| | Year Ended December 31 |
| 2022 | | 2021 | | 2020 |
| Cash paid for amounts included in the measurement of lease liabilities: | | | | | |
| Operating cash flows from operating leases | $ | 52.4 | | | $ | 48.6 | | | $ | 47.3 | |
| Operating cash flows from finance leases | .1 | | | .1 | | | .1 | |
| Financing cash flows from finance leases | 1.7 | | | 1.7 | | | 2.4 | |
| | | | | |
| Right-of-use assets obtained in exchange for new operating lease liabilities | 53.0 | | | 74.0 | | | 43.6 | |
| Right-of-use assets obtained in exchange for new finance lease liabilities | 1.4 | | | 1.9 | | | 1.8 | |
The following table reconciles the undiscounted cash flows for the operating and finance leases at December 31, 2022 to the operating and finance lease liabilities recorded on the Consolidated Balance Sheets:
| | | | | | | | | | | |
| December 31, 2022 |
| Operating Leases | | Finance Leases |
| 2023 | $ | 53.9 | | | $ | 1.2 | |
| 2024 | 47.9 | | | 1.4 | |
| 2025 | 37.3 | | | .6 | |
| 2026 | 29.2 | | | .5 | |
| 2027 | 16.6 | | | .3 | |
| Thereafter | 31.0 | | | .3 | |
| Total | 215.9 | | | 4.3 | |
| Less: interest | 12.8 | | | .1 | |
| Lease liability | $ | 203.1 | | | $ | 4.2 | |
| | | |
| Weighted average remaining lease term (years) | 5.2 | | 3.9 |
| Weighted average discount rate | 2.5 | % | | 2.1 | % |
L—Stock-Based Compensation
We use various forms of share-based compensation which are summarized below. One stock unit is equivalent to one common share for accounting and earnings-per-share purposes. Shares are issued from treasury for the majority of our stock plans’ activity. All share information is presented in millions.
Stock options and stock units are granted pursuant to our Flexible Stock Plan (the "Plan"). Each option counts as one share against the shares available under the Plan, but each share granted for any other awards will count as three shares against the Plan.
At December 31, 2022, the following common shares were authorized for issuance under the Plan:
| | | | | | | | | | | |
| | Shares Available for Issuance | | Maximum Number of Authorized Shares |
| Unexercised options | .3 | | | .3 | |
| Outstanding stock units—vested | 3.5 | | | 9.1 | |
| Outstanding stock units—unvested | 1.0 | | | 2.9 | |
| Available for grant | 8.5 | | | 8.5 | |
| Authorized for issuance at December 31, 2022 | 13.3 | | | 20.8 | |
The following table recaps the impact of stock-based compensation on the results of operations for each of the periods presented: | | | | | | | | | | | | | | | | | | | | | | | | | | | | | | | | | | | |
| Year Ended December 31 |
| 2022 | | 2021 | | 2020 |
| To Be Settled With Stock | | To Be Settled In Cash | | To Be Settled With Stock | | To Be Settled In Cash | | To Be Settled With Stock | | To Be Settled In Cash |
| | | | | | | | | | | |
| | | | | | | | | | | |
| | | | | | | | | | | |
Executive Stock Unit (ESU) program contributions 1 | $ | 3.7 | | | $ | .7 | | | $ | 4.0 | | | $ | .6 | | | $ | 3.5 | | | $ | .7 | |
| Discounts on various stock awards: | | | | | | | | | | | |
Deferred Compensation Program 2 | 1.6 | | | — | | | 1.5 | | | — | | | 2.2 | | | — | |
ESU program 1 | 1.4 | | | — | | | 1.1 | | | — | | | 1.4 | | | — | |
Discount Stock Plan 3 | .8 | | | — | | | .9 | | | — | | | .9 | | | — | |
Performance Stock Unit (PSU) awards: 4 | | | | | | | | | | | |
PSU - TSR based 4A | 2.5 | | | (.5) | | | 3.1 | | | (1.0) | | | 3.2 | | | (.7) | |
PSU - EBIT CAGR based 4B | (1.7) | | | (2.0) | | | 4.7 | | | 5.0 | | | (1.9) | | | (2.0) | |
| | | | | | | | | | | |
| | | | | | | | | | | |
Restricted Stock Unit (RSU) awards 5 | 10.2 | | | — | | | 8.2 | | | — | | | 6.8 | | | — | |
| Other, primarily non-employee directors restricted stock | 1.0 | | | — | | | .4 | | | — | | | .9 | | | — | |
| Total stock-related compensation expense (income) | 19.5 | | | $ | (1.8) | | | 23.9 | | | $ | 4.6 | | | 17.0 | | | $ | (2.0) | |
| Employee contributions for above stock plans | 10.6 | | | | | 10.3 | | | | | 12.2 | | | |
| Total stock-based compensation | $ | 30.1 | | | | | $ | 34.2 | | | | | $ | 29.2 | | | |
| | | | | | | | | | | |
| Tax benefits on stock-based compensation expense | $ | 4.7 | | | | | $ | 5.8 | | | | | $ | 4.0 | | | |
| Tax benefits on stock-based compensation payments | .6 | | | | | 3.4 | | | | | 2.5 | | | |
| Total tax benefits associated with stock-based compensation | $ | 5.3 | | | | | $ | 9.2 | | | | | $ | 6.5 | | | |
The following table recaps the impact of stock-based compensation on assets and liabilities for each of the periods presented: | | | | | | | | | | | | | | | | | | | | | | | | | | | | | | | | | | | |
| 2022 | | 2021 |
| Current | | Long-term | | Total | | Current | | Long-term | | Total |
| Assets: | | | | | | | | | | | |
Diversified investments associated with the ESU program 1 | $ | 3.1 | | | $ | 39.7 | | | $ | 42.8 | | | $ | 3.6 | | | $ | 47.4 | | | $ | 51.0 | |
| | | | | | | | | | | |
| Liabilities: | | | | | | | | | | | |
ESU program 1 | $ | 3.1 | | | $ | 40.9 | | | $ | 44.0 | | | $ | 3.6 | | | $ | 47.3 | | | $ | 50.9 | |
Performance Stock Unit (TSR) award 4A | — | | | .6 | | | .6 | | | — | | | 1.1 | | | 1.1 | |
Performance Stock Unit (EBIT) award 4B | — | | | .7 | | | .7 | | | 3.5 | | | 2.7 | | | 6.2 | |
| | | | | | | | | | | |
| Other - primarily timing differences between employee withholdings and related employer contributions to be submitted to various plans' trust accounts | 5.9 | | | — | | | 5.9 | | | 5.6 | | | — | | | 5.6 | |
| Total liabilities associated with stock-based compensation | $ | 9.0 | | | $ | 42.2 | | | $ | 51.2 | | | $ | 12.7 | | | $ | 51.1 | | | $ | 63.8 | |
1 ESU Program
The ESU program is a stock-based retirement plan for highly compensated employees. We make a matching contribution of 50% and will make another matching contribution of up to 50% of the employee’s contributions for the year if certain profitability levels, as defined in the ESU program, are obtained.
Participants in the ESU program may contribute up to 10% (depending upon certain qualifications) of their compensation above the threshold. Participant contributions are credited to a diversified investment account established for the participant, and we make premium contributions to the diversified investment accounts equal to 17.65% of the participant’s contribution. A participant’s diversified investment account balance is adjusted to mirror the investment experience, whether positive or negative, of the diversified investments selected by the participant. Participants may change investment elections in the diversified investment accounts, but cannot purchase Company common stock or stock units. The diversified investment accounts consist of various mutual funds and retirement target funds and are unfunded, unsecured obligations of the Company that will be settled in cash. Both the assets and liabilities associated with this program are presented in the table above and are adjusted to fair value at each reporting period.
Company matching contributions to the ESU program, including dividend equivalents, are used to acquire stock units at 85% of the common stock market price on the acquisition date. Stock units are converted to common stock at a 1-to-1 ratio upon distribution from the program and may be settled in cash, except for distributions to the Company's Section 16 Officers.
Company matches in the ESU program fully vest upon five years of cumulative service, subject to certain participation requirements. Distributions are triggered by an employee’s retirement, death, disability, or separation from Leggett.
In 2022, employee contributions were $4.0, and employer premium contributions to diversified investment accounts were $.7. See the stock-based compensation table above for information regarding employer contributions.
Details regarding stock unit activity for the ESU program are reflected in the stock units summary table below.
2 Deferred Compensation Program
We offer a Deferred Compensation Program under which key managers and outside directors may elect to receive stock options, stock units, or interest-bearing cash deferrals in lieu of cash compensation:
•Stock options under this program are granted in the last month of the year prior to the year the compensation is earned. The number of options granted equals the deferred compensation times five, divided by the stock’s market price on the date of grant. The option has a 10-year term. It vests as the associated compensation is earned and becomes exercisable beginning 15 months after the grant date. Stock is issued when the option is exercised. Grant date fair values are calculated using the Black-Scholes option pricing model and are amortized by the straight-line method over the options’ total vesting period, except for employees who are retirement eligible. Expense for employees who are retirement eligible is recognized immediately. Stock option activity for the years presented was not material.
•Deferred stock units (DSU) under this program are acquired every two weeks (when the compensation would have otherwise been paid) at a 20% discount to the market price of our common stock on each acquisition date, and they vest immediately. Expense is recorded as the compensation is earned. Stock units earn dividends at the same rate as cash dividends paid on our common stock. These dividends are used to acquire stock units at a 20% discount. Stock units are converted to common stock and distributed in accordance with the participant’s pre-set election. However, stock units may be settled in cash, but only if there is not a sufficient amount of shares reserved for future issuance under the Flexible Stock Plan. Participants must begin receiving distributions no later than 10 years after the effective date of the deferral, and installment distributions cannot exceed 10 years.
•Interest-bearing cash deferrals under this program are reported in "Other long-term liabilities" on the Consolidated Balance Sheets and are disclosed in Note I. | | | | | | | | | | | | | | | | | |
| Options | | Units | | Cash |
| Aggregate amount of compensation deferred during 2022 | $ | .1 | | | $ | 4.7 | | | $ | .4 | |
3 Discount Stock Plan
Under the Discount Stock Plan (DSP), a tax-qualified §423 stock purchase plan, eligible employees may purchase shares of Leggett common stock at 85% of the closing market price on the last business day of each month. Shares are purchased and issued on the last business day of each month and generally cannot be sold or transferred for one year.
| | | | | |
| Average 2022 purchase price per share (net of discount) | $ | 31.07 | |
| 2022 number of shares purchased by employees | .2 | |
| Shares purchased since inception in 1982 | 23.8 | |
| Maximum shares under the plan | 27.0 | |
4 PSU Awards
Our long-term incentive awards are split between PSUs and RSUs. For the periods presented, executive officers received two thirds PSUs and one third RSUs. For other selected participants, the award is granted at either half PSUs and half RSUs or 100% RSUs.
For the periods presented, PSU awards had a component based on relative Total Shareholder Return (TSR = (Change in Stock Price + Dividends) / Beginning Stock Price) and another component based on EBIT Compound Annual Growth Rate (CAGR). These components are discussed below.
We intend to pay 50% in shares of our common stock and 50% in cash, although the Company reserves the right, subject to the Human Resources and Compensation Committee's approval, to pay up to 100% in cash. Cash settlements are recorded as a liability and adjusted to fair value at each reporting period.
4A PSU - TSR Based
For the periods presented, PSU awards were based 50% upon our TSR compared to a peer group. A small number of PSU awards were based 100% upon relative TSR for certain business unit employees to complement their particular mix of incentive compensation. Grant date fair values are calculated using a Monte Carlo simulation of stock and volatility data for Leggett and each of the peer companies. Grant date fair values are amortized using the straight-line method over the three-year vesting period.
The relative TSR component of the PSU awards contained the following conditions:
•A service requirement—Awards generally “cliff” vest three years following the grant date; and
•A market condition—Awards were based on our TSR as compared to the TSR of a group of peer companies. The peer group consists of all the companies in the Industrial, Materials, and Consumer Discretionary sectors of the S&P 500 and S&P Midcap 400 (approximately 300 companies). Participants will earn from 0% to 200% of the base award depending upon how our TSR ranks within the peer group at the end of the three-year performance period.
4B PSU - EBIT CAGR Based
For the periods presented, PSU awards were based 50% upon our, or the applicable profit center's, EBIT CAGR. Grant date fair values are calculated using the grant date stock price discounted for dividends over the vesting period. Expense is adjusted every quarter over the three-year vesting period based on the number of shares expected to vest.
The EBIT CAGR component of the PSU awards contained the following conditions:
•A service requirement—Awards generally “cliff” vest three years following the grant date; and
•A performance condition—Awards are based on achieving specified EBIT CAGR performance targets for our or the applicable profit center's EBIT during the third year of the performance period compared to EBIT during the fiscal year immediately preceding the performance period. Participants will earn from 0% to 200% of the base award.
Below is a summary of shares and grant date fair value related to PSU awards for the periods presented:
| | | | | | | | | | | | | | | | | |
| | Year Ended December 31 |
| | 2022 | | 2021 | | 2020 |
| TSR Based | | | | | |
| Total shares base award | .1 | | | .1 | | | .1 | |
| Grant date per share fair value | $ | 41.13 | | | $ | 49.43 | | | $ | 38.23 | |
| Risk-free interest rate | 1.7 | % | | .2 | % | | 1.4 | % |
| Expected life in years | 3.0 | | 3.0 | | 3.0 |
| Expected volatility (over expected life) | 45.2 | % | | 44.3 | % | | 24.0 | % |
| Expected dividend yield (over expected life) | 4.6 | % | | 3.7 | % | | 3.6 | % |
| | | | | |
| EBIT CAGR Based | | | | | |
| Total shares base award | .1 | | | .1 | | | .1 | |
| Grant date per share fair value | $ | 32.88 | | | $ | 38.77 | | | $ | 40.52 | |
| Vesting period in years | 3.0 | | 3.0 | | 3.0 |
| | | | | | | | | | | | | | | | | | | | | | | | | | | | | | | | | | | | | | |
| Three-Year Performance Cycle for PSU - TSR Based |
| Award Year | | Completion Date | | TSR Performance
Relative to the Peer Group (1%=Best) | | Payout as a
Percent of the
Base Award | | Number of Shares
Distributed | | Cash Portion | | Distribution Date |
| 2018 | | December 31, 2020 | | 60 | th percentile | | 56.0% | | <.1 million | | $ | 2.0 | | | First quarter 2021 |
| 2019 | | December 31, 2021 | | 78 | th percentile | | —% | | — million | | $ | — | | | First quarter 2022 |
| 2020 | | December 31, 2022 | | 87 | th percentile | | —% | | — million | | $ | — | | | First quarter 2023 |
| | | | | | | | | | | | | | | | | | | | | | | | | | | | | | | | | | | |
| Three-Year Performance Cycle for PSU - EBIT CAGR Based |
| Award Year | | Completion Date | | | Payout as a
Percent of the
Base Award | | Number of Shares
Distributed | | Cash Portion | | Distribution Date |
| 2018 | | December 31, 2020 | | | 16.0% | | <.1 million | | $ | .4 | | | First quarter 2021 |
| 2019 | | December 31, 2021 | | | 127.0% | | <.1 million | | $ | 3.5 | | | First quarter 2022 |
| 2020 | | December 31, 2022 | | | —% | | — million | | $ | — | | | First quarter 2023 |
5 Restricted Stock Unit Awards
RSU awards are generally granted as follows:
•As part of our long-term incentive awards, along with PSUs as discussed above
•As annual awards to selected managers
•On a discretionary basis to selected employees
•As compensation for outside directors
The value of these awards is determined by the stock price on the day of the award, and expense is recognized over the three-year vesting period, except for retirement-eligible employees that are expensed immediately at the RSU grant date or as they become retirement eligible. Those who are retirement eligible (after age 65 or after the date where the participant’s age plus years of service is greater than or equal to 70 years) will continue to receive shares that will vest after the retirement date.
Stock Units Summary
As of December 31, 2022, the unrecognized cost of non-vested stock units that is not adjusted to fair value was $8.5 with a weighted-average remaining contractual life of one year.
Stock unit information for the plans discussed above is presented in the table below:
| | | | | | | | | | | | | | | | | | | | | | | | | | | | | | | | | | | | | | | | | | | |
| DSU | | ESU | | PSU | | RSU | | | | Total Units | | Weighted
Average
Grant Date
Fair Value
per Unit | | Aggregate
Intrinsic
Value |
| Unvested at December 31, 2021 | — | | | — | | | .8 | | | .2 | | | | | 1.0 | | | $ | 44.41 | | | |
| Granted based on current service | .2 | | | .2 | | | — | | | .3 | | | | | .7 | | | 35.78 | | | |
| Granted based on future conditions* | — | | | — | | | .3 | | | — | | | | | .3 | | | 17.99 | | | |
| Vested | (.2) | | | (.2) | | | (.1) | | | (.3) | | | | | (.8) | | | 38.21 | | | |
| Forfeited* | — | | | — | | | (.2) | | | — | | | | | (.2) | | | 21.33 | | | |
| | | | | | | | | | | | | | | |
| | | | | | | | | | | | | | | |
| Unvested at December 31, 2022 | — | | | — | | | .8 | | | .2 | | | | | 1.0 | | | $ | 42.34 | | | $ | 30.7 | |
| Fully vested shares available for issuance at December 31, 2022 | | | | | | | | | | | 3.5 | | | | | $ | 111.6 | |
*PSU awards are presented at maximum payout of 200% at grant date and when forfeited.
| | | | | | | | | | | | | | | | | |
| | Year Ended December 31 |
| | 2022 | | 2021 | | 2020 |
| Total intrinsic value of vested stock units converted to common stock | $ | 5.7 | | | $ | 10.5 | | | $ | 11.7 | |
M—Employee Benefit Plans
The Consolidated Balance Sheets reflect a net liability for the funded status of our domestic and foreign defined benefit pension plans as of all periods presented. Our U.S. plans (comprised primarily of three significant plans) represent approximately 84% of our pension benefit obligation in each of the periods presented. Participants in one of the significant domestic plans have stopped earning benefits; this plan is referred to as our Frozen Plan in the following narrative.
A summary of our pension obligations and funded status as of December 31 is as follows: | | | | | | | | | | | | | | | | | |
| 2022 | | 2021 | | 2020 |
| Change in benefit obligation | | | | | |
| Benefit obligation, beginning of period | $ | 270.4 | | | $ | 286.5 | | | $ | 259.1 | |
| Service cost | 5.3 | | | 5.1 | | | 5.1 | |
| Interest cost | 6.6 | | | 6.0 | | | 7.2 | |
| Plan participants’ contributions | .4 | | .5 | | .5 |
Actuarial (gain) loss 1 | (71.6) | | | (10.8) | | | 27.7 | |
| Benefits paid | (15.9) | | | (15.6) | | | (14.2) | |
| Plan amendments | — | | | .1 | | | (.4) | |
| Curtailments and settlements | — | | | (1.1) | | | — | |
| Foreign currency exchange rate changes | (4.0) | | | (.3) | | | 1.5 | |
| Benefit obligation, end of period | $ | 191.2 | | | $ | 270.4 | | | $ | 286.5 | |
| Change in plan assets | | | | | |
| Fair value of plan assets, beginning of period | $ | 227.7 | | | $ | 215.3 | | | $ | 201.5 | |
| Actual return on plan assets | (35.4) | | | 25.6 | | | 24.1 | |
| Employer contributions | 2.9 | | | 2.8 | | | 2.2 | |
| Plan participants’ contributions | .4 | | | .5 | | | .5 | |
| Benefits paid | (15.9) | | | (15.6) | | | (14.2) | |
| Settlements | — | | | (.8) | | | — | |
| Foreign currency exchange rate changes | (3.9) | | | (.1) | | | 1.2 | |
| Fair value of plan assets, end of period | $ | 175.8 | | | $ | 227.7 | | | $ | 215.3 | |
| Net funded status | $ | (15.4) | | | $ | (42.7) | | | $ | (71.2) | |
| Funded status recognized in the Consolidated Balance Sheets | | | | | |
| Other assets—sundry | $ | 3.9 | | | $ | 2.8 | | | $ | .9 | |
| Other current liabilities | (.3) | | | (.3) | | | (.4) | |
| Other long-term liabilities | (19.0) | | | (45.2) | | | (71.7) | |
| Net funded status | $ | (15.4) | | | $ | (42.7) | | | $ | (71.2) | |
1 Year-over-year fluctuations in "Actuarial (gain) loss" are primarily driven by changes in the weighted average discount rate assumptions.
Our accumulated benefit obligation was not materially different from our projected benefit obligation for the periods presented. Included in the above plans is a subsidiary’s unfunded supplemental executive retirement plan. This is a non-qualified plan, and these benefits are secured by insurance policies that are not included in the plan’s assets. Cash surrender values associated with these policies were approximately $2.8 at December 31, 2022, 2021, and 2020.
Comprehensive Income (Loss)
Amounts and activity included in accumulated other comprehensive income associated with pensions are reflected below: | | | | | | | | | | | | | | | | | | | | | | | | | | | | | | | | | | | |
| December 31, 2021 | | 2022 Amortization | | 2022 Net Actuarial Loss | | 2022 Foreign Currency Exchange Rates Change | | 2022 Income Tax Change | | December 31, 2022 |
| Net (loss) gain (before tax) | $ | (53.1) | | | $ | 2.5 | | | $ | 22.9 | | | $ | .9 | | | $ | — | | | $ | (26.8) | |
| Deferred income taxes | 14.6 | | | — | | | — | | | — | | | (6.2) | | | 8.4 | |
| Accumulated other comprehensive income (loss) (net of tax) | $ | (38.5) | | | $ | 2.5 | | | $ | 22.9 | | | $ | .9 | | | $ | (6.2) | | | $ | (18.4) | |
Net Pension Expense (Income)
Components of net pension expense (income) for the years ended December 31 were as follows: | | | | | | | | | | | | | | | | | |
| 2022 | | 2021 | | 2020 |
| Service cost | $ | 5.3 | | | $ | 5.1 | | | $ | 5.1 | |
| Interest cost | 6.6 | | | 6.0 | | | 7.2 | |
| Expected return on plan assets | (13.2) | | | (12.5) | | | (11.9) | |
| | | | | |
| Recognized net actuarial loss | 2.5 | | | 5.3 | | | 4.0 | |
| Prior service cost | — | | | — | | | (.4) | |
| Curtailments and settlements | — | | | (.2) | | | — | |
| Net pension expense | $ | 1.2 | | | $ | 3.7 | | | $ | 4.0 | |
| Weighted average assumptions for pension costs: | | | | | |
| Discount rate used in net pension costs | 2.5 | % | | 2.1 | % | | 2.8 | % |
| Rate of compensation increase used in pension costs | 3.5 | % | | 3.5 | % | | 3.4 | % |
| Expected return on plan assets | 6.0 | % | | 5.9 | % | | 6.1 | % |
| Weighted average assumptions for benefit obligation: | | | | | |
| Discount rate used in benefit obligation | 5.0 | % | | 2.5 | % | | 2.1 | % |
| Rate of compensation increase used in benefit obligation | 3.4 | % | | 3.5 | % | | 3.5 | % |
Assumptions used for U.S. and international plans were not significantly different.
The components of net pension expense other than the service cost component are included in the line item "Other expense (income), net" in the Consolidated Statements of Operations.
We use the average of a Pension Liability Index rate and a 10+ year AAA-AA US Corporate Index rate to determine the discount rate used for our significant pension plans (rounded to the nearest 25 basis points). The Pension Liability Index rate is a calculated rate using yearly spot rates matched against expected future benefit payments. The 10+ year AAA-AA US Corporate Index rate is based on the weighted average yield of a portfolio of high-grade Corporate Bonds with an average duration approximating the plans’ projected benefit payments. The discount rates used for our other, primarily foreign, plans are based on rates appropriate for the respective country and the plan obligations.
The overall, expected long-term rate of return is based on each plan’s historical experience and our expectations of future returns based upon each plan’s investment holdings, as discussed below.
Pension Plan Assets
The fair value of our major categories of pension plan assets is disclosed below using a three-level valuation hierarchy that separates fair value valuation techniques into the following categories:
•Level 1: Quoted prices for identical assets or liabilities in active markets.
•Level 2: Other significant inputs observable either directly or indirectly (including quoted prices for similar securities, interest rates, yield curves, credit risk, etc.).
•Level 3: Unobservable inputs that are not corroborated by market data.
Presented below are our major categories of investments for the periods presented: | | | | | | | | | | | | | | | | | | | | | | | | | | | | | | | | | | | | | | | | | | | | | | | | | | | | | | | | | | | |
| | Year Ended December 31, 2022 | | Year Ended December 31, 2021 |
| | Level 1 | | Level 2 | | Level 3 | | Assets Measured at NAV 1 | | Total | | Level 1 | | Level 2 | | Level 3 | | Assets Measured at NAV 1 | | Total |
| Mutual and pooled funds | | | | | | | | | | | | | | | | | | | |
| Fixed income | $ | 25.9 | | | $ | 13.9 | | | $ | — | | | $ | — | | | $ | 39.8 | | | $ | 34.1 | | | $ | 21.3 | | | $ | — | | | $ | — | | | $ | 55.4 | |
| Equities | 99.2 | | | 5.6 | | | — | | | — | | | 104.8 | | | 127.0 | | | 8.4 | | | — | | | — | | | 135.4 | |
| Stable value funds | — | | | 22.1 | | | — | | | — | | | 22.1 | | | — | | | 31.6 | | | — | | | — | | | 31.6 | |
| Money market funds, cash and other | — | | | — | | | — | | | 9.1 | | | 9.1 | | | — | | | — | | | — | | | 5.3 | | | 5.3 | |
| Total investments at fair value | $ | 125.1 | | | $ | 41.6 | | | $ | — | | | $ | 9.1 | | | $ | 175.8 | | | $ | 161.1 | | | $ | 61.3 | | | $ | — | | | $ | 5.3 | | | $ | 227.7 | |
1 Certain investments that are measured at fair value using the net asset value (NAV) per share (or its equivalent) practical expedient have not been classified in the fair value hierarchy.
Plan assets are invested in diversified portfolios of equity, debt, and government securities, as well as a stable value fund. The aggregate allocation of these investments is as follows:
| | | | | | | | | | | |
| 2022 | | 2021 |
| Asset Category | | | |
| Equity securities | 60 | % | | 60 | % |
| Debt securities | 23 | | | 24 | |
| Stable value funds | 12 | | | 14 | |
| Other, including cash | 5 | | | 2 | |
| Total | 100 | % | | 100 | % |
Our investment policy and strategies are established with a long-term view in mind. We strive for a sufficiently diversified asset mix to minimize the risk of a material loss to the portfolio value due to the devaluation of any single investment. In determining the appropriate asset mix, our financial strength and ability to fund potential shortfalls that might result from poor investment performance are considered. The assets in our Frozen Plan employ a liability-driven investment strategy and have a target allocation of 60% fixed income and 40% equities. The remaining two significant plans have a target allocation of 75% equities and 25% fixed income, as historical equity returns have tended to exceed bond returns over the long term.
Assets of our domestic plans represent the majority of plan assets and are allocated to seven different investments. Six are mutual funds, all of which are passively managed low-cost index funds, and include:
•U.S. Total Stock Market Index: Large-, mid-, and small-cap equity diversified across growth and value styles.
•U.S. Large-Cap Index: Large-cap equity diversified across growth and value styles.
•U.S. Small-Cap Index: Small-cap equity utilizing value style.
•World ex US Index: International equity; broad exposure across developed and emerging non-U.S. equity markets.
•Long-term Bond Index: Diversified exposure to the long-term, investment-grade U.S. bond market.
•Extended Duration Treasury Index: Diversified exposure to U.S. treasuries with maturities of 20-30 years.
The stable value fund consists of a fixed income portfolio offering consistent return and protection against interest rate volatility.
Future Contributions and Benefit Payments
We expect to contribute approximately $5.0 to our defined benefit pension plans in 2023.
Estimated benefit payments expected over the next 10 years are as follows:
| | | | | |
| 2023 | $ | 12.9 | |
| 2024 | 13.4 | |
| 2025 | 14.0 | |
| 2026 | 14.4 | |
| 2027 | 14.6 | |
| 2028-2032 | 70.4 | |
Defined Contribution Plans
Total expense for defined contribution plans was as follows:
| | | | | | | | | | | | | | | | | |
| 2022 | | 2021 | | 2020 |
| 401(k) Plan | $ | 8.0 | | | $ | 6.8 | | | $ | 6.8 | |
| Other defined contribution plans | 4.8 | | | 4.6 | | | 4.9 | |
| $ | 12.8 | | | $ | 11.4 | | | $ | 11.7 | |
Multi-employer Pension Plans
We have limited participation in one union-sponsored, defined benefit, multi-employer pension plan. The plan is not administered by us, and contributions are determined in accordance with provisions of negotiated labor contracts. Aggregate contributions to the plan were immaterial for each of the years presented. In addition to regular contributions, we could be obligated to pay additional contributions (known as complete or partial withdrawal liabilities) if a plan has unfunded vested benefits. Factors that could impact the funded status of the plan include investment performance, changes in the participant demographics, financial stability of contributing employers, and changes in actuarial assumptions. Withdrawal liability triggers could include a plan's termination, a withdrawal of substantially all employers, or our voluntary withdrawal from the plan (such as decision to close a facility or the dissolution of a collective bargaining unit). We have a very small share of the liability among the participants of the plan. Based upon the information available from the plan administrator, the multi-employer plan in which we participate is underfunded, and we estimate our aggregate share of potential withdrawal liability for the plan to approximate $19.0. We have not recorded any material withdrawal liabilities for the years presented.
The components of earnings before income taxes are as follows:
| | | | | | | | | | | | | | | | | |
| | Year Ended December 31 |
| | 2022 | | 2021 | | 2020 |
| Domestic | $ | 163.6 | | | $ | 249.7 | | | $ | 115.3 | |
| Foreign | 240.0 | | | 272.4 | | | 212.6 | |
| Earnings before income taxes | $ | 403.6 | | | $ | 522.1 | | | $ | 327.9 | |
Income tax expense (benefit) is comprised of the following components:
| | | | | | | | | | | | | | | | | |
| | Year Ended December 31 |
| | 2022 | | 2021 | | 2020 |
| Current | | | | | |
| Federal | $ | 48.3 | | | $ | 57.0 | | | $ | 36.9 | |
| State and local | 7.9 | | | 11.5 | | | 7.8 | |
| Foreign | 53.2 | | | 59.5 | | | 51.0 | |
| Total current | 109.4 | | | 128.0 | | | 95.7 | |
| Deferred | | | | | |
| Federal | (14.1) | | | (9.3) | | | (15.0) | |
| State and local | (2.0) | | | (2.3) | | | (2.6) | |
| Foreign | .4 | | | 3.1 | | | (3.3) | |
| Total deferred | (15.7) | | | (8.5) | | | (20.9) | |
| Total income taxes | $ | 93.7 | | | $ | 119.5 | | | $ | 74.8 | |
Income tax expense (benefit), as a percentage of earnings before income taxes, differs from the statutory federal income tax rate as follows:
| | | | | | | | | | | | | | | | | |
| | Year Ended December 31 |
| | 2022 | | 2021 | | 2020 |
| Statutory federal income tax rate | 21.0 | % | | 21.0 | % | | 21.0 | % |
| Increases (decreases) in rate resulting from: | | | | | |
| State taxes, net of federal benefit | .9 | | | 1.5 | | | .8 | |
| Tax effect of foreign operations | (.5) | | | (.9) | | | (2.2) | |
| Global intangible low-taxed income (GILTI) | .6 | | | .5 | | | (.3) | |
| Current and deferred foreign withholding taxes | 2.6 | | | 2.3 | | | 2.7 | |
| | | | | |
| | | | | |
| Stock-based compensation | (.1) | | | (.5) | | | (.6) | |
| | | | | |
| Change in valuation allowance | (.1) | | | — | | | .8 | |
| Change in uncertain tax positions, net | — | | | — | | | .6 | |
| Goodwill impairment | — | | | — | | | 1.6 | |
| Other permanent differences, net | (1.0) | | | (.8) | | | (1.3) | |
| Other, net | (.2) | | | (.2) | | | (.3) | |
| Effective tax rate | 23.2 | % | | 22.9 | % | | 22.8 | % |
For all periods presented, the tax rate benefited from income earned in various foreign jurisdictions at rates lower than the U.S. federal statutory rate. The rate benefited from income earned primarily in China and Cyprus during 2022, China, Croatia, and Switzerland in 2021, and China and Luxembourg in 2020.
In 2022, we recognized tax expense of $10.9 related to foreign withholding taxes of $10.5 and other net tax expenses of $0.4.
In 2021, we recognized tax expense of $14.6 related to foreign withholding taxes of $11.9 and other net tax expenses of $2.7.
In 2020, we recognized tax expense of $13.1 related to foreign withholding taxes of $8.9, a non-deductible goodwill impairment associated with our Hydraulic Cylinders reporting unit of $5.3, and a Korean audit settlement of $3.2. These expenses were partially offset by prior year tax benefits totaling $3.9 from the GILTI high-tax exception final regulations issued in 2020, and other net tax benefits of $.4.
We file tax returns in each jurisdiction where we are required to do so. In these jurisdictions, a statute of limitations period exists. After a statute period expires, the tax authorities can no longer assess additional income tax for the expired period. In addition, once the statute expires we are no longer eligible to file claims for refund for any tax that we may have overpaid.
Unrecognized Tax Benefits
The total amount of our gross unrecognized tax benefits including interest and penalties at December 31, 2022, 2021, and 2020 was $5.9 (of which $4.7 would impact our effective tax rate, if recognized), $6.6, and $6.9, respectively. We recognize interest and penalties related to unrecognized tax benefits as part of income tax expense in the Consolidated Statements of Operations, which is consistent with prior reporting periods.
We are currently in various stages of audit by certain governmental tax authorities. We have established liabilities for unrecognized tax benefits as appropriate, with such amounts representing a reasonable provision for taxes we ultimately might be required to pay. However, these liabilities could be adjusted over time as more information becomes known and management continues to evaluate the progress of these examinations.
In 2021, the Internal Revenue Service (IRS) completed its examination of our 2016 U.S. federal income tax return and asserted that income earned in that year by our Luxembourg subsidiary through its Mexican branch should be recognized as income in the U.S. We continue to believe their position is without merit but unsuccessfully contested this matter through IRS Appeals. The 2016 audit year closed in 2022 with no material impact to our Consolidated Statements of Operations.
We are no longer subject to significant U.S. federal tax examinations for years prior to 2019, or significant U.S. state or foreign income tax examinations for years prior to 2013.
It is reasonably possible that the resolution of certain tax audits could reduce our unrecognized tax benefits within the next 12 months, as certain tax positions may either be sustained on audit or we may agree to certain adjustments, or resulting from the expiration of statutes of limitations in various jurisdictions. It is not expected that any change would have a material impact on our Consolidated Financial Statements.
Deferred Income Taxes
Deferred income taxes are provided for the temporary differences between the financial reporting basis and the tax basis of our assets and liabilities. The major temporary differences and their associated deferred tax assets or liabilities are as follows: | | | | | | | | | | | | | | | | | | | | | | | |
| | December 31 |
| | 2022 | | 2021 |
| | Assets | | Liabilities | | Assets | | Liabilities |
| Property, plant and equipment | $ | 15.0 | | | $ | (80.2) | | | $ | 16.8 | | | $ | (79.3) | |
| Inventories | 6.6 | | | (6.5) | | | 3.0 | | | (13.1) | |
| Accrued expenses | 52.6 | | | (.9) | | | 65.5 | | | (10.2) | |
| Net operating losses and other tax carryforwards | 25.6 | | | — | | | 29.1 | | | — | |
| Pension cost and other post-retirement benefits | 7.5 | | | (.8) | | | 14.6 | | | (.7) | |
| | | | | | | |
| Intangible assets | .1 | | | (204.5) | | | .2 | | | (200.0) | |
| Derivative financial instruments | .6 | | | (3.8) | | | 1.2 | | | (4.4) | |
| Tax on undistributed earnings (primarily from Canada and China) | — | | | (17.0) | | | — | | | (16.0) | |
| Uncertain tax positions | .8 | | | — | | | .9 | | | — | |
| Other | 11.8 | | | (5.6) | | | 5.5 | | | (5.7) | |
| Gross deferred tax assets (liabilities) | 120.6 | | | (319.3) | | | 136.8 | | | (329.4) | |
| Valuation allowance | (15.7) | | | — | | | (16.2) | | | — | |
| Total deferred taxes | $ | 104.9 | | | $ | (319.3) | | | $ | 120.6 | | | $ | (329.4) | |
| Net deferred tax liability | | | $ | (214.4) | | | | | $ | (208.8) | |
Deferred tax assets (liabilities) included in the Consolidated Balance Sheets are as follows:
| | | | | | | | | | | |
| | December 31 |
| | 2022 | | 2021 |
| Sundry | $ | 8.3 | | | $ | 8.6 | |
| Deferred income taxes | (222.7) | | | (217.4) | |
| Net deferred tax liability | $ | (214.4) | | | $ | (208.8) | |
The valuation allowance recorded primarily relates to net operating loss, tax credit, and capital loss carryforwards for which utilization is uncertain. Cumulative tax losses in certain state and foreign jurisdictions during recent years, limited carryforward periods in certain jurisdictions, future reversals of existing taxable temporary differences, and reasonable tax planning strategies were among the factors considered in determining the valuation allowance. Individually, none of these tax carryforwards presents a material exposure.
Most of our tax carryforwards have expiration dates that vary generally over the next 20 years, with no amount greater than $10.0 expiring in any one year.
Deferred withholding taxes (tax on undistributed earnings) have been provided on the earnings of our foreign subsidiaries to the extent it is anticipated that the earnings will be remitted in the future as dividends. We are not asserting permanent reinvestment on $537.0 of our earnings and have accrued tax on these undistributed earnings as presented in the table above.
Foreign withholding taxes have not been provided on certain foreign earnings which are indefinitely reinvested outside the U.S. The cumulative undistributed earnings which are indefinitely reinvested as of December 31, 2022, are $327.9. If such earnings were repatriated to the U.S. through dividends, the resulting incremental tax expense would approximate $17.3, based on present income tax laws.
O—Other Expense (Income), Net
The components of other expense (income), net were as follows: | | | | | | | | | | | | | | | | | |
| | Year Ended December 31 |
| | 2022 | | 2021 | | 2020 |
| | | | | |
| | | | | |
| $ | 1.4 | | | $ | (.3) | | | $ | 7.6 | |
| | | | | |
| Currency (gain) loss | (3.3) | | | 1.3 | | | 2.4 | |
| | | | | |
Loss (gain) from diversified investments associated with the ESU program (See Note L) | 8.4 | | | (6.2) | | | (6.0) | |
Insurance proceeds 1 | (.8) | | | (6.6) | | | — | |
COVID-19 government subsidies 2 | (.6) | | | (3.5) | | | (21.4) | |
Non-service pension (income) expense (See Note M) | (4.1) | | | (1.4) | | | (1.1) | |
| Other | (.8) | | | (1.2) | | | (3.9) | |
| $ | .2 | | | $ | (17.9) | | | $ | (22.4) | |
1 The 2021 amount includes the receipt of $5.0 from a business interruption policy for COVID-19 disruptions.
2 This represents government subsidies related to COVID-19 primarily from our international locations, which do not contain material restrictions on our operations, sources of funding or otherwise. Also in 2020, we deferred our payment of employer's U.S. Social Security match as discussed in Note I.
P—Accumulated Other Comprehensive Income (Loss)
The following table sets forth the changes in each component of accumulated other comprehensive income (loss):
| | | | | | | | | | | | | | | | | | | | | | | |
| Foreign Currency Translation Adjustments | | Cash
Flow
Hedges | | Defined
Benefit
Pension
Plans | | Accumulated
Other
Comprehensive
Income (Loss) |
| Balance at January 1, 2020 | $ | (21.5) | | | $ | (4.1) | | | $ | (51.2) | | | $ | (76.8) | |
| Other comprehensive income (loss) | 27.8 | | | 4.5 | | | (15.8) | | | 16.5 | |
Reclassifications, pretax 1 | — | | | 2.4 | | | 4.0 | | | 6.4 | |
| Income tax effect | — | | | (1.4) | | | 2.8 | | | 1.4 | |
| Attributable to noncontrolling interest | .1 | | | — | | | — | | | .1 | |
| Balance at December 31, 2020 | 6.4 | | | 1.4 | | | (60.2) | | | (52.4) | |
| Other comprehensive income (loss) | (18.2) | | | 14.6 | | | 24.0 | | | 20.4 | |
Reclassifications, pretax 2 | — | | | (.6) | | | 5.3 | | | 4.7 | |
| Income tax effect | — | | | (3.5) | | | (7.6) | | | (11.1) | |
| Attributable to noncontrolling interest | .1 | | | — | | | — | | | .1 | |
| Balance at December 31, 2021 | (11.7) | | | 11.9 | | | (38.5) | | | (38.3) | |
| Other comprehensive income (loss) | (71.8) | | | (3.7) | | | 23.8 | | | (51.7) | |
Reclassifications, pretax 3 | — | | | (.5) | | | 2.5 | | | 2.0 | |
| Income tax effect | — | | | .7 | | | (6.2) | | | (5.5) | |
| | | | | | | |
| Balance at December 31, 2022 | $ | (83.5) | | | $ | 8.4 | | | $ | (18.4) | | | $ | (93.5) | |
| | | | | | | |
1 2020 pretax reclassifications are comprised of: | | | | | | | |
| Net trade sales | $ | — | | | $ | (1.4) | | | $ | — | | | $ | (1.4) | |
| Cost of goods sold; selling and administrative expenses | — | | | (.7) | | | — | | | (.7) | |
| Interest expense | — | | | 4.5 | | | — | | | 4.5 | |
| Other expense (income), net | — | | | — | | | 4.0 | | | 4.0 | |
Total 2020 reclassifications, pretax | $ | — | | | $ | 2.4 | | | $ | 4.0 | | | $ | 6.4 | |
| | | | | | | |
2 2021 pretax reclassifications are comprised of: | | | | | | | |
| Net trade sales | $ | — | | | $ | (5.6) | | | $ | — | | | $ | (5.6) | |
| Cost of goods sold; selling and administrative expenses | — | | | .5 | | | — | | | .5 | |
| Interest expense | — | | | 4.5 | | | — | | | 4.5 | |
| Other expense (income), net | — | | | — | | | 5.3 | | | 5.3 | |
Total 2021 reclassifications, pretax | $ | — | | | $ | (.6) | | | $ | 5.3 | | | $ | 4.7 | |
| | | | | | | |
3 2022 pretax reclassifications are comprised of: | | | | | | | |
| Net trade sales | $ | — | | | $ | (3.6) | | | $ | — | | | $ | (3.6) | |
| Cost of goods sold; selling and administrative expenses | — | | | .8 | | | — | | | .8 | |
| Interest expense | — | | | 2.3 | | | — | | | 2.3 | |
| Other expense (income), net | — | | | — | | | 2.5 | | | 2.5 | |
Total 2022 reclassifications, pretax | $ | — | | | $ | (.5) | | | $ | 2.5 | | | $ | 2.0 | |
Q—Fair Value
We utilize fair value measures for both financial and non-financial assets and liabilities.
Items measured at fair value on a recurring basis
Fair value measurements are established using a three-level valuation hierarchy that prioritizes the inputs to valuation techniques used to measure fair value into the following categories:
•Level 1: Quoted prices for identical assets or liabilities in active markets.
•Level 2: Inputs, other than quoted prices included in Level 1, that are observable for the asset or liability either directly or indirectly. Short-term investments in this category are valued using discounted cash flow techniques with all significant inputs derived from or supported by observable market data. Derivative assets and liabilities in this category are valued using models that consider various assumptions and information from market-corroborated sources. The models used are primarily industry-standard models that consider items such as quoted prices, market interest rate curves applicable to the instruments being valued as of the end of each period, discounted cash flows, volatility factors, current market and contractual prices for the underlying instruments and other relevant economic measures. Substantially all of these assumptions are observable in the marketplace, can be derived from observable data, or are supported by observable levels at which transactions are executed in the marketplace.
•Level 3: Unobservable inputs that are not corroborated by market data.
The areas in which we utilize fair value measures of financial assets and liabilities are presented in the table below: | | | | | | | | | | | | | | | | | | | | | | | |
| | As of December 31, 2022 |
| | Level 1 | | Level 2 | | Level 3 | | Total |
| Assets: | | | | | | | |
| Cash equivalents: | | | | | | | |
| Bank time deposits with original maturities of three months or less | $ | — | | | $ | 129.0 | | | $ | — | | | $ | 129.0 | |
Derivative assets 1 (see Note S) | — | | | 2.9 | | | — | | | 2.9 | |
Diversified investments associated with the ESU program 1 (see Note L) | 42.8 | | | — | | | — | | | 42.8 | |
| Total assets | $ | 42.8 | | | $ | 131.9 | | | $ | — | | | $ | 174.7 | |
| Liabilities: | | | | | | | |
Derivative liabilities 1 (see Note S) | $ | — | | | $ | 5.9 | | | $ | — | | | $ | 5.9 | |
Liabilities associated with the ESU program 1 (see Note L) | 44.0 | | | — | | | — | | | 44.0 | |
| Total liabilities | $ | 44.0 | | | $ | 5.9 | | | $ | — | | | $ | 49.9 | |
| | | | | | | | | | | | | | | | | | | | | | | |
| | As of December 31, 2021 |
| | Level 1 | | Level 2 | | Level 3 | | Total |
| Assets: | | | | | | | |
| Cash equivalents: | | | | | | | |
| Bank time deposits with original maturities of three months or less | $ | — | | | $ | 114.4 | | | $ | — | | | $ | 114.4 | |
Derivative assets 1 (see Note S) | — | | | 5.9 | | | — | | | 5.9 | |
Diversified investments associated with the ESU program 1 (see Note L) | 51.0 | | | — | | | — | | | 51.0 | |
| Total assets | $ | 51.0 | | | $ | 120.3 | | | $ | — | | | $ | 171.3 | |
| Liabilities: | | | | | | | |
Derivative liabilities 1 (see Note S) | $ | — | | | $ | 1.2 | | | $ | — | | | $ | 1.2 | |
Liabilities associated with the ESU program 1 (see Note L) | 50.9 | | | — | | | — | | | 50.9 | |
| Total liabilities | $ | 50.9 | | | $ | 1.2 | | | $ | — | | | $ | 52.1 | |
1 Includes both current and long-term amounts.
There were no transfers between Level 1 and Level 2 for any of the periods presented.
The fair value for fixed rate debt (Level 1) was approximately $210.0 less than carrying value of $1,784.4 at December 31, 2022 and was approximately $130.0 greater than carrying value of $2,082.3 at December 31, 2021.
Items measured at fair value on a non-recurring basis
The primary areas in which we utilize fair value measures of non-financial assets and liabilities are allocating purchase price to the assets and liabilities of acquired companies (Note R) and evaluating long-term assets (including goodwill) for potential impairment (Note C). Determining fair values for these items requires significant judgment and includes a variety of methods and models that utilize significant Level 3 inputs (Note A). R—Acquisitions
The following table contains the estimated fair values of the assets acquired and liabilities assumed at the date of acquisition for all acquisitions during the periods presented (using inputs discussed in Note A). Of the goodwill included in the table below, none is expected to be deductible for tax purposes. | | | | | | | | | | | | | |
| 2022 | | 2021 | | |
| Accounts receivable | $ | 37.8 | | | $ | 18.3 | | | |
| Inventory | 43.0 | | | 17.0 | | | |
| Property, plant and equipment | 16.6 | | | 16.4 | | | |
| 42.5 | | | 70.9 | | | |
Other intangible assets (see Note D) | | | | | |
Customer relationships (15-year life) | 22.0 | | | 64.9 | | | |
Technology (8 to 15-year life) | 11.3 | | | 5.5 | | | |
Trademarks and trade names (15 to 20-year life) | 7.1 | | | 7.2 | | | |
Non-compete agreements and other (1 to 5-year life) | .2 | | | 2.7 | | | |
| Other current and long-term assets | 9.1 | | | 5.5 | | | |
| Current liabilities | (54.7) | | | (39.2) | | | |
| Deferred income taxes | (17.7) | | | (11.9) | | | |
| Long-term liabilities | (5.0) | | | (4.7) | | | |
| | | | | |
| Fair value of net identifiable assets | 112.2 | | 152.6 | | | |
| Less: additional consideration (receivable) | (1.3) | | | — | | | |
| | | | | |
| Less: additional contingent consideration payable | 30.2 | | | — | | | |
| | | | | |
| Net cash consideration | $ | 83.3 | | | $ | 152.6 | | | |
The following table summarizes acquisitions for the periods presented.
| | | | | | | | | | | | | | | | | | | | |
| Year Ended | | Number of
Acquisitions | | Segment | | Product/Service |
| December 31, 2022 | | 4 | | Specialized Products
Furniture, Flooring & Textile Products
| | Manufacturer of hydraulic cylinders for heavy construction equipment;
Converter and distributor of construction fabrics for the furniture and bedding industries;
Distributor of products used for erosion control and geosynthetic products for civil construction applications; Distributor of products used for erosion control and stormwater management |
| December 31, 2021 | | 3 | | Bedding Products
Furniture, Flooring & Textile Products
Specialized Products | | Manufacturer of specialty foam for the bedding and furniture industries;
Manufacturer of bent metal tubing for furniture used in office, residential, and other settings;
Manufacturer of high-pressure and high-temperature ducting, flexible joints, and components
|
| December 31, 2020 | | None | | | | |
We are finalizing all the information required to complete the purchase price allocations related to the recent acquisitions and do not anticipate any material modifications.
The results of operations of the above acquired companies have been included in the consolidated financial statements since the dates of each acquisition. The unaudited pro forma consolidated net trade sales, net earnings, and earnings per share as though these acquisitions had occurred on January 1 of each year presented are not materially different from the amounts reflected in the accompanying financial statements.
Certain of our acquisition agreements provide for additional contingent consideration to be paid based upon analysis of the closing balance sheet and if the acquired company's performance exceeds certain targeted levels through December 31, 2025. Such additional consideration will be paid in cash and the liability is recorded at discounted fair value at the acquisition date. The range of the undiscounted amounts we could be required to pay is currently estimated to be between $12.8 and $66.2. Components of the liability are based on estimates and contingent upon future events, therefore, the amounts may fluctuate materially until the payment dates. At December 31, 2022 our liability for these future payments was $31.9 ($14.4 current and $17.5 long-term). Subsequent measurement of the estimate will be recorded in "Other expense (income), net" in the Consolidated Statements of Operations. At December 31, 2021 and 2020, we had no material liability for future payments. There was no additional consideration, including interest, paid for acquisitions in the year ended 2022; we paid $.2 and $8.4 for the years ended 2021 and 2020, respectively.
A brief description of our acquisition activity by year is included below.
2022
We acquired four businesses:
•A small U.S. textiles business that converts and distributes construction fabrics for the furniture and bedding industries. This acquisition became a part of our Furniture, Flooring & Textile Products segment. The acquisition date was August 22. The purchase price was $2.2 and added no goodwill.
•A leading global manufacturer of hydraulic cylinders for heavy construction equipment. This business has manufacturing locations in Germany and China and a distribution facility in the United States. This acquisition builds scale in our hydraulic cylinders growth platform and brings us into an attractive segment of the market that aligns well with trends in automation and autonomous equipment. This business operates within our Specialized Products segment. The acquisition date was August 26. The purchase price was $89.6 and added $39.0 of goodwill.
•Two Canadian distributors of products used for erosion control, stormwater management, and various other applications that expanded the geographic scope of our Geo Components business unit. These acquisitions became a part of our Furniture, Flooring & Textile Products segment.
◦An October 3 acquisition with a purchase price of $7.4 and added $3.5 goodwill.
◦A December 16 acquisition with a purchase price of $13.0 and added no goodwill.
2021
We acquired three businesses:
•A United Kingdom (UK) manufacturer specializing in metallic ducting systems, flexible joints, and components for space, military, and commercial applications. This acquisition expanded the capabilities of our aerospace products business to include flexible joint fabrication and operates within our Specialized Products segment. The acquisition date was January 30. Following the recording of measurement period adjustments subsequent to the 2021 values shown above, the final purchase price was $27.7 and added $8.5 of goodwill.
•A Polish manufacturer of bent metal tubing for furniture used in office, residential, and other settings. This acquisition became a part of our Furniture, Flooring & Textile Products segment. The acquisition date was May 31. The purchase price was $5.4 and added $4.4 of goodwill.
•A specialty foam and finished mattress manufacturer serving the UK and Irish marketplace with two manufacturing facilities in the Dublin area. This acquisition became a part of our Bedding Products segment. The acquisition date was June 4. The purchase price was $119.7 and added $58.3 of goodwill.
2020
No businesses were acquired during 2020.
S—Derivative Financial Instruments
The following table presents assets and liabilities representing the fair value of our most significant derivative financial instruments. The fair values of the derivatives reflect the change in the market value of the derivative from the date of the trade execution and do not consider the offsetting underlying hedged item. | | | | | | | | | | | | | | | | | | | | | | | | | | | | | | | | | | | | | | |
| | | Expiring at various dates through: | | Total USD
Equivalent
Notional
Amount | | As of December 31, 2022 |
| Derivatives | | | Assets | | Liabilities |
| Other Current
Assets | | Sundry | | Other Current
Liabilities | | Other Long-Term
Liabilities |
| Designated as hedging instruments | | | | | | | | | | | | |
| Total cash flow hedges-currency hedges | | Jun 2024 | | 263.4 | | $ | 1.9 | | | $ | .5 | | | $ | 4.3 | | | $ | .4 | |
| Total fair value hedges | | Apr 2023 | | 65.5 | | .3 | | | — | | 1 | 1.0 | | | — | |
| | | | | | | | | | | | |
| | | | | | | | | | | | |
| Not designated as hedging instruments | | Dec 2023 | | 86.0 | | .2 | | | — | | | .2 | | | — | |
| Total derivatives | | | | | | $ | 2.4 | | | $ | .5 | | | $ | 5.5 | | | $ | .4 | |
| | | | | | | | | | | | | | | | | | | | | | | | | | | | | | | | | | | | | | |
| | | Expiring at various dates through: | | Total USD
Equivalent
Notional
Amount | | As of December 31, 2021 |
| Derivatives | | | Assets | | Liabilities |
| | Other Current
Assets | | Sundry | | Other Current
Liabilities | | Other Long-Term
Liabilities |
| | | | | | | | | | | | |
| | | | | | | | | | | | |
| | | | | | | | | | | | |
| | | | | | | | | | | | |
| | | | | | | | | | | | |
| | | | | | | | | | | | |
| | | | | | | | | | | | |
| Designated as hedging instruments | | | | | | | | | | | | |
| Total cash flow hedges-currency hedges | | Jun 2023 | | 260.6 | | | $ | 5.1 | | | $ | — | | | $ | .7 | | | $ | .1 | |
| | | | | | | | | | | | |
| | | | | | | | | | | | |
| Total fair value hedges | | Mar 2022 | | 54.2 | | | .4 | | | — | | | — | | | — | |
| | | | | | | | | | |
| | | | | | | | | | | | |
| | | | | | | | | | | | |
| Not designated as hedging instruments | | Dec 2022 | | 40.1 | | | .4 | | | — | | | .4 | | | — | |
| Total derivatives | | | | | | $ | 5.9 | | | $ | — | | | $ | 1.1 | | | $ | .1 | |
| | | | | | | | | | | | |
The following table sets forth the pretax (gains) losses for our hedging activities for the years presented. This schedule includes reclassifications from accumulated other comprehensive income as well as derivative settlements recorded directly to income or expense.
| | | | | | | | | | | | | | | | | | | | | | | | | | |
| | | Income Statement Caption | | Amount of (Gain) Loss Recorded in Income for the Year Ended December 31 |
| Derivatives | | 2022 | | 2021 | | 2020 |
| | | | | | | |
| Designated as hedging instruments | | | | | | | | |
Interest rate cash flow hedges 1 | | Interest expense | | $ | 2.3 | | | $ | 4.5 | | | $ | 4.5 | |
| Currency cash flow hedges | | Net trade sales | | .5 | | | (9.6) | | | 1.1 | |
| Currency cash flow hedges | | Cost of goods sold | | (2.8) | | | (.2) | | | (.1) | |
| | | | | | | | |
| Total cash flow hedges | | | | — | | | (5.3) | | | 5.5 | |
| Fair value hedges | | Other expense (income), net | | 3.5 | | | (5.9) | | | (.2) | |
| Not designated as hedging instruments | | Other expense (income), net | | (1.3) | | | (1.9) | | | .2 | |
| | | | | | | | |
| | | | | | | | |
| | | | | | | | |
| | | | | | | | |
| | | | | | | | |
| | | | | | | | |
| | | | | | | | |
| Total derivative instruments | | | | $ | 2.2 | | | $ | (13.1) | | | $ | 5.5 | |
| | | | | | | | |
| | | | | | | | |
1 In the fourth quarter of 2021, in connection with our issuance of our $500.0 senior notes due 2051, we settled $300.0 of treasury locks and recognized a gain of $10.2, which is being amortized over the life of the notes. In the third quarter of 2022, we completed amortization of the $43.0 loss on our $200.0 forward starting interest rate swap that was related to our 2012 $300.0 senior notes; the 2012 issuance matured and was fully paid in the third quarter of 2022.
T—Contingencies
We are a party to various proceedings and matters involving employment, intellectual property, environmental, taxation, vehicle-related personal injury, antitrust, and other laws. When it is probable, in management's judgment, that we may incur monetary damages or other costs resulting from these proceedings or other claims, and we can reasonably estimate the amounts, we record appropriate accruals in the financial statements and make charges against earnings. For all
periods presented, we have recorded no material charges against earnings. Also, when it is reasonably possible that we may incur additional loss in excess of recorded accruals, and we can reasonably estimate the additional losses or range of losses, we disclose such additional reasonably possible losses in these notes.
Accruals and Reasonably Possible Losses in Excess of Accruals
Accruals for Probable Losses
Although we deny liability in all currently threatened or pending litigation proceedings in which we are or may be a party, and believe that we have valid bases to contest all claims threatened or made against us, we recorded a litigation contingency accrual for our reasonable estimate of probable loss for pending and threatened litigation proceedings, in aggregate, of $.9, $1.0, and $.5 at December 31, 2022, 2021, and 2020, respectively. There were no material adjustments to the accrual, including cash payments and expense, for each of the years ended December 31, 2022, 2021, and 2020, respectively. The accruals do not include accrued expenses related to workers' compensation, vehicle-related personal injury, product and general liability claims, taxation issues, and environmental matters, some of which may contain a portion of litigation expense. However, any litigation expense associated with these categories is not anticipated to have a material effect on our financial condition, results of operations, or cash flows. For more information regarding accrued expenses, see Note I. Reasonably Possible Losses in Excess of Accruals
Although there are a number of uncertainties and potential outcomes associated with all of our pending or threatened litigation proceedings, we believe, based on current known facts, that additional losses, if any, are not expected to materially affect our consolidated financial position, results of operations, or cash flows. However, based upon current known facts, as of December 31, 2022, aggregate reasonably possible (but not probable, and therefore not accrued) losses in excess of the accruals noted above are estimated to be $11.0. If our assumptions or analyses regarding these contingencies are incorrect, or if facts change, we could realize losses in excess of the recorded accruals (and in excess of the $11.0 referenced above), which could have a material negative impact on our financial condition, results of operations, and cash flows.
LEGGETT & PLATT, INCORPORATED
SCHEDULE II—VALUATION AND QUALIFYING ACCOUNTS AND RESERVES
(Amounts in millions)
| | | | | | | | | | | | | | | | | | | | | | | |
| Column A | Column B | | Column C | | Column D | | Column E |
| Description | Balance
at
Beginning
of Period | | Additions
(Credited)
to Cost
and
Expenses | | Deductions | | Balance
at End of
Period |
| Year ended December 31, 2022 | | | | | | | |
| Allowance for doubtful receivables | $ | 37.0 | | | $ | 3.2 | | | $ | 1.2 | | 1 | $ | 39.0 | |
| | | | | | | |
| Tax valuation allowance | $ | 16.2 | | | $ | (.4) | | | $ | .1 | | | $ | 15.7 | |
| | | | | | | |
| Year ended December 31, 2021 | | | | | | | |
| Allowance for doubtful receivables | $ | 42.0 | | | $ | (3.4) | | | $ | 1.6 | | 1 | $ | 37.0 | |
| | | | | | | |
| Tax valuation allowance | $ | 18.1 | | | $ | (.1) | | | $ | 1.8 | | | $ | 16.2 | |
| | | | | | | |
| Year ended December 31, 2020 | | | | | | | |
| Allowance for doubtful receivables | $ | 26.8 | |
| $ | 17.1 | | | $ | 1.9 | | 1 | $ | 42.0 | |
| | | | | | | |
| Tax valuation allowance | $ | 16.8 | | | $ | 2.5 | | | $ | 1.2 | | | $ | 18.1 | |
| | | | | | | |
1Uncollectible accounts charged off, net of recoveries.
EXHIBIT INDEX
| | | | | | | | | | | |
| Exhibit No. | | Document Description | |
| | | |
| 3.1 | | | |
| | | |
| 3.2 | | | |
| | | |
| 4.1 | | | |
| | | |
| 4.2 | | | |
| | | |
| 4.2.1 | | Tri-Party Agreement under the May 6, 2005 Senior Indenture, between the Company, The Bank of New York Mellon Trust Company, NA (successor in interest to JPMorgan Chase Bank, N.A.) (as Prior Trustee) and U.S. Bank, National Association (now U.S. Bank Trust Company, National Association as Successor Trustee), dated February 20, 2009, filed February 25, 2009 as Exhibit 4.3.1 to the Company’s Form 10-K for the year ended December 31, 2008, is incorporated herein by reference. (SEC File No. 001-07845) | |
| | | |
| 4.3 | | | |
| | | |
| 4.4 | | | |
| | | |
| 4.5 | | | |
| | | |
| 4.6 | | | |
| | | |
| 4.7** | | | |
| | | |
| 10.1* | | | |
| | | |
| 10.2* | | | |
| | | |
| 10.3* | | | |
| | | | | | | | | | | |
| Exhibit No. | | Document Description | |
| | | |
| | | |
| 10.4* | | | |
| | | |
| 10.5* | | | |
| | | |
| 10.6* | | | |
| | | |
| 10.7* | | | |
| | | |
| 10.8* | | | |
| | | |
| 10.9* | | | |
| | | |
| 10.10* | | | |
| | | |
| 10.11* | | | |
| | | |
| 10.12* | | | |
| | | |
| 10.13* | | | |
| | | |
| 10.13.1* | | | |
| | | |
| 10.13.2* | | | |
| | | |
| 10.13.3* | | | |
| | | |
10.13.4*,** | | | |
| | | |
| | | | | | | | | | | |
| Exhibit No. | | Document Description | |
| | | |
| 10.13.5* | | | |
| | | |
10.13.6*,** | | | |
| | | |
| 10.13.7* | | | |
| | | |
| 10.13.8* | | | |
| | | |
| 10.13.9* | | | |
| | | |
| 10.13.10* | | | |
| | | |
| 10.13.11* | | | |
| | | |
| 10.13.12* | | | |
| | | |
| 10.14* | | | |
| | | |
| 10.14.1* | | | |
| | | |
| 10.14.2* | | | |
| | | |
10.15*,** | | | |
| | | |
| 10.16* | | | |
| | | |
| 10.17* | | | |
| | | |
10.18*,** | | | |
| | | | | | | | | | | |
| Exhibit No. | | Document Description | |
| | | |
| | | |
| 10.19* | | | |
| | | |
| 10.20* | | | |
| | | |
| 10.21* | | | |
| | | |
| 10.22* | | | |
| | | |
| 10.23* | | | |
| | | |
| 10.24 | | | |
| | | |
| 10.25 | | | |
| | | |
| 10.26 | | | |
| | | |
| 10.27 | | | |
| | | |
| 21** | | | |
| | | |
| 23** | | | |
| | | |
| 24** | | | |
| | | |
| 31.1** | | | |
| | | |
| 31.2** | | | |
| | | |
| 32.1** | | | |
| | | |
| | | | | | | | | | | |
| Exhibit No. | | Document Description | |
| | | |
| 32.2** | | | |
| | | |
| 101.INS*** | | Inline XBRL Instance Document - the instance document does not appear in the Interactive Data File because its XBRL tags are embedded within the Inline XBRL document. | |
| | | |
| 101.SCH*** | | Inline XBRL Taxonomy Extension Schema. | |
| | | |
| 101.CAL*** | | Inline XBRL Taxonomy Extension Calculation Linkbase. | |
| | | |
| 101.DEF*** | | Inline XBRL Taxonomy Extension Definition Linkbase. | |
| | | |
| 101.LAB*** | | Inline XBRL Taxonomy Extension Label Linkbase. | |
| | | |
| 101.PRE*** | | Inline XBRL Taxonomy Extension Presentation Linkbase. | |
| | | |
| 104 | | Cover Page Interactive Data File - the cover page interactive data file does not appear in the Interactive Data File because its XBRL tags are embedded within the Inline XBRL document. | |
______________________________
| | | | | | | | |
| * | Denotes management contract or compensatory plan or arrangement. | |
| ** | Denotes filed or furnished herewith. | |
| *** | Filed as Exhibit 101 to this report are the following formatted in Inline XBRL (eXtensible Business Reporting Language): (i) Consolidated Statements of Operations for each year in the three year period ended December 31, 2022; (ii) Consolidated Statements of Comprehensive Income (Loss) for each year in the three year period ended December 31, 2022; (iii) Consolidated Balance Sheets at December 31, 2022 and December 31, 2021; (iv) Consolidated Statements of Cash Flows for each year in the three year period ended December 31, 2022; (v) Consolidated Statements of Changes in Equity for each year in the three year period ended December 31, 2022; and (vi) Notes to Consolidated Financial Statements. | |
Item 16. Form 10-K Summary.
None.
SIGNATURES
Pursuant to the requirements of Section 13 or 15(d) of the Securities Exchange Act of 1934, the registrant has duly caused this report to be signed on its behalf by the undersigned, thereunto duly authorized. | | | | | | | | |
| LEGGETT & PLATT, INCORPORATED |
| | |
| By: | /s/ J. MITCHELL DOLLOFF |
| | J. Mitchell Dolloff |
| | President and Chief Executive Officer |
| | |
Date: February 24, 2023
Pursuant to the requirements of the Securities Exchange Act of 1934, this report has been signed below by the following persons on behalf of the registrant and in the capacities and on the dates indicated. | | | | | | | | | | | | | | |
| Signature | | Title | | Date |
| | |
| (a) Principal Executive Officer: | | | | |
| | |
/s/ J. MITCHELL DOLLOFF | | President and Chief Executive Officer
(Director) | | February 24, 2023 |
| J. Mitchell Dolloff | | |
| | |
| (b) Principal Financial Officer: | | | | |
| | |
/s/ JEFFREY L. TATE | | Executive Vice President and Chief Financial Officer | | February 24, 2023 |
| Jeffrey L. Tate | | |
| | |
| (c) Principal Accounting Officer: | | | | |
| | |
/s/ TAMMY M. TRENT | | Senior Vice President and Chief Accounting Officer | | February 24, 2023 |
| Tammy M. Trent | | |
| | |
| (d) Directors: | | | | |
| | | | |
ANGELA BARBEE* | | Director | | |
| Angela Barbee | | | | |
| | | | |
MARK A. BLINN* | | Director | | |
| Mark A. Blinn | | | | |
| | | | |
ROBERT E. BRUNNER* | | Director | | |
| Robert E. Brunner | | | | |
| | | | |
MARY CAMPBELL* | | Director | | |
| Mary Campbell | | | | |
| | | | | | | | | | | | | | |
| Signature | | Title | | Date |
| | | | |
MANUEL A. FERNANDEZ* | | Director | | |
| Manuel A. Fernandez | | | | |
| | |
KARL G. GLASSMAN* | | Director | | |
| Karl G. Glassman | | | | |
| | | | |
JOSEPH W. MCCLANATHAN* | | Director | | |
Joseph W. McClanathan | | | | |
| | | |
JUDY C. ODOM* | | Director | | |
| Judy C. Odom | | | | |
| | | | |
SRIKANTH PADMANABHAN* | | Director | | |
| Srikanth Padmanabhan | | | | |
| | | |
JAI SHAH* | | Director | | |
| Jai Shah | | | | |
| | | | |
PHOEBE A. WOOD* | | Director | | |
| Phoebe A. Wood | | | | |
| | | | | | | | | | | |
| | | |
| | | |
| *By: | /s/ SCOTT S. DOUGLAS | | |
| | Scott S. Douglas | | February 24, 2023 |
| | Attorney-in-Fact
Under Power-of-Attorney
dated | |
| February 23, 2023 | | |